Also at ]Department of Mathematics, University of Leicester, Leicester, United Kingdom
Collision of nanoparticles of covalently bound atoms. Impact of stress-dependent adhesion
Abstract
The impact of nanoparticles (NPs) comprised of atoms with covalent bonding is investigated numerically and theoretically. We use recent models of covalent bonding of carbon atoms and elaborate a numerical model of amorphous carbon (a-C) NPs, which may be applied for modelling soot particles. We compute the elastic moduli of the a-C material which agree well with the available data. We reveal an interesting novel phenomenon – stress dependent adhesion, which refers to stress-enhanced formation of covalent bonds between contacting surfaces. We observe that the effective adhesion coefficient linearly depends on the maximal stress between the surfaces and explain this dependence. We compute the normal restitution coefficient for colliding NPs and explore the dependence of the critical velocity, demarcating bouncing and aggregative collisions, on the NP radius. Using the obtained elastic and stress-dependent adhesive coefficients we develop a theory for the critical velocity. The predictions of the theory agree very well with the simulation results.
- Keywords
-
nanoparticles, collision, aggregation, adhesion, covalent bonding, amorphous carbon, carbon black, soot, molecular dynamics
I Introduction
In numerous natural and technological processes, collisions of micro- and nano-size particles are observed. The collision outcome generally depends on the impact velocity, material properties of particles and their structure. Small particles with not very large impact speed usually form a joint aggregate upon a collision. Solid particles suspended in the air (dust, soot, pollen), aggregate into larger one, which subside to the ground, see e.g. [1, 2, 3]. The concentration and size distribution of such particles in the air determines its quality. Hence it is important to develop a predictive model for particle aggregation. Aggregative collisions also play a crucial role in many astrophysical phenomena, like planetary rings and planetesimal formation, evolution of interstellar dust clouds and other, e.g. [4, 5, 6, 7, 8, 9, 10, 11].
An important parameter which discriminates bouncing and aggregative collisions is the critical impact velocity [7, 9, 12, 13]. For the impact velocities smaller than the critical one, , particles aggregates, while for the larger one, – rebound (here we do not consider the disruptive collisions). The appearance of the critical velocity is associated with the energy losses at a collision. They are attributed to the dissipation in the bulk of viscoelastic material and to irreversible formation of an adhesive contact at the impact. If the initial kinetic energy of the relative motion is larger than the energy losses, particles bounce, otherwise – stick.
The critical velocity sensitively depends on many parameters, including the particles size, their bulk and surface material properties. The latter include elastic constants, viscous constants and coefficient of adhesion [12]. Depending on the material, different mechanisms of losses – bulk or surface, can dominate [13]. Commonly, however, the formation of the adhesive contact is much more energy costly then the bulk dissipation, especially for small particles. Modelling particles collisions, e.g. [14, 15, 16, 17, 18], the authors either use macroscopic interaction laws between two bodies, or microscopic inter-atomic potential for inter and intra-clusters interactions. In the former case the material parameters are assumed to be constant. In the latter one the atomic potentials, although being sometimes rather sophisticated, do not account for the chemical bonding between constituting atoms. In our study we analyze the collisions of aggregates comprised of atoms with covalent bonds. The most prominent example of such particles are carbon particles, mainly soot, – the main contaminater of the air.
The inter-atomic interaction potential in our systems explicitly describes the formation of chemical bonds between atoms. Moreover, in the course of a contact the chemical bonds may be formed between atoms from different aggregates, that is, the bonds may arise between clusters. Such an effect has a significant impact on the overall collision dynamics. Indeed, the formation of the inter-cluster chemical bonds depends on the mutual compression of cluster surfaces at a contact; the compression is caused by the stress at the contact zone. The larger the compression (and the contact stress), the larger the number of emerging inter-cluster bonds. The latter noticeably contribute to the adhesion energy of the contacting surfaces, manifesting a novel phenomenon – stress dependent adhesion.
The contact stress at a collision depends, in its turn, on the kinetic energy of the colliding aggregates, that is, on the impact speed . Hence the adhesion energy, which hinders bouncing, depends on resulting in a complicated dependence of the critical velocity on the system parameters. The goal of the present study is to explore and explain this dependence. The rest of the article is organized as follows. In the next Sec. II we describe the simulation model. In Sec. III we report the simulation results. Sec. IV is devoted to the theory of the critical sticking velocity, for stress-dependent adhesion. Finally, in Sec. V we summarize our findings.
II Physical model and simulation detail
In our study we focus on amorphous carbon (a-C) nano-particles which are the most important for applications, as the model of soot particles. The size of soot particles varies in the range from to Å; they are almost spherical in shape [19]. Below we discuss in detail the model of a-C soot particles.
II.1 Model of bulk amorphous carbon
To develop an adequate model of a-C nano-particles, we start from the model of bulk material. Using the periodic boundary conditions we apply a rapid cooling (quench) of random structure of carbon atoms. As we show below, this approach yields the model, that reproduces rather accurately the mechanical properties of amorphous carbon – the elastic moduli and Poisson’s ratio.
Initially the carbon atoms were uniformly placed in a simple cubic lattice with the lattice constant Å, which provides the target density of about . After that, the atoms were randomly displaced from their initial positions in each axial direction on a distance , uniformly distributed from to . Then the system was relaxed in periodic boundary conditions and constant volume with the energy minimization; we apply the Polak-Ribiere conjugate gradient algorithm as it is implemented in the LAMMPS software package [20]. After the energy minimization we performed two-stage quench: An isochoric, , cooling from K to K for 3080 ps and then an isobaric, , cooling for 1000 ps from K to normal conditions with K and pressure MPa.
Similar to Ref. [21] we used a relatively low cooling rate of K/ps. It is much smaller than K/ps of Ref. [22], but still larger then the experimental one of K/ps [21], which is hardly achievable in present MD simulations due to a high computational cost.
As a reasonable compromise between the precision and computational expenses we used the modified version of the Adaptive Intermolecular Reactive Empirical Bond Order potential (AIREBO) [23], with non-bonded pairwise interactions described by Morse potential (AIREBO-M) [24]. The AIREBO-M is based on the Reactive Empirical Bond Order potential of second generation (REBO2) [25]. It is capable to model amorphous carbon with the density of and below [26]. Here we used the full version of AIREBO-M potential with the torsion term and the cutoff distance , where is the equilibrium inter-atomic distance for the Morse potential [24]. The obtained final mass density of the bulk a-C material was . It differs from the initial density due to periodic cell relaxation at NpT conditions.
II.2 Nanoparticle model
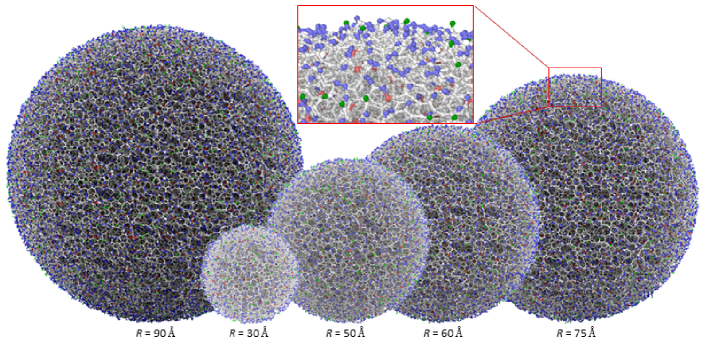
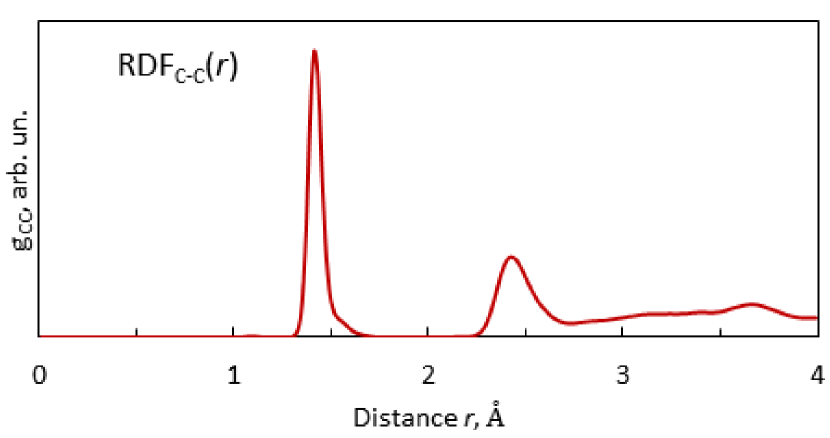
In order to construct nanoparticles of different size, the bulk a-C periodic cell, generated as discussed above, was periodically replicated along all three axes. Then, the spherical particles of the radii and were cut from the resulting volume. Nanoparticles (NPs) were relaxed at room temperature K. After that, the under-coordinated carbon atoms on the surface of the NPs with the coordination number (“chemical radicals”) were replaced by the hydrogen (H) atoms; the valence rule is obviously satisfied, as the valence of H atom is 1. To find the coordination number, we computed the radial distribution function (RDF) for C-C pairs, see Fig. 7 of the Appendix A, and used the characteristic distance of . We considered two atoms as bounded if their inter-center distance does not exceed . This value of corresponds to the maximal extension of the first peak of the RDF, see Fig. 7. Atoms with two neighbours, , are considered as -hybridized (they may form a linear polymer), with three neighbours, , – as -hybridized (may form a planar compound), and with the four ones, , – -hybridized (may form a tetrahedral structure). Note that our model lacks over-coordinated C atoms with . The constructed nanoparticles are depicted in Fig. 1 and the parameters of the model are summarized in Table 1.
| , Å | 111Total number of atoms in the NP, . | -C, % | -C, % | H, % | 222Surface concentration of H atoms, in . |
|---|---|---|---|---|---|
| 30 | 12.4 | 9.7 | 2.9 | 1.0 | 1.11 |
| 50 | 57.2 | 6.9 | 3.1 | 0.6 | 1.09 |
| 60 | 100 | 6.2 | 3.1 | 0.5 | 1.06 |
| 75 | 193 | 5.5 | 3.2 | 0.4 | 1.14 |
| 90 | 334 | 5.0 | 3.2 | 0.4 | 1.24 |
III Simulation results
As it follows from the previous studies of particles collisions, the crucial role in the impact dynamics play such physical properties as elastic moduli, Poisson’s ratio and the adhesion coefficient of particles surface [14, 16, 17, 18, 12, 13, 29]. Therefore it is worth to measure these quantities for our model of a-C.
III.1 Elastic moduli and Poisson’s ratio
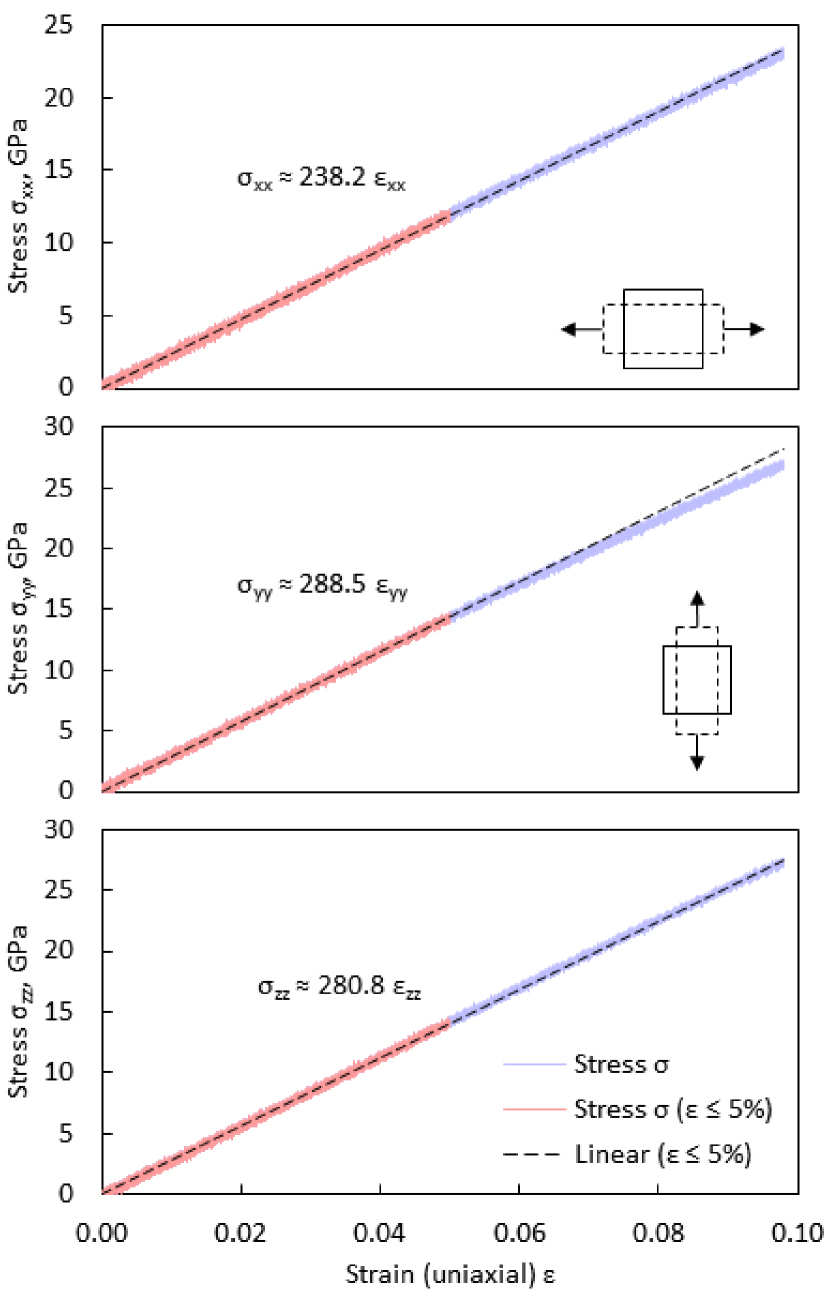
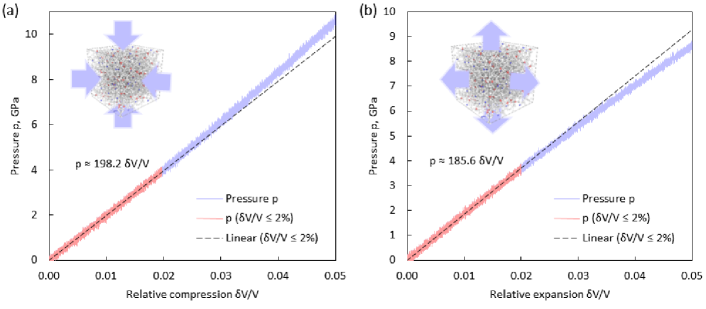
The values of Young’s modulus and Poisson’s ratio for the model material can be obtained by means of non-equilibrium molecular dynamics (NEMD) simulations, namely, by MD of slow (quasi-static) uniaxial expansion and the stress-strain curve analysis. By this way may be evaluated from the slope of the stress-strain curve, and can be obtained directly as a ratio between the transverse contraction and axial (longitudinal) strain [30]. However, in order to obtain accurate estimates we performed two series of independent simulations: (a) Three simulations of the uniaxial extension along each of the three axis independently at constant temperature K and load-free conditions for other four sides. That is, if the extension was along -axis, the normal stresses at the boundaries , , and was kept zero, ); this yielded the Young modulus. (b) Two simulations of uniform isothermal compression-expansion to evaluate the bulk modulus . Then the Poisson’s ratio can be found from the following expression,
| (1) |
In both series of simulations the slow enough strain rate was used, , which was a few order of magnitude smaller that the strain-rate of exploited in Ref. [31]. Using the regime of linear deformations, we obtained the following results for the elastic moduli (see Appendix A for more detail):
| (2) |
Substituting the above values into the Eq. (1) yields the Poisson’s ratio, .
It is interesting to compare the obtained quantities with the available in literature data for similar materials. Our results are in a very good agreement with the estimates obtained in Ref. [22] by the density functional theory. Indeed, for the a-C with density the authors reported , and , which are very close to the above result, Eq. (2). This strongly supports our choice of the AIREBO-M potential for an adequate modelling of amorphous carbon; further justification for the usage of this potential is presented in Appendix A.
With the obtained estimates for , and one can find the longitudinal and transverse sound velocities in the bulk of the material,
giving and . These estimates allow to assess the collision regime – super-sonic, subsonic, or quasi-static for different impact velocities [32].
III.2 Stress dependent adhesion
The adhesion characterizes the strength of the inter-surface contact. It is quantified by the work needed to move the surfaces from their contact to the infinite separation; it is done against the attractive surface forces. The specific work per unit area is called the adhesion coefficient . For the contact of the same material is twice the surface tension of this material in vacuum [33].
The parameter may be estimated with the use of the bidirectional constant-velocity steered MD (cv-SMD) simulation with the potential of mean force (PMF) [34]. To apply this technique, one needs to prepare a model of two a-C plates with hydrogenated surfaces, infinite in and directions, see Fig. 2a. We used the computational box with the dimensions of and periodic boundary conditions along and axis. The surface concentration of hydrogen atoms was .
The bidirectional simulation includes two stages – the forward and reverse one. In the former stage the applied external force pulls the surfaces of the plates into a contact and then press them together; this causes an enforced adhesion, see Fig. 2a-c.
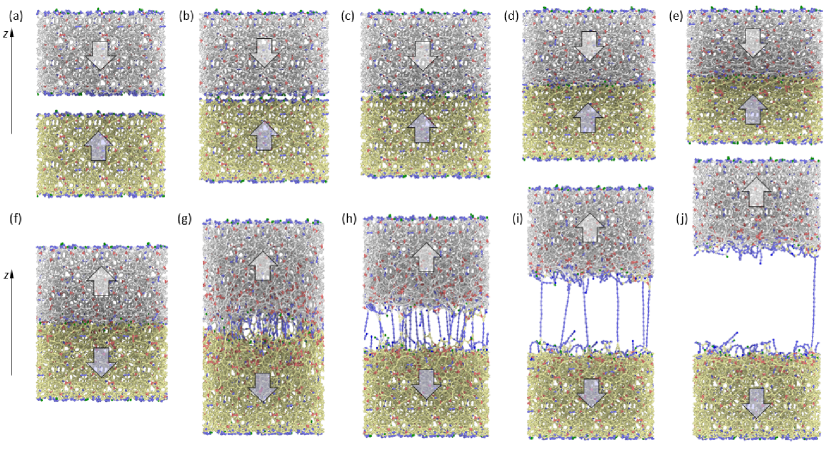
The later stage corresponds to the forced separation of the surfaces. In this case the external force performs the work to separate the plates, breaking all covalent bonds emerging during the forced adhesion, see Fig. 2d-f. Measuring this work as a function of the distance between surfaces at large separation in the reverse stage, one can estimate the adhesion energy. The dependence of the work of the external force, which is also called the potential of mean force (PMF), on the surface separation is depicted in Fig. 3, yielding the estimate, .
The results of cv-SMD simulations are illustrated in Fig. 2 and Fig. 3. During the first stage of SMD, the plates move form their initial positions, toward each other under the action of the external force, Fig. 2a. The force is modelled by a harmonic spring connecting the centers of mass of two plates, with a uniformly contracting equilibrium length . The force is distributed among all atoms of the plates, proportionally to the masses of atoms, and the equilibrium length decreases with the constant rate of , which is slow enough to guarantee the quasi-static process. At the moment of contact, covalent C-C bonds are formed between the surfaces, Fig. 2b. With the further approach, the elastic stress increases and the plates undergo deformation. At this moment new covalent bonds are formed Fig. 2c. Note, that zero-stress conditions were applied at the periodic boundaries . After achieving the maximal stress, the contraction of the equilibrium length of the virtual spring altered to a uniform elongation, with the same rate of . This leaded to the separation of contact surfaces Fig. 2d. During the separation, linear chains of -hybridized carbon – the carbynes [35], were formed between the surfaces, Fig. 2e,f. Given that the carbyne has a high tensile strength, these chains made the separation of the plates much more difficult. The interacting surfaces underwent noticeable structural changes. For instance, after the complete separation, a surface of one of the plates demonstrated loops and chains, formed by -C atoms from another plate, see Fig. 4, where the yellow carbyne chains are comprised by foreign atoms (Fig. 4c). As it can be seen, after the separation the number of -hybridized carbon atoms increased.
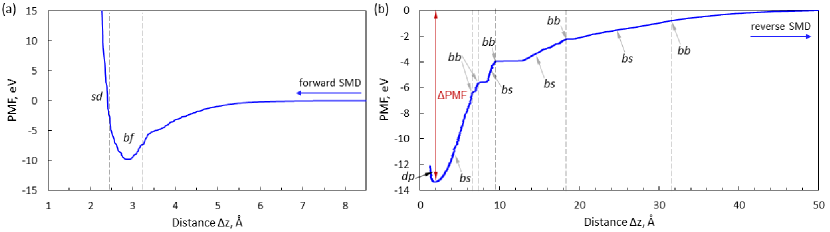
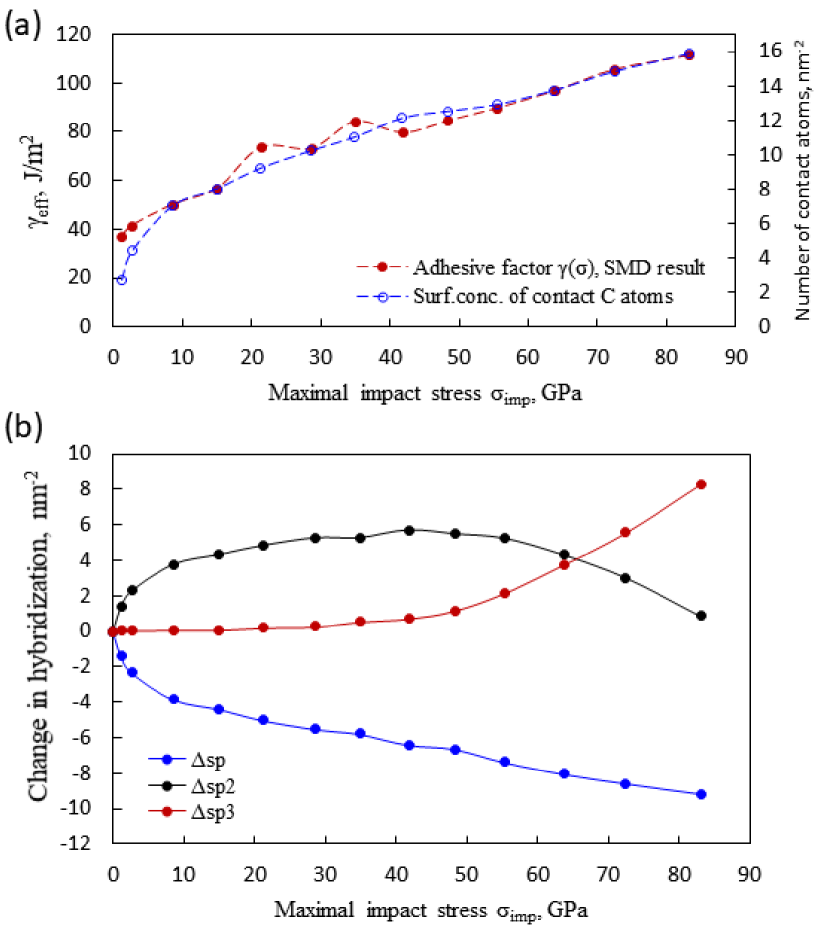
Hence the adhesion-separation is a strongly irreversible process, with the formation and breakage of covalent bonds. The absolute value of the external force work is much larger in the reverse process then in the forward one. The excess energy of this irreversible process is adsorbed by the thermostat. For the setup depicted in Fig. 3, the maximal stress was GPa and keV for the surface area of . This yields the adhesion coefficient . With the larger maximal stress the larger number of new bonds can be formed. Indeed, owing to the deformation of the material, a larger number of atoms from different surfaces are brought into a contact with each other. If the deformation is strong enough, even atoms from the subsurface layers can form bonds with the atoms from another plate. Next, we explored how the separation work depends on the maximal contact stress . We performed a series of additional cv-SMD simulations for different . The according simulation results are presented in Fig. 4(a, b).
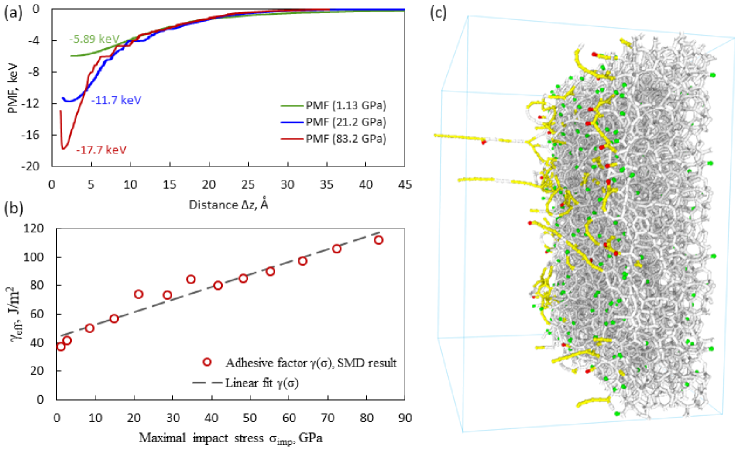
As it can be seen monotonically increases with increasing maximal contact stress, Fig. 4b. Qualitatively, this may be understood as follows. With the increasing stress, two surfaces come closer and closer to each other, which results in the increasing number of atoms that can form covalent bonds. All these bonds become broken when the surfaces are separated. The energy needed to break all the emergent bonds contributes to the adhesion energy and thus to the adhesion coefficient. Generally, one can write for the adhesion coefficient:
| (3) |
where characterizes the part of the adhesion coefficient, associated with the non-bonding interactions, while – with the broken bonds emerging at a contact. The latter may be written as a product of the surface density of emerging bonds, which depends on the maximum stress, and the average energy per the bond, . Naturally, the surface density of the emergent bonds is proportional to the number of surface atom of the different plates in a tight contact. The later increases with the compression and thus with the contact stress . Except for the initial part, where the surface roughness dominates, the dependence is almost linear, that is , where is the number of surface contacts for vanishing contact stress, see Fig. 10 of the Appendix B. may be also approximated by a constant, which yields, the linear dependence for :
III.3 Coefficient of normal restitution and critical velocity
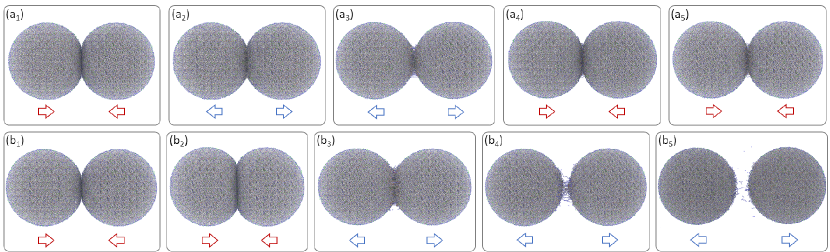
We performed a series of about forty simulations of head-on collisions, varying the impact velocity and nanoparticles size . We used classical molecular dynamics (MD) simulations with the microcanonical ensemble, that is, we explored adiabatic collisions, where the total energy of the system is conserved. The set of impact snapshots for two colliding NPs of radii is presented in Fig. 5. The snapshots () on the upper panel illustrate the aggregative collision for the impact velocity 1000 m/s; the covalently bonded aggregate is formed. On the contrary, the snapshots () on the bottom panel show the bouncing collision with the impact velocity 2000 m/s.
The after-collision relative velocity of the particles was measured for each impact, and the coefficient of normal restitution was evaluated, according to its definition, e.g. [36],
as the function of the impact velocity .
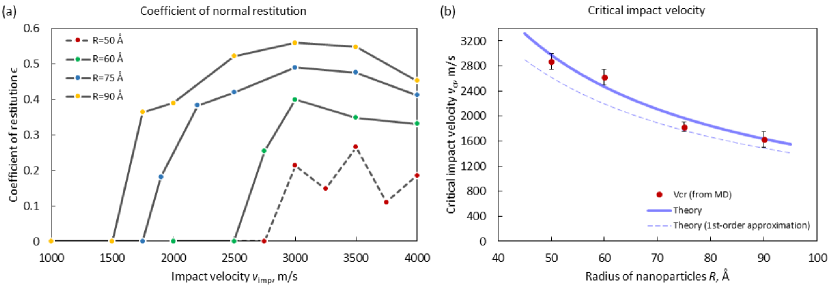
The results of these simulations for 50, 60, 75 and 90 are presented in Fig. 6a. As it can be seen from the figure, for the impact velocity below some threshold , the coefficient of normal restitution becomes zero, ; this means that the particles stick together. Moreover, in accordance with the theory [12], the critical sticking velocity for decreases with the increasing particle size. Fig. 6b (points) illustrates the obtained dependence of the critical velocity on the NP radius, .
IV Theory
The theory of the critical sticking velocity has been developed in Ref.[12] for particles with usual (stress-independent) surface properties. Here we generalize it for the surfaces that can form covalent bonds and thus demonstrate stress-dependent adhesion. Generally, the energy conservation in a head-on collision reads,
| (5) |
where is the effective mass ( is the particle mass). Eq. (5) simply states that the initial kinetic energy of the relative motion is equal to the final kinetic energy plus the energy losses due to the viscous dissipation in the bulk of the material, and irreversible work of adhesion , associated with the formation and breakage of the contact at the impact. For the case of sticking velocity . Commonly, the work of adhesion for small particles significantly exceeds the viscous losses and hence may be neglected. For particles which form the surface covalent bonds, the role of the viscous term is even less important, which leads to the estimate of the critical velocity [12]:
| (6) |
The adhesion work has been derived for the JKR interaction law [37] and reads [12],
| (7) |
where is the effective radius, is the elastic constant and is the pure number.
The above expression for , has been obtained with the JKR theory, based on the continuous macroscopic description of particles. It uses the bulk material constants, and and the adhesion coefficient . Moreover JKR is a quasi-static theory. Following Ref. [16], where the JKR theory has been successfully applied for colliding NPs, we assume that Eqs. (6) and (7) remain valid for our system. Indeed, for the impact velocities equal to the particles do not separate, Fig.5a, so that the carbyne chains, Fig. 2g-j, that make the difference with the common adsorption, are not formed. We also consider the impact velocities considerably smaller than the speed of sound in the material, which allows to exploit for the collisions the quasi-static approximation [32].
Still, the main difference between Eq. (6) and the conventional theory for [12] is the stress dependence of the adhesion coefficient , which implies its dependence on the impact velocity. In other words, the larger the impact velocity, the larger the compression of particles at a collision and hence, the larger the contact stress, implying larger and . As the result, , and (6) is not anymore an explicit expression for , but the equation for this quantity which is to be solved.
Since we know the dependence of on the maximal contact stress , Eq. (4), we need to find the dependence of on the impact velocity. Let be the maximal force at a collision of two particles, corresponding to the maximal contact radius , then
| (8) |
To estimate the above quantities we ignore the adhesion and dissipation and apply the Hertz contact theory, see e.g. [30], which expresses the force and the contact radius as the function of the particles compression, , where is the inter-center vector:
| (9) |
Application of Eq. (9) to the maximal compression, , yields,
| (10) |
where we use . To estimate we again apply the Hertz theory, which expresses the elastic energy of compression at a collision as . Neglecting again the viscous losses and the work of adhesion, we obtain:
| (11) |
Combining Eqs. (10) and (11), and using we find,
| (12) |
Substituting given by Eq. (4) into Eq. (7), with from Eq. (12) we obtain as the function of . Substituting then the obtained expression with into Eq. (6) we arrive at,
| (13) |
where
| (14) | |||||
| (15) |
Zero-order approximation (stress-independent ) may be substituted into Eq. (13), yielding the first-order approximation:
| (16) |
with from Eq. (14). Generally, the solution of the transcendental equation (13) may be found numerically. The theoretical results for are compared in Fig. 6b with the results of MD simulations. As it can be seen from the figure the theoretical predictions for the critical sticking velocity agree very well with the MD results. The results for the smallest nanoparticles of radii are not shown in Fig. 6b, as we did not detect bouncing collisions for such particles.
V Conclusions
We explore numerically and theoretically the collision of nanoparticles (NPs) comprised of atoms with covalent bonds. We use the AIREBO-M potential that describes covalent interaction of carbon atoms and analyse the models of amorphous carbon (a-C). The a-C nanoparticles may serve as a realistic model of soot particles. Therefore the knowledge of the collision dynamics of such particles is important for many practical applications. Using MD simulations we investigate the bulk properties of a-C material and compute its elastic coefficients – Young modulus and Poisson ratio. Next, we analyse the surface contact properties and reveal a novel phenomenon – the stress dependent adsorption. It is related to the stress-enhanced formation of covalent bonds between the contacting surfaces: The larger the stress, pressing the surfaces together, the larger the number of newly formed covalent bonds. Hence the larger work is needed to separate the surfaces. This results in the adhesion coefficient (the work against the adhesion per unit surface) that depends on the maximal normal stress between two surfaces . We observe that may be approximated by a linear dependence almost in all studied range of .
We analyse the dependence of the restitution coefficient of colliding particles on the particles size and impact velocity. Also we explore the dependence of the critical velocity (the velocity demarcating bouncing and sticking collisions) on the particle radius. We develop a theory of collision dynamics of adhesive particles, with stress-dependent adhesion, and find the dependence of on the particle radius. Our theoretical predictions for the critical velocity are in a very good agreement with the molecular dynamic results. We believe that the proposed approach, tested for nano-particles, will allow to model the collision dynamics of particles comprised of atoms with covalent bonds (including soot particles), in their all size range.
Acknowledgements.
The study was supported by a grant from the Russian Science Foundation No. 21-11-00363, https://rscf.ru/project/21-11-00363/. The research is carried out using the resources of “Zhores” supercomputer of Center for Computational and Data-Intensive Science and Engineering (CDISE), Skolkovo Institute of Science and Technology (Skoltech) [38] and the equipment of the shared research facilities of HPC computing resources of Lomonosov Moscow State University [39, 40].Appendix A Structural and elastic properties of a-C
The radial distribution function (RDF) for C-C pairs in a-C nanoparticles is shown in Fig. 7. The was obtained for NPs of the radius at temperature K before collision. The RDF was then used to compute the distribution of the number of covalent bonds between the atoms (see the main text).
To estimate Young’s and the bulk moduli of amorphous carbon we performed a series of three NEMD simulation of uniaxial loading of a periodic a-C fragment and two simulation of all-round compression and expansion. The initial dimensions of a-C block were . The number of atoms was . In the first series, the system underwent uniaxial extension separately along each of the three axis. The maximal relative deformation used for the estimation of was , while for – up to . In both series the deformation rate was rather small, ; the isothermal condition with K was applied. The obtained stress-strain curves are presented in Figs. 8 and 9. To find the moduli and only linear part of the curves was used. The Young modulus was estimated as the average of three values of obtained for separate uniaxial deformations along each of the axis. These values were also used to estimate the standard deviation of . Similarly, the bulk modulus and its error were estimated from the values of obtained for the compression and expansion.
As an additional check of the accuracy of our approach we used the experiment-based empirical relation between Young’s modulus and the density of amorphous carbon films [41, 42], which reads,
For the value of GPa, obtained in the present study, this relation gives . It is rather close to the density of used in our model.
Appendix B Number of contact atoms and estimate of the bond strength
To find the number of contacts of carbon atoms between two surfaces we compute the number of pairs ( is the carbon atom belonging to the first/second surface) with the inter-atomic distance , which corresponds to the first peak of the RDF, see Fig. 7. In Fig. 10a we compare the dependence of the adhesion coefficient and the number of contacts per unit area on the maximal stress . Apart from two initial points corresponding to the relatively small stress, differs from by a constant factor, corresponding to the average energy of the formed bond . The number of contact linearly depends on the maximal stress which refers to the linear compression regime of the two surfaces. The smaller value of for low corresponds to the beginning of the contact, when only part of the surfaces are brought into the contact through the protrudent surface asperities. Fig. 10b also indicates that for small the relative number of different bonds, , , and rapidly varies with the growing stress, and then remains practically constant. This results in a rapid initial decay of the average bond energy for low . The combination of these two factors (rapid increase of and decrease of ) for the small values of the maximal stress yields almost linear dependence, Eq. (4), for for the whole range of the studied stress.
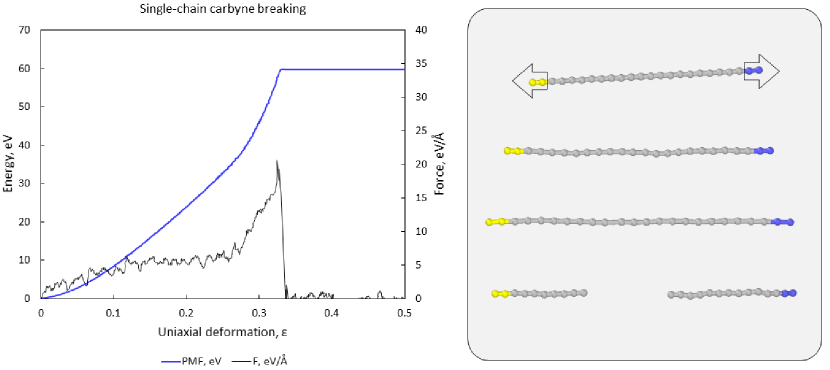
We also estimated the work required to break one covalent bond in a single carbyne chain. We performed cv-SMD simulation of extension/breaking of the chain (see Fig. 11). We found that the maximal force before the -bond between the carbon atom breaks was , (Fig. 11 the grey line on the left panel). The potential of mean force gives the estimate for the work to break the bond eV or J. Note that the above values characterise the model based on the REBO2 force field; these quantities are needed for the better understanding of background physics. To obtain accurate estimates for such characteristics of a real carbyne chain a more complicated model should be used; this is beyond the scope of the current study.
References
- Drake [1972] R. L. Drake, In: G. M. Hidy, and J. R. Brock (Eds.), Topics in Current Aerosol Research, Vol. 3, part 2 (Pergamon Press, New York, 1972).
- Hidy and Brock [1970] G. R. Hidy and J. R. Brock, The Dynamics of Aerocolloidal Systems, International Reviews in Aerosol Physics and Chemistry (Pergamon Press, Oxford, 1970).
- Friedlander [2000] S. K. Friedlander, Smoke, Dust and Haze, 2nd Edition (Oxford University Press, Oxford, 2000).
- Field and Saslaw [1965] G. B. Field and W. C. Saslaw, Astrophys. J 142, 568 (1965).
- Lissauer [1993] J. J. Lissauer, Planet formation, Ann. Rev. Astron. Astrophys. 31, 129 (1993).
- Chokshi et al. [1993] A. Chokshi, A. G. G. Tielens, and D. Hollenbach, Dust coagulation, Astrophys. J. 407, 806 (1993).
- Dominik and Tielens [1997] C. Dominik and A. G. G. Tielens, The physics of dust coagulation and the structure of dust aggregates in space, Astrophys. J. 480, 647 (1997).
- Ossenkopf [1993] V. Ossenkopf, Dust coagulation in dense molecular clouds: the formation of fluffy aggregates, Astron. Astrophys. 280 (1993).
- Spahn et al. [2004] F. Spahn, N. Albers, M. Sremcevic, and C. Thornton, Kinetic description of coagulation and fragmentation in dilute granular particle ensembles, Europhys. Lett. 67, 545 (2004).
- Esposito [2006] L. Esposito, Planetary Rings (Cambridge University Press, Cambridge, UK, 2006).
- Brilliantov et al. [2015] N. V. Brilliantov, P. L. Krapivsky, A. Bodrova, F. Spahn, H. Hayakawa, V. Stadnichuk, and J. Schmidt, Size distribution of particles in saturn’s rings from aggregation and fragmentation, Proc. Natl. Acad. Sci. USA 112, 9536 (2015).
- Brilliantov et al. [2007] N. V. Brilliantov, N. Albers, F. Spahn, and T. Pöschel, Collision dynamics of granular particles with adhesion, Phys. Rev. E 76, 051302 (2007).
- Arakawa and Krijt [2021] S. Arakawa and S. Krijt, On the stickiness of co2 and h2o ice particles, The Astrophysical Journal 910, 130 (2021).
- Brilliantov et al. [2018] N. Brilliantov, A. Formella, and T. Poeschel, Increasing temperature of cooling granular gases, Nature Commun. 9, 797 (2018).
- Midya and Das [2017] J. Midya and S. K. Das, Kinetics of vapor-solid phase transitions: Structure, growth and mechanism, Phys. Rev. Lett. 118, 165701 (2017).
- Saitoh et al. [2010] K. Saitoh, A. Bodrova, H. Hayakawa, and N. Brilliantov, Negative normal restitution coefficient found in simulation of nanocluster, Phys. Rev. Lett. 105, 238001 (2010).
- Guimaraes et al. [2012] A. H. F. Guimaraes, N. Albers, F. Spahn, M. Seiss, E. Vieira-Neto, and N. V. Brilliantov, Aggregates in the strength and gravity regime: Particles sizes in saturns rings, Icarus 220, 660 (2012).
- Muller et al. [2012] P. Muller, D. Krengel, and T. Poschel, Negative coefficient of normal restitution, Phys. Rev. E 85, 041306 (2012).
- Shahad [1989] H. Shahad, An experimental investigation of soot particle size inside the combustion chamber of a diesel engine, Energy Conversion and Management 29, 141 (1989).
- Plimpton [1995] S. Plimpton, Fast parallel algorithms for short-range molecular dynamics, Journal of computational physics 117, 1 (1995).
- Orekhov et al. [2020] N. Orekhov, G. Ostroumova, and V. Stegailov, High temperature pure carbon nanoparticle formation: Validation of airebo and reaxff reactive molecular dynamics, Carbon 170, 606 (2020).
- Jana et al. [2019] R. Jana, D. Savio, V. L. Deringer, and L. Pastewka, Structural and elastic properties of amorphous carbon from simulated quenching at low rates, Modelling and Simulation in Materials Science and Engineering 27, 085009 (2019).
- Stuart et al. [2000] S. J. Stuart, A. B. Tutein, and J. A. Harrison, A reactive potential for hydrocarbons with intermolecular interactions, The Journal of chemical physics 112, 6472 (2000).
- O’Connor et al. [2015] T. C. O’Connor, J. Andzelm, and M. O. Robbins, Airebo-m: A reactive model for hydrocarbons at extreme pressures, The Journal of chemical physics 142, 024903 (2015).
- Brenner et al. [2002] D. W. Brenner, O. A. Shenderova, J. A. Harrison, S. J. Stuart, B. Ni, and S. B. Sinnott, A second-generation reactive empirical bond order (rebo) potential energy expression for hydrocarbons, Journal of Physics: Condensed Matter 14, 783 (2002).
- Li et al. [2013] L. Li, M. Xu, W. Song, A. Ovcharenko, G. Zhang, and D. Jia, The effect of empirical potential functions on modeling of amorphous carbon using molecular dynamics method, Applied surface science 286, 287 (2013).
- Stukowski [2009] A. Stukowski, Visualization and analysis of atomistic simulation data with ovito–the open visualization tool, Modelling and Simulation in Materials Science and Engineering 18, 015012 (2009).
- Stukowski et al. [2012] A. Stukowski, V. V. Bulatov, and A. Arsenlis, Automated identification and indexing of dislocations in crystal interfaces, Modelling and Simulation in Materials Science and Engineering 20, 085007 (2012).
- Brilliantov and Spahn [2006] N. V. Brilliantov and F. Spahn, Dust coagulation in equilibrium molecular gas, Math. Comput. Simulation 72, 93 (2006).
- Landau and Lifshitz [1965] L. D. Landau and E. M. Lifshitz, Theory of Elasticity (Oxford University Press, Oxford, 1965).
- Hossain et al. [2010] D. Hossain, M. A. Tschopp, D. Ward, J.-L. Bouvard, P. Wang, and M. F. Horstemeyer, Molecular dynamics simulations of deformation mechanisms of amorphous polyethylene, Polymer 51, 6071 (2010).
- Brilliantov et al. [1996] N. V. Brilliantov, F. Spahn, J.-M. Hertzsch, and T. Pöschel, Model for collisions in granular gases, Phys. Rev. E 53, 5382 (1996).
- Israelachvili [2015] J. N. Israelachvili, Intermolecular and surface forces (Academic press, 2015).
- Izrailev et al. [1999] S. Izrailev, S. Stepaniants, B. Isralewitz, D. Kosztin, H. Lu, F. Molnar, W. Wriggers, and K. Schulten, Steered molecular dynamics, in Computational molecular dynamics: challenges, methods, ideas (Springer, 1999) pp. 39–65.
- Kudryavtsev et al. [1993] Y. P. Kudryavtsev, S. Evsyukov, M. Guseva, V. Babaev, and V. Khvostov, Carbyne—the third allotropic form of carbon, Russian chemical bulletin 42, 399 (1993).
- Brilliantov and Pöschel [2004] N. V. Brilliantov and T. Pöschel, Kinetic Theory of Granular Gases (Oxford University Press, Oxford, 2004).
- Johnson et al. [1971] K. L. Johnson, K. Kendall, and A. D. Roberts, Surface energy and contact of elastic solids, Proc. R. Soc. London Ser. A 324, 301 (1971).
- Zacharov et al. [2019] I. Zacharov, R. Arslanov, M. Gunin, D. Stefonishin, A. Bykov, S. Pavlov, O. Panarin, A. Maliutin, S. Rykovanov, and M. Fedorov, “zhores” – petaflops supercomputer for data-driven modeling, machine learning and artificial intelligence installed in skolkovo institute of science and technology, Open Engineering 9, 512 (2019).
- Voevodin et al. [2019] V. V. Voevodin, A. S. Antonov, D. A. Nikitenko, P. A. Shvets, S. I. Sobolev, I. Y. Sidorov, K. S. Stefanov, V. V. Voevodin, and S. A. Zhumatiy, Supercomputer lomonosov-2: Large scale, deep monitoring and fine analytics for the user community, Supercomputing Frontiers and Innovations 6, 4 (2019).
- Adinets et al. [2012] A. Adinets, P. A. Bryzgalov, V. V. Voevodin, S. A. Zhumatii, D. A. Nikitenko, and K. S. Stefanov, Job digest: An approach to dynamic analysis of job characteristics on supercomputers, Numerical methods and programming 13, 160 (2012).
- Schneider et al. [1997] D. Schneider, T. Schwarz, H.-J. Scheibe, and M. Panzner, Non-destructive evaluation of diamond and diamond-like carbon films by laser induced surface acoustic waves, Thin Solid Films 295, 107 (1997).
- Schneider and Schultrich [1998] D. Schneider and B. Schultrich, Elastic modulus: a suitable quantity for characterization of thin films, Surface and coatings technology 98, 962 (1998).