SCExAO/CHARIS Direct Imaging of A Low-Mass Companion At A Saturn-Like Separation from an Accelerating Young A7 Star
Abstract
We present the SCExAO direct imaging discovery and characterization of a low-mass companion to the nearby young A7IV star, HD 91312. SCExAO/CHARIS (1.1–2.4 ) spectra and SCExAO/HiCIAO band imaging identify the companion over a two year baseline in a highly inclined orbit with a maximum projected separation of 8 au. The companion, HD 91312 B, induces an 8.8- astrometric acceleration on the star as seen with the Gaia & Hipparcos satellites and a long-term radial velocity trend as previously identified by Borgniet et al. (2019). HD 91312 B’s spectrum is consistent with that of an early-to-mid M dwarf. Hipparcos and Gaia absolute astrometry, radial-velocity data, and SCExAO/CHARIS astrometry constrain its dynamical mass to be M, consistent with - but far more precise than - masses derived from spectroscopy, and favors a nearly edge-on orbit with a semi-major axis of 9.7 au. This work is an example of precisely characterizing properties of low-mass companions at solar system-like scales from a combination of direct imaging, astrometry, and radial-velocity methods.
1 Introduction
Direct imaging and two indirect methods – radial-velocity (RV) and astrometry – provide ways to detect and characterize young exoplanets, brown dwarfs, and low-mass stellar companions at Jupiter or greater separations around nearby stars (Marois et al., 2008; Nakajima et al., 1995; Zimmerman et al., 2010; Borgniet et al., 2019; Lagrange et al., 2020; Currie et al., 2020; Brandt, 2018; Brandt et al., 2019). Each method in isolation has its strengths and weaknesses. While direct imaging can probe key atmospheric properties – e.g. temperature, clouds, chemistry, and gravity – and provide some constraints on orbits, the masses this method derives are inferred from luminosity evolution models which themselves are uncertain. Furthermore, astrometric coverage from high-contrast direct imaging is usually small compared to the companion’s likely orbital period (Barman et al., 2015; Currie et al., 2011; Spiegel & Burrows, 2012; Berardo et al., 2017; Lagrange et al., 2019; Blunt et al., 2017; Kuzuhara et al., 2013; Carson et al., 2013). On the other hand, astrometry and RV by themselves provide constraints on orbital properties and lower limits on masses, but do not provide the same insight into atmospheric properties.
Combining direct imaging with astrometry and/or RV substantially improves our ability to characterize low-mass companions (Brandt et al., 2019). Relative astrometry of companions from imaging and absolute astrometry and/or Doppler light curves of the star can directly constrain companion masses and orbital properties. Atmospheric properties derived from imaging can be tied to the object’s mass. The Hipparcos-Gaia Catalog of Accelerations (HGCA) – a combination of the exquisite astrometry from the Gaia mission and those from Hipparcos – provides a list of nearby stars whose proper motion accelerations hint at the presence of massive, imageable companions on solar system scales (Gaia Collaboration et al., 2018; Brandt, 2018). Direct imaging surveys targeting these accelerating stars may have significantly higher yields than blind surveys and allow substantially improved characterization capabilities (e.g. Calissendorff & Janson, 2018; Fontanive et al., 2019; Currie et al., 2020; Bowler et al., 2021; Steiger et al., 2021).
In this paper, we report the direct imaging detection of a low-mass companion at a projected separation of 8 au from the nearby A7IV star, HD 91312 A, using both the Coronagraphic High Angular Resolution Imaging Spectrograph (CHARIS, Groff et al., 2016) behind the Subaru Coronagraphic Extreme Adaptive Optics Project (SCExAO, Jovanovic et al., 2015b) and the NIRC2 camera on Keck. CHARIS spectra and NIRC2 photometry reveal HD 91312 B to be an early-to-mid M dwarf. The HGCA identifies an astrometric acceleration for the primary induced by HD 91312 B; the companion also is responsible for a long-term RV drift identified by Borgniet et al. (2019).
| UT Date | Instrument | coronagraph | Seeing (″) | Passbanda | ()a | (s) | PA (o) | PSF Subtraction | |
|---|---|---|---|---|---|---|---|---|---|
| Strategy | |||||||||
| 20161215 | SCExAO/HiCIAO | vortex | 0.6 | 1.65 | 30 | 79 | 44.4 | ADI | |
| 20170312 | SCExAO/CHARIS | Lyot | 0.5 | 1.16–2.37 | 10.32 | 117 | 18.5 | ADI | |
| 20170313 | SCExAO/CHARIS | Lyot | 0.6 | 1.16–2.37 | 14.75 | 61 | 25.5 | ADI | |
| 20180208 | SCExAO/CHARIS | Lyot | 1.4 | 1.16–2.37 | 16.23 | 12 | 1.9 | SDI | |
| 20181128 | Keck/NIRC2 | Lyot | 1.0 | 3.78 | 30 | 54 | 46.3 | ADI | |
| 20181215 | SCExAO/CHARIS | none | – | 1.16–2.37 | 20.65 | 35 | 34.4 | ADI |
Note. — a) For CHARIS data, this column refers to the wavelength range. For HiCIAO broadband imaging data, it refers to the central wavelength.
In section 2, we describe the observations, data reduction, and spectral extraction obtained with SCExAO/HiCIAO, SCExAO/CHARIS, and Keck/NIRC2. In section 3, we discuss the analysis HD 91312 B. We find that both an empirical spectral comparison and a comparison to atmospheric models find a best match to an early-to-mid M dwarf. An analysis of the Gaia astrometry, orbital motion, and radial velocity trend provides a strong constraint on the mass. Finally, in section 4, we compare the system to evolutionary models, providing a prediction of the age of the HD 91312 system.
2 Target Properties, Observations, and Data
HD 91312 A is a bright (=4.7) A7IV star located at a distance of pc (Gaia Collaboration et al., 2018). Rhee et al. (2007) identify the star as an IRAS-excess source ( 10-4) consistent with circumstellar dust, although later work has suggested this excess emission results from contamination by an unrelated background object (Bulger et al., 2013). Age estimates for the system vary, from 200 in Rhee et al. 2007 to 700-900 or 19 in David & Hillenbrand (2015) using Bayesian inference and isochrone fitting, respectively.
Previous direct imaging searches failed to identify companions at separations of 1″ or greater (e.g. Janson et al., 2013; De Rosa et al., 2014). However, precision radial-velocity (RV) data identify a long-term trend consistent with an unseen stellar to substellar companion orbiting beyond 5 au from the star (Borgniet et al., 2019). Using the Hipparcos-Gaia Catalogue of Accelerations from Brandt (2018) considering Hipparcos and Gaia-DR2 measurements, we identified a 2.4- significant astrometric acceleration also consistent with an unseen (sub-)stellar companion. Using updated Gaia-eDR3 astrometry, the significance increases to 8.8 (Brandt et al. 2021, submitted).
High-contrast imaging data for HD 91312 were obtained from SCExAO/CHARIS, Keck/NIRC2, SCExAO/HiCIAO between Dec 2016 and Dec 2018 (Table 1). Our Subaru Telescope observations used the HiCIAO infrared camera (Hodapp et al., 2008) in band ( = 1.65 ) or the CHARIS integral field spectrograph (Groff et al., 2016) in broadband mode covering passbands simultaneously (1.16-2.37 m, 18) with SCExAO providing an extreme AO correction. For followup observations, we acquired Keck II observations with the NIRC2 camera in the broadband filter ( = 3.78 ) using Keck’s facility AO system.
While conditions were photometric each night, the seeing varied substantially, ranging from = 05–06 for the March 2017 SCExAO/CHARIS data to 1–1.4″ for the February and November 2018 SCExAO/CHARIS and Keck/NIRC2 data. Consequentially, the AO performance also varied. Precipitable water vapor levels and the strength of telluric features prominent in channels bracketing the passbands for CHARIS also varied.
All CHARIS data utilized satellite spots for precise astrometric and spectrophotometric calibration (e.g. Jovanovic et al., 2015a; Currie et al., 2018), either during (2018 data) or preceding (March 2017) our main sequence of science exposures. Except for the December 2018 epoch, we used a Lyot cornograph with a 023 diameter occulting spot for all CHARIS observations. The NIRC2 data were taken without a coronagraph. All observations were conducted in “vertical angle”/pupil tracking mode enabling angular differential imaging (ADI; Marois et al., 2006). The CHARIS data also enable spectral differential imaging (SDI; Marois et al., 2000).
The standard CHARIS pipeline (Brandt et al., 2017) extracted data cubes from raw data; the CHARIS post-processing pipeline developed in Currie et al. (2018) provided basic reduction steps including
sky subtraction, image registration, and spectrophotometric calibration. For spectrophotometric calibration, we adopted a Kurucz stellar atmosphere model appropriate for an A7 star. For both the HiCIAO and NIRC2 data, we used a well-tested general purpose high-contrast ADI broadband imaging pipeline (Currie et al., 2010, 2011).
To suppress the stellar halo, we use the least-squares based algorithms – Adaptive Locally Optimized Combination of Images (A-LOCI Currie et al., 2012, 2015) and the Karhunen-Loève Image Projection (KLIP; Soummer et al., 2012) approaches – in combination with ADI or SDI. We employed more conservative algorithm settings for the highest-quality data sets which also coincide with HD 91312 B’s widest angular separation, adopting a high singular value decomposition (SVD) cutoff for A-LOCI or truncating the basis set for KLIP at a small number of modes. Due to the poorer seeing, the 2018 epoch data sets suffered from poorer AO performance and HD 91312 B at a smaller angular separation. For these data, only aggressive approaches – e.g. using A-LOCI in SDI mode or with a small optimization area used to construct a weighted PSF (see Lafrenière et al., 2007) – yielded a statistically significant detection. For all the reductions we used an overlap of 0.7 FWHM’s. For the March 12 KLIP reduction a KL=1 was used and for the ALOCI results, we used a SVD limit of was used. The March 13 ALOCI results used a SVD limit of .
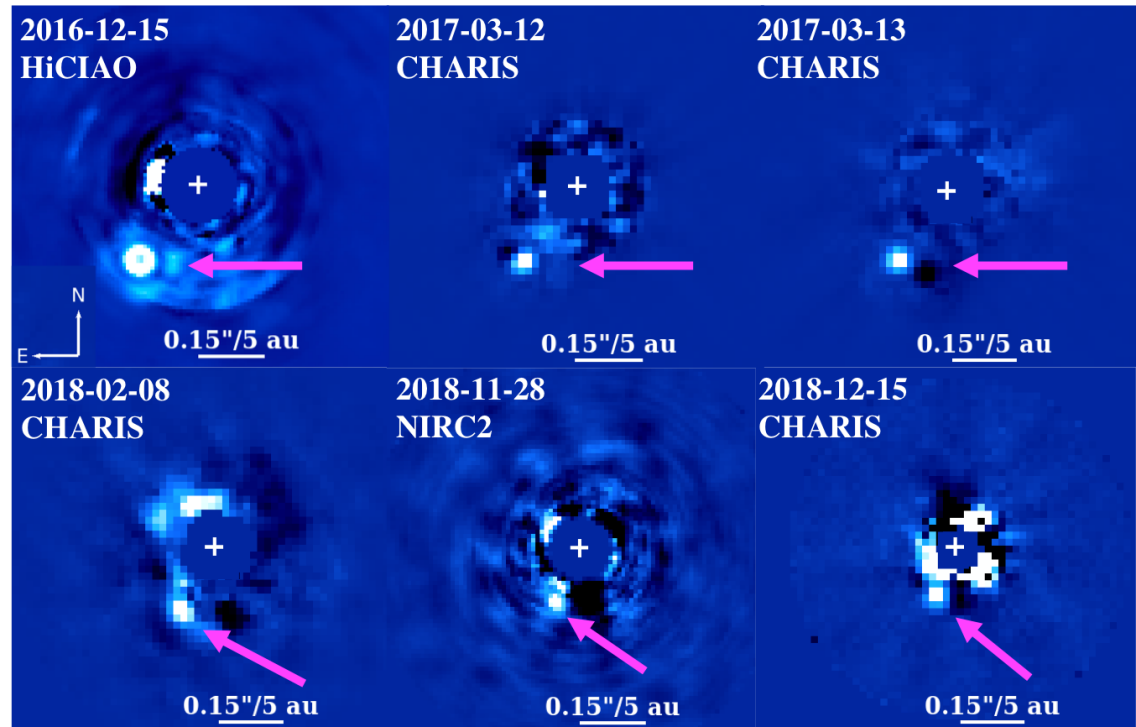
Figure 1 shows the detection of a faint point source companion, HD 91312 B, within 02 of the primary. Even with conservative algorithm settings, the signal-to-noise (SNR) for HD 91312 B’s detection obtained with A-LOCI (KLIP) exceeds 68 (37) in the 2017 March 12 data. HD 91312 B’s detection significance in the 2017 March 13 data set (37) is a lower limit since a prominent negative self-subtraction footprint counterclockwise from the companion biases the true speckle noise estimate. In the HiCIAO data, HD 91312 B slightly saturates. No data set identifies any additional companion. HD 91312 B appears at smaller angular separations in the 2018 data than in 2016-2017.
3 Analysis
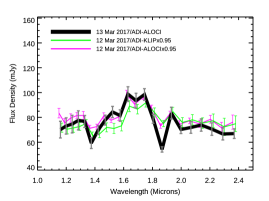
Prior to extracting a spectrum for HD 91312 B and determining the companion’s astrometry, we corrected for signal losses due to processing by forward-modeled point sources at HD 91312 B’s location using stored coefficients (for A-LOCI) or eigenvectors/eigenvalues (for KLIP) in Currie et al. (2018, 2020) and Pueyo (2016). For CHARIS spectra, we focus on the 13 March 2017 data, as these have a higher throughput and weaker off-diagonal terms in their spectral covariance than the 12 March 2017 data, indicating less spatially/spectrally correlated noise (Greco & Brandt, 2016). The 2018 CHARIS epochs have less statistically significant detections, have likewise stronger off-diagonal terms in their spectral covariance, and/or utilized SDI-only for PSF subtraction, which complicates forward-modeling (Pueyo, 2016).
Our implementation of A-LOCI and KLIP only mildly attenuates HD 91312 B in the 13 March 2017 CHARIS data, as the forward-modeled companion PSF had 85-95% throughput per channel. In the Keck/NIRC2 data, the aggressive processing needed to achieve a detection yielded far greater signal loss (23% throughput). Except for the Keck/NIRC2 data, we found astrometric biasing to be negligible.
3.1 Common Proper Motion, Orbit, and Dynamical Mass
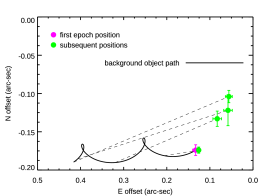
Table 2 lists HD 91312 B’s relative astrometry for each epoch and Figure 2 compares the companion’s positions to those expected for a background star. Gaia & hiparcus provide absolute astrometry of the system, while the direct imaging measurements made with CHARIS, HiCIAO, and NIRC2 provide relative astrometry of the system. The primary exhibits a significant proper motion of , -138.1, -3.2 mas yr-1 (Gaia Collaboration et al., 2018). HD 91312 B’s astrometry over two years is therefore easily distinguishable from the path of a background star with the primary uncertainty being related to the companion SNR.
Between December 2016 and March 2017, HD 91312 B’s position changes little but its angular separation is substantially smaller in subsequent epochs. This suggests that our earliest epoch detections likely imaged the companion near its maximum projected separation. Visual inspection of Figure 2 shows HD 91312 B at a roughly constant position angle but varying angular separations, suggesting that its orbit is highly inclined along our line-of-sight.
| UT Date | Instrument | SNRa | [E,N](″) |
|---|---|---|---|
| 20161215 | SCExAO/HiCIAO | 12b | [0.133, -0.174] [0.007, 0.007] |
| 20170312 | SCExAO/CHARIS | 68 | [0.126, -0.176] [0.004, 0.004] |
| 20170313 | SCExAO/CHARIS | 37c | [0.127, -0.172] [0.004, 0.004] |
| 20180208 | SCExAO/CHARIS | 6.3 | [0.083, -0.133] [0.010, 0.010] |
| 20181128 | Keck/NIRC2 | 3.1 | [0.058, -0.122] [0.010, 0.020] |
| 20181215 | SCExAO/CHARIS | 5.3 | [0.056, -0.104] [0.008, 0.008] |
Note. — a) All HD 91312 B SNR estimates draw from reductions used to calculate astrometry. b) This is a lower limit since HD 91312 B is saturated in HiCIAO images. c) The SNR is likely underestimated, as negative self-subtraction footprints bias the true speckle noise estimate.
3.2 The Atmosphere of HD 91312 B
The HD 91312 B spectrum shows peaks at and especially band characteristic of M and L-type companions (e.g. Gagné et al., 2015) (Figure 3). The 13 March 2017 data show slightly discrepant measurements at 1.85 , likely due to that night’s stronger telluric emission between J,H,K bands. HD 91312 B’s broadband photometry in standard Maunakea Observatory filters derived from the 13 March 2017 CHARIS and 28 November 2018 NIRC2 data is , , , and .
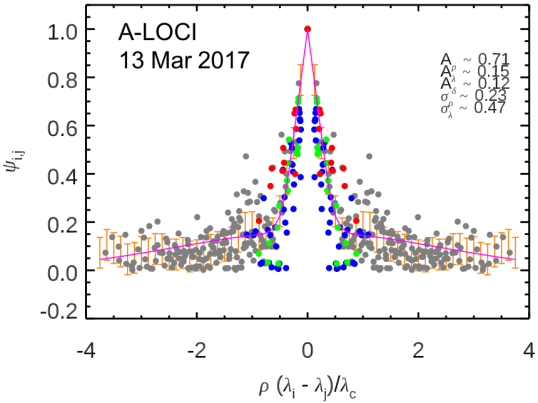
In contrast to results for wider-separation companions like HD 33632 Ab (Currie et al., 2020), the spectral covariance at HD 91312 B’s location includes substantial off-diagonal terms (Figure 4), especially for spatially-correlated noise (Aρ 0.71). More aggressive ADI processing or employing SDI would reduce the spatially/spectrally correlated noise but would complicate forward-modeling and thus impact the fidelity of our extracted spectrum.
| Wavelength (m) | (mJy) | (mJy) | SNR |
|---|---|---|---|
| 1.1596 | 70.1401 | 6.7327 | 10.4178 |
| 1.1997 | 73.0861 | 6.5475 | 11.1625 |
| 1.2412 | 74.5914 | 7.1210 | 10.4748 |
| 1.2842 | 77.5707 | 7.6822 | 10.0975 |
| 1.3286 | 76.7243 | 4.7999 | 15.9847 |
| 1.3746a | 59.2881 | 4.3527 | 13.6211 |
| 1.4222a | 69.7233 | 3.6030 | 19.3515 |
| 1.4714 | 77.8220 | 3.9974 | 19.4682 |
| 1.5224 | 84.3496 | 4.4957 | 18.7621 |
| 1.5750 | 81.4769 | 4.6191 | 17.6391 |
| 1.6296 | 98.7482 | 5.9409 | 16.6217 |
| 1.6860 | 93.4650 | 5.9960 | 15.5878 |
| 1.7443 | 98.4082 | 4.6971 | 20.9508 |
| 1.8047 | 78.9408 | 3.7200 | 21.2204 |
| 1.8672a | 54.1538 | 2.1265 | 25.4661 |
| 1.9318a | 83.4531 | 4.7505 | 17.5671 |
| 1.9987 | 70.2701 | 3.3121 | 21.2159 |
| 2.0678 | 71.8675 | 4.6904 | 15.3223 |
| 2.1394 | 73.8355 | 4.9648 | 14.8718 |
| 2.2135 | 70.5583 | 5.0372 | 14.0076 |
| 2.2901 | 66.6173 | 4.8304 | 13.7912 |
| 2.3693 | 66.9209 | 3.8831 | 17.2340 |
Note. — Throughput-corrected HD 91312 B spectrum extracted from 13 March 2017 data. (a) These spectral channels are likely to be telluric-dominated.
3.3 Empirical Comparisons to HD 91312 B’s Infrared Colors and Spectrum
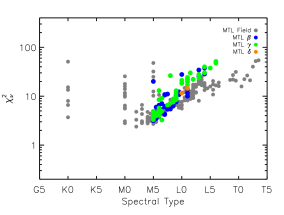
To empirically constrain HD 91312 B’s atmosphere, we first compare its broadband colors to ultra-cool dwarf colors compiled in Pecaut & Mamajek (2013); Kenyon & Hartmann (1995) and then its CHARIS spectrum to objects in the Montreal Spectral Library111https://jgagneastro.com/the-montreal-spectral-library/ (e.g. Gagné et al., 2014), considering the impact of spatially and spectrally correlated noise (Greco & Brandt, 2016). HD 91312 B’s and colors converted to the 2MASS photometric system are 0.72 0.12 and 0.89 0.12 (Pecaut & Mamajek, 2013), respectively, which are matched by M5.5–L1 and K7–M7 field objects at the 1- level, respectively (see Pecaut & Mamajek, 2013). Its - color (0.97 0.35) does not well constrain its spectral type (later than K4; Kenyon & Hartmann, 1995), due to the large NIRC2 photometric errors.
As shown in Figure 5, HD 91312 B’s spectrum is best-matched by early-to-mid M dwarfs – M0 to M6 objects – which reproduce the H-band peak but otherwise relatively flat spectral shape at and . Later spectral types tend to have K-band shapes that are too bright and peaked to reproduce HD 91312 B’s spectrum. Effective temperatures for M0–M6 dwarfs span 2850–3870 K (Pecaut & Mamajek, 2013). For M dwarfs, the absolute K-band magnitude and bolometric magnitude correlate well. Adopting the relationship from Casagrande et al. (2008) and assuming a distance of 33.43 , HD 91312 B’s luminosity is .
3.4 Atmospheric Model Spectra and HD 91312 B
For comparison to model stellar spectra, we perform a similar fit of HD 91312 B’s observed spectrum to the solar metallicity BT-Settl-CIFIST models (Baraffe et al., 2015). As with the previous BT-Settl models (Allard et al., 2012a, b), BT-Settl-CIFIST includes self-consistent cloud formation and sedimentation. However, the latter also includes updated solar abundances and a more detailed treatment of convection (Baraffe et al., 2015). Notably, however, this analysis does not include any constraints on metallicity.
We combine our extracted A-LOCI CHARIS spectrum from 13 March 2017 with the photometric point from NIRC2, ignoring spectral channels that are likely to be telluric-dominated (1.375, 1.422, 1.867, and 1.932 m in the CHARIS spectrum). As spectra observed with CHARIS are deconvolved from the Line-Spread Function during extraction (Brandt et al., 2017), the model spectra were convolved with a Gaussian corresponding to the appropriate CHARIS spectral bin width at each wavelength ( converted to spectral bins) and re-binned for comparison with the observed spectra. As the CHARIS spectral resolution is logarithmic in nature, the FWHM of the convolved Gaussian varied as a function of across the wavelength range of the CHARIS Broadband filter. To ensure manageable computational time, the same FWHM was used for every 501 model wavelength bins, corresponding to of the width of the CHARIS Broadband filter. Calculation of the expected model flux in the NIRC2 band used a linear interpolation of NIRC2’s bandpass curve provided by the SVO Filter Profile Service (Rodrigo et al., 2012; Rodrigo & Solano, 2020).
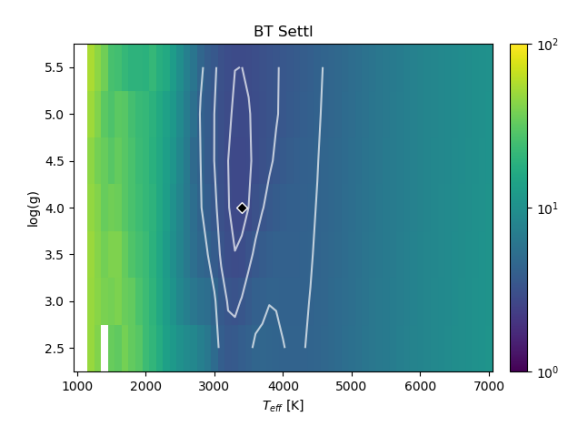
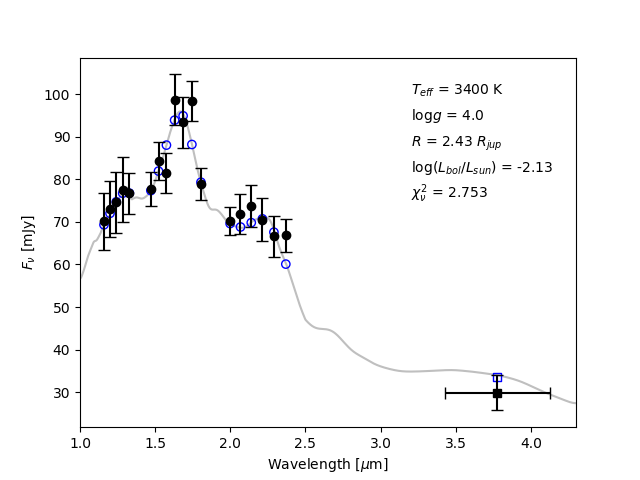
Once the model spectra have been re-binned to match the observed CHARIS Broadband with NIRC2 photometry, the spectral is calculated using the same solution to the correlation model of Greco & Brandt (2016) discussed in Section 3.3. The resulting as a function of model and is shown in Figure 6. Our spectroscopic/photometric measurements are best fit by the BT-Settl-CIFIST model with K and , resulting in . This best fit model spectrum, shown with the observed data in Figure 7, results in a radius of and a . Noteably, the confidence interval on the fit does not provide strong constraints on (see Figure 6), ranging from . However, the effective temperatures that fall within the () confidence interval indicate a spectral type of M2 - 4 (M5.5 - K9), with the best-fit K model corresponding with a spectral type of M3 (Pecaut & Mamajek, 2013).
3.5 Astrometry
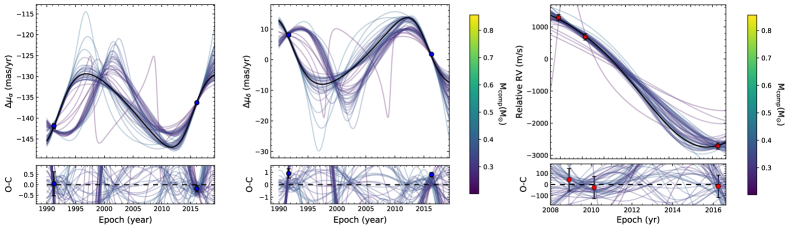
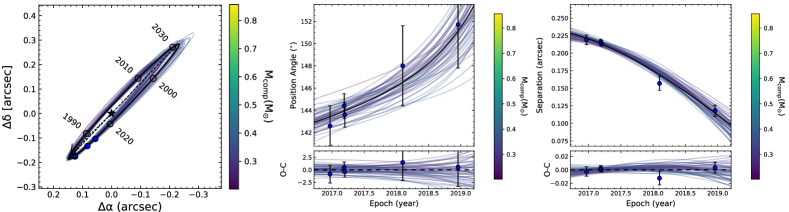
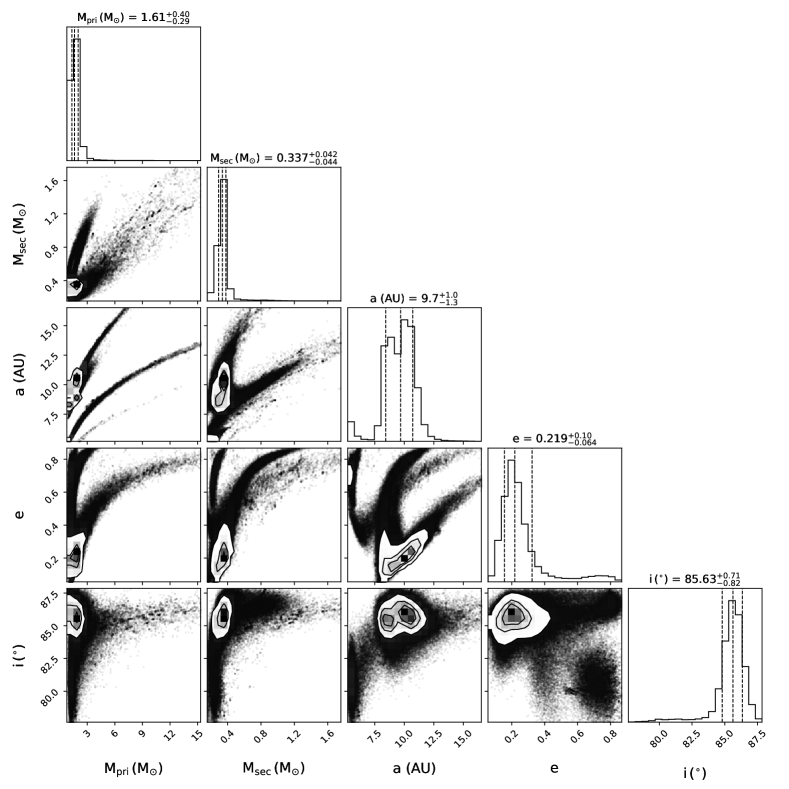
We use the open-source code orvara (Brandt et al., 2021) to fit the low mass companion of HD 91312. The mass and orbit are fit using a combination of the Hipparcos and Gaia Catalogues, radial velocity measurements from (Borgniet et al., 2019), and relative astrometry from SCExAO/HiCIAO, SCExAO/CHARIS and Keck/NIRC2. We fit for the mass of the primary and companion, the semi-major axis, the eccentricity and inclination. We assume that the companion observed is solely responsible for the acceleration observed in between the Hipparcos and Gaia catalogues. For the fit, we assume lognormal priors on mass and semimajor axis, a geometric prior on inclination, a Gaussian prior on parallax using the Gaia EDR3 measurement and its uncertainty, and uniform priors on the remaining parameters. The code analytically marginalizes out parallax, barycenter proper motion, and barycenter radial velocity as nuisance parameters. A full description of orvara and its available parameters can be found it Brandt et al. (2021). Figure 8 shows the predicted vs. measured proper motion acceleration and relative radial velocity for HD 91312 A and Figure 9 shows the predicted vs. measured relative astrometry for HD 91312 B. The companion has a best-fit mass of M with a best-fit semimajor axis of au and an orbital inclination of degrees. Figure 10 shows our posterior distribution of selected orbital parameters.
4 Comparison to Stellar Evolution Models
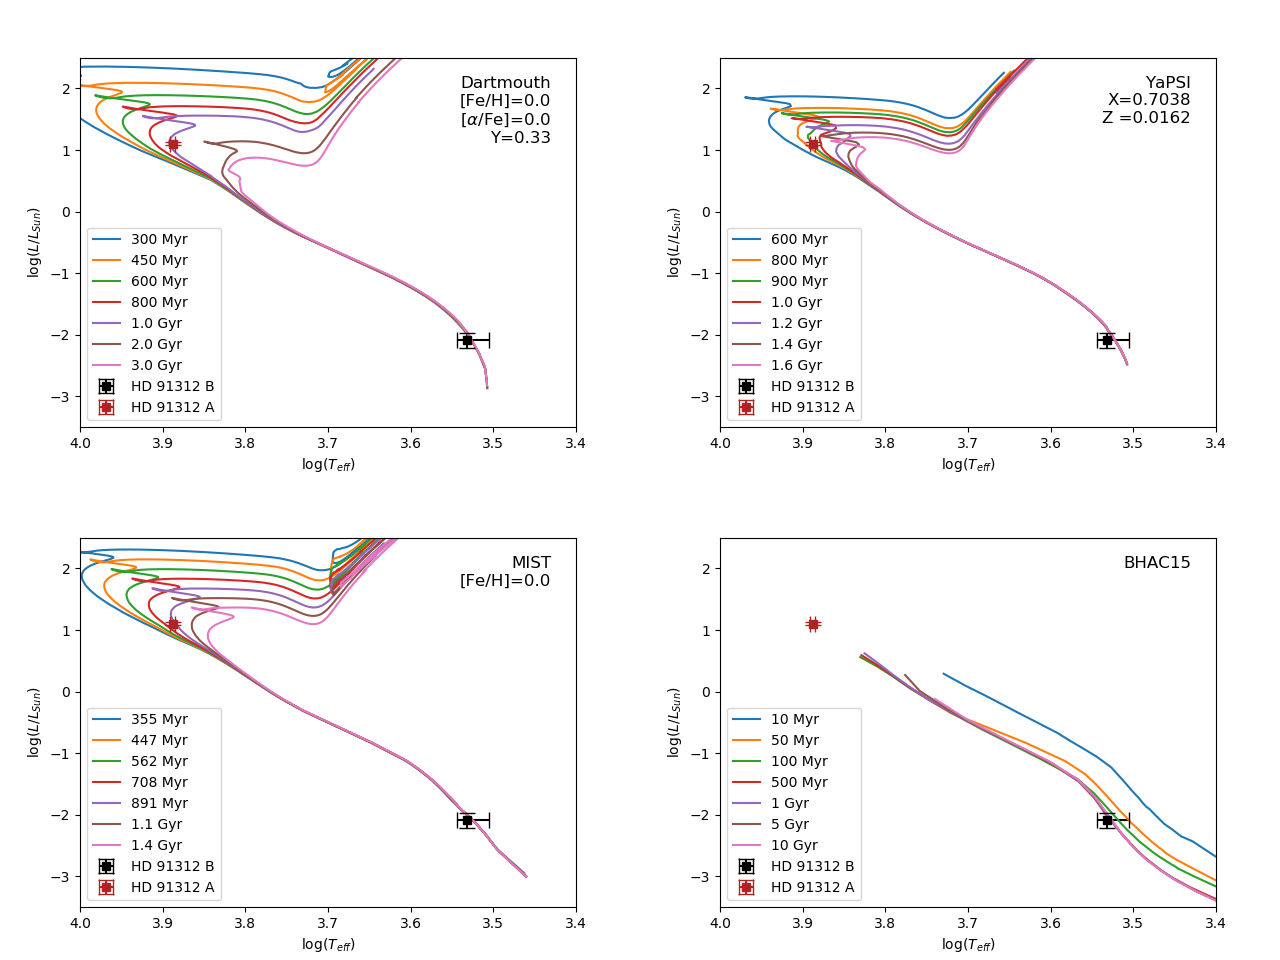
To obtain an age estimate, we compared the derived and luminosity of the HD 91312 AB system to isochrones from several stellar evolution grids. This analysis was performed with the Dartmouth (Dotter et al., 2008; Feiden et al., 2011), Yale-Potsdam Stellar Isochrones (YaPSI; Spada et al. 2017), MESA Isochrones and Stellar Tracks (MIST; Dotter 2016; Choi et al. 2016) utilizing the Modules for Experiments in Stellar Astrophysics (MESA) code (Paxton et al., 2011, 2013, 2015, 2018), and the BHAC15 (Baraffe et al., 2015) evolutionary models.
For the Dartmouth, YaPSI, and MIST models, we consider only isochrones that are simultaneously consistent with the and of HD 91312 A and B within . For HD 91312 B, we use the K from Section 3.4 with the empirical (Section 3.3). While the empirical and modelled bolometric luminosities derived in Sections 3.3 and 3.4 are consistent within their uncertainties, the uncertainties derived from model fitting do not include the uncertainties in the model spectra, themselves. Therefore, we use the empirical bolometric luminosity in this stellar evolution analysis for a more complete representation of the uncertainty. For HD 91312 A, we use and from Zorec & Royer (2012). We perform a similar analysis with the BHAC15 models using only the data for HD 91312 B, as HD 91312 A is beyond the mass limits of their models (0.07 - 1.4 ; Baraffe et al. 2015). Example isochrones from each model at or near stellar metallicity are shown in Figure 11.
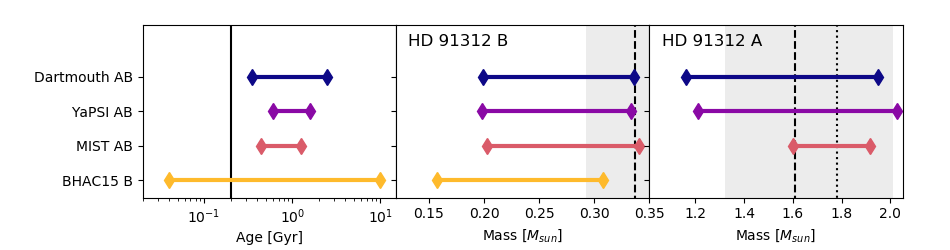
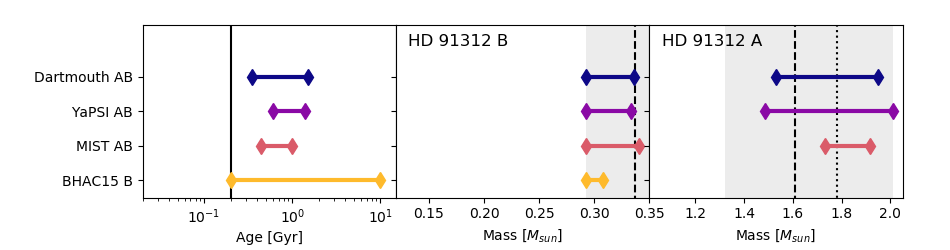
For each isochrone that is simultaneously consistent with HD 91312 A and B (or B alone, in the case of the BHAC15 models), we estimate the range of masses for each source that lie along the isochrone within of the measured and for the source. Figure 12 provides a more detailed view of the allowed mass range for each source as a function of isochrone age and, in the cases of the Dartmouth, YaPSI, and MIST models, metallicity.
When combined with the astrometric mass for HD 91312 B derived in Section 3.5, the system becomes inconsistent with the lowest metallicity Dartmouth ([Fe/H]), YaPSI (Z) models, and MIST ([Fe/H]) models. Figure 13 shows the full range of ages and masses for each source allowed by each of the four stellar evolution grids, both before and after constraining the mass ranges for HD 91312 A and B to be within of the astrometric masses. With no mass constraints, the age ranges given by each model are Gyr (Dartmouth AB), Gyr (YaPSI AB), Gyr (MIST AB), and Gyr (BHAC15 B). Imposing the mass constraints reduces the allowed age ranges to Gyr (Dartmouth AB), Gyr (YaPSI AB), Gyr (MIST AB), and Gyr (BHAC15 B).

5 Conclusions & Discussion
In this work, we directly image and characterize a low-mass stellar companion to the A7 star HD 91312 with SCExAO/CHARIS, SCExAO/HiCIAO, and Keck/NIRC2. The presence of HD 91312 B is consistent with a long-term radial velocity trend seen by ground-based Doppler surveys (Borgniet et al., 2019) and space-based precision astrometry missions (Gaia Collaboration et al., 2018; Brandt, 2018).
HD 91312 B’s spectrum is best matched by early to mid M dwarf spectra. Modeling the SCExAO/CHARIS spectrum and photometry from Keck/NIRC2 using the BT-Settl-CIFIST models yields a best fit to a 3400 K object with a log(g)=4.0, consistent with empirical comparisons. . Combining relative astrometry of HD 91312 B with radial-velocity measurements and absolute astrometry of the star yields a dynamical mass for the companion of M, also consistent with the results from spectral fitting. To obtain an age estimate of the HD 91312 AB system, we derived and luminosity and compared these to isochrones from several stellar evolution grids. While specific constraints vary, the Dartmouth, YaPSI, and MIST models for the 91312 AB system predict an age between Gyr when including astrometric mass, and are, in general inconsistent with the lowest metallicity models.
The combination of direct imaging with indirect methods provides a clearer picture of the HD 91312 system. Absent dynamical mass information from astrometry and radial-velocity, the mass for HD 91312 B would have to have been inferred from luminosity evolution models assuming a system age, which is not tightly constrained. The inclusion of data from these indirect methods, however, yields a mass precision of 10%. Finally, this result with other companions discovered from our Hipparcos-Gaia direct imaging survey reinforce the value of using astrometry to screen for promising direct imaging targets (Currie et al., 2020; Steiger et al., 2021). The revised version of HGCA uses Gaia-eDR3 astrometry, which is about a factor of 3 more precision than that in the DR2 release (Brandt et al. 2021, submitted), making the catalogue more sensitive to the presence of jovian companions. The first joint direct imaging + astrometry discovery of an exoplanet is likely only a matter of time.
T.C. was supported by a NASA Senior Postdoctoral Fellowship and NASA/Keck grant LK-2663-948181. We thank the Subaru and NASA Keck Time Allocation Committees for their generous support of this program.
The development of SCExAO was supported by JSPS (Grant-in-Aid for Research #23340051, #26220704 & #23103002), Astrobiology Center of NINS, Japan, the Mt Cuba Foundation, and the director’s contingency fund at Subaru Telescope. CHARIS was developed under the support by the Grant-in-Aid for Scientific Research on Innovative Areas #2302. Some of the data presented herein were obtained at the W. M. Keck Observatory, which is operated as a scientific partnership among the California Institute of Technology, the University of California and the National Aeronautics and Space Administration. The Observatory was made possible by the generous financial support of the W. M. Keck Foundation.
K.W. acknowledges support from NASA through the NASA Hubble Fellowship grant HST- HF2-51472.001-A awarded by the Space Telescope Science Institute, which is operated by the Association of Universities for Research in Astronomy, Incorporated, under NASA contract NAS5-26555.
M.T. is supported by JSPS KAKENHI grant Nos.18H05442, 15H02063, and 22000005.
This work was supported by JSPS Grants-in-Aid for Scientic Research, 17K05399 (E.A.).
References
- Allard et al. (2012a) Allard, F., Homeier, D., & Freytag, B. 2012a, Philosophical Transactions of the Royal Society of London Series A, 370, 2765, doi: 10.1098/rsta.2011.0269
- Allard et al. (2012b) Allard, F., Homeier, D., Freytag, B., & Sharp, C. M. 2012b, in EAS Publications Series, Vol. 57, EAS Publications Series, ed. C. Reylé, C. Charbonnel, & M. Schultheis, 3–43, doi: 10.1051/eas/1257001
- Baraffe et al. (2015) Baraffe, I., Homeier, D., Allard, F., & Chabrier, G. 2015, A&A, 577, A42, doi: 10.1051/0004-6361/201425481
- Barman et al. (2015) Barman, T. S., Konopacky, Q. M., Macintosh, B., & Marois, C. 2015, ApJ, 804, 61, doi: 10.1088/0004-637X/804/1/61
- Berardo et al. (2017) Berardo, D., Cumming, A., & Marleau, G.-D. 2017, ApJ, 834, 149, doi: 10.3847/1538-4357/834/2/149
- Blunt et al. (2017) Blunt, S., Nielsen, E. L., De Rosa, R. J., et al. 2017, AJ, 153, 229, doi: 10.3847/1538-3881/aa6930
- Borgniet et al. (2019) Borgniet, S., Lagrange, A. M., Meunier, N., et al. 2019, A&A, 621, A87, doi: 10.1051/0004-6361/201833431
- Bowler et al. (2021) Bowler, B. P., Cochran, W. D., Endl, M., et al. 2021, AJ, 161, 106, doi: 10.3847/1538-3881/abd243
- Brandt (2018) Brandt, T. D. 2018, ApJS, 239, 31, doi: 10.3847/1538-4365/aaec06
- Brandt et al. (2019) Brandt, T. D., Dupuy, T. J., & Bowler, B. P. 2019, AJ, 158, 140, doi: 10.3847/1538-3881/ab04a8
- Brandt et al. (2021) Brandt, T. D., Dupuy, T. J., Li, Y., et al. 2021, arXiv e-prints, arXiv:2105.11671. https://arxiv.org/abs/2105.11671
- Brandt et al. (2017) Brandt, T. D., Rizzo, M., Groff, T., et al. 2017, Journal of Astronomical Telescopes, Instruments, and Systems, 3, 048002, doi: 10.1117/1.JATIS.3.4.048002
- Bulger et al. (2013) Bulger, J., Hufford, T., Schneider, A., et al. 2013, A&A, 556, A119, doi: 10.1051/0004-6361/201321726
- Calissendorff & Janson (2018) Calissendorff, P., & Janson, M. 2018, A&A, 615, A149, doi: 10.1051/0004-6361/201833309
- Carson et al. (2013) Carson, J., Thalmann, C., Janson, M., et al. 2013, ApJ, 763, L32, doi: 10.1088/2041-8205/763/2/L32
- Casagrande et al. (2008) Casagrande, L., Flynn, C., & Bessell, M. 2008, MNRAS, 389, 585, doi: 10.1111/j.1365-2966.2008.13573.x
- Choi et al. (2016) Choi, J., Dotter, A., Conroy, C., et al. 2016, ApJ, 823, 102, doi: 10.3847/0004-637X/823/2/102
- Currie et al. (2010) Currie, T., Bailey, V., Fabrycky, D., et al. 2010, ApJ, 721, L177, doi: 10.1088/2041-8205/721/2/L177
- Currie et al. (2015) Currie, T., Cloutier, R., Brittain, S., et al. 2015, ApJ, 814, L27, doi: 10.1088/2041-8205/814/2/L27
- Currie et al. (2011) Currie, T., Burrows, A., Itoh, Y., et al. 2011, ApJ, 729, 128, doi: 10.1088/0004-637X/729/2/128
- Currie et al. (2012) Currie, T., Debes, J., Rodigas, T. J., et al. 2012, ApJ, 760, L32, doi: 10.1088/2041-8205/760/2/L32
- Currie et al. (2018) Currie, T., Brandt, T. D., Uyama, T., et al. 2018, AJ, 156, 291, doi: 10.3847/1538-3881/aae9ea
- Currie et al. (2020) Currie, T., Brandt, T. D., Kuzuhara, M., et al. 2020, ApJ, 904, L25, doi: 10.3847/2041-8213/abc631
- David & Hillenbrand (2015) David, T. J., & Hillenbrand, L. A. 2015, ApJ, 804, 146, doi: 10.1088/0004-637X/804/2/146
- De Rosa et al. (2014) De Rosa, R. J., Patience, J., Wilson, P. A., et al. 2014, MNRAS, 437, 1216, doi: 10.1093/mnras/stt1932
- Dotter (2016) Dotter, A. 2016, ApJS, 222, 8, doi: 10.3847/0067-0049/222/1/8
- Dotter et al. (2008) Dotter, A., Chaboyer, B., Jevremović, D., et al. 2008, ApJS, 178, 89, doi: 10.1086/589654
- Feiden et al. (2011) Feiden, G. A., Chaboyer, B., & Dotter, A. 2011, ApJ, 740, L25, doi: 10.1088/2041-8205/740/1/L25
- Fontanive et al. (2019) Fontanive, C., Mužić, , K., Bonavita, M., & Biller, B. 2019, MNRAS, 490, 1120, doi: 10.1093/mnras/stz2587
- Gagné et al. (2014) Gagné, J., Lafrenière, D., Doyon, R., Malo, L., & Artigau, É. 2014, ApJ, 783, 121, doi: 10.1088/0004-637X/783/2/121
- Gagné et al. (2015) Gagné, J., Faherty, J. K., Cruz, K. L., et al. 2015, ApJS, 219, 33, doi: 10.1088/0067-0049/219/2/33
- Gaia Collaboration et al. (2018) Gaia Collaboration, Brown, A. G. A., Vallenari, A., et al. 2018, A&A, 616, A1, doi: 10.1051/0004-6361/201833051
- Greco & Brandt (2016) Greco, J. P., & Brandt, T. D. 2016, ApJ, 833, 134, doi: 10.3847/1538-4357/833/2/134
- Groff et al. (2016) Groff, T. D., Chilcote, J., Kasdin, N. J., et al. 2016, in Society of Photo-Optical Instrumentation Engineers (SPIE) Conference Series, Vol. 9908, Ground-based and Airborne Instrumentation for Astronomy VI, 99080O, doi: 10.1117/12.2233447
- Hodapp et al. (2008) Hodapp, K. W., Suzuki, R., Tamura, M., et al. 2008, in Society of Photo-Optical Instrumentation Engineers (SPIE) Conference Series, Vol. 7014, Proc. SPIE, 701419, doi: 10.1117/12.788088
- Janson et al. (2013) Janson, M., Brandt, T. D., Moro-Martín, A., et al. 2013, ApJ, 773, 73, doi: 10.1088/0004-637X/773/1/73
- Jovanovic et al. (2015a) Jovanovic, N., Guyon, O., Martinache, F., et al. 2015a, ApJ, 813, L24, doi: 10.1088/2041-8205/813/2/L24
- Jovanovic et al. (2015b) Jovanovic, N., Martinache, F., Guyon, O., et al. 2015b, PASP, 127, 890, doi: 10.1086/682989
- Kenyon & Hartmann (1995) Kenyon, S. J., & Hartmann, L. 1995, ApJS, 101, 117, doi: 10.1086/192235
- Kuzuhara et al. (2013) Kuzuhara, M., Tamura, M., Kudo, T., et al. 2013, ApJ, 774, 11, doi: 10.1088/0004-637X/774/1/11
- Lafrenière et al. (2007) Lafrenière, D., Marois, C., Doyon, R., Nadeau, D., & Artigau, É. 2007, ApJ, 660, 770, doi: 10.1086/513180
- Lagrange et al. (2019) Lagrange, A. M., Boccaletti, A., Langlois, M., et al. 2019, A&A, 621, L8, doi: 10.1051/0004-6361/201834302
- Lagrange et al. (2020) Lagrange, A. M., Rubini, P., Nowak, M., et al. 2020, A&A, 642, A18, doi: 10.1051/0004-6361/202038823
- Marois et al. (2000) Marois, C., Doyon, R., Racine, R., & Nadeau, D. 2000, PASP, 112, 91, doi: 10.1086/316492
- Marois et al. (2006) Marois, C., Lafrenière, D., Doyon, R., Macintosh, B., & Nadeau, D. 2006, ApJ, 641, 556, doi: 10.1086/500401
- Marois et al. (2008) Marois, C., Macintosh, B., Barman, T., et al. 2008, Science, 322, 1348, doi: 10.1126/science.1166585
- Nakajima et al. (1995) Nakajima, T., Oppenheimer, B. R., Kulkarni, S. R., et al. 1995, Nature, 378, 463, doi: 10.1038/378463a0
- Paxton et al. (2011) Paxton, B., Bildsten, L., Dotter, A., et al. 2011, ApJS, 192, 3, doi: 10.1088/0067-0049/192/1/3
- Paxton et al. (2013) Paxton, B., Cantiello, M., Arras, P., et al. 2013, ApJS, 208, 4, doi: 10.1088/0067-0049/208/1/4
- Paxton et al. (2015) Paxton, B., Marchant, P., Schwab, J., et al. 2015, ApJS, 220, 15, doi: 10.1088/0067-0049/220/1/15
- Paxton et al. (2018) Paxton, B., Schwab, J., Bauer, E. B., et al. 2018, ApJS, 234, 34, doi: 10.3847/1538-4365/aaa5a8
- Pecaut & Mamajek (2013) Pecaut, M. J., & Mamajek, E. E. 2013, ApJS, 208, 9, doi: 10.1088/0067-0049/208/1/9
- Pueyo (2016) Pueyo, L. 2016, ApJ, 824, 117, doi: 10.3847/0004-637X/824/2/117
- Rhee et al. (2007) Rhee, J. H., Song, I., Zuckerman, B., & McElwain, M. 2007, ApJ, 660, 1556, doi: 10.1086/509912
- Rodrigo & Solano (2020) Rodrigo, C., & Solano, E. 2020, in Contributions to the XIV.0 Scientific Meeting (virtual) of the Spanish Astronomical Society, 182
- Rodrigo et al. (2012) Rodrigo, C., Solano, E., & Bayo, A. 2012, SVO Filter Profile Service Version 1.0, IVOA Working Draft 15 October 2012, doi: 10.5479/ADS/bib/2012ivoa.rept.1015R
- Soummer et al. (2012) Soummer, R., Pueyo, L., & Larkin, J. 2012, ApJ, 755, L28, doi: 10.1088/2041-8205/755/2/L28
- Spada et al. (2017) Spada, F., Demarque, P., Kim, Y. C., Boyajian, T. S., & Brewer, J. M. 2017, ApJ, 838, 161, doi: 10.3847/1538-4357/aa661d
- Spiegel & Burrows (2012) Spiegel, D. S., & Burrows, A. 2012, ApJ, 745, 174, doi: 10.1088/0004-637X/745/2/174
- Steiger et al. (2021) Steiger, S., Currie, T., Brandt, T. D., et al. 2021, arXiv e-prints, arXiv:2103.06898. https://arxiv.org/abs/2103.06898
- Zimmerman et al. (2010) Zimmerman, N., Oppenheimer, B. R., Hinkley, S., et al. 2010, ApJ, 709, 733, doi: 10.1088/0004-637X/709/2/733
- Zorec & Royer (2012) Zorec, J., & Royer, F. 2012, A&A, 537, A120, doi: 10.1051/0004-6361/201117691