R. K. Zamanov, K. A. Stoyanov, Y. M. Nikolov, T. Bonev, D. Marchev, S. J. Stefanov
11institutetext: Institute of Astronomy and National Astronomical Observatory, Bulgarian Academy of Sciences,
Tsarigradsko Shose 72, BG-1784, Sofia, Bulgaria
22institutetext: Department of Physics and Astronomy, Shumen University ”Episkop Konstantin Preslavski”,
115 Universitetska Str., 9700 Shumen, Bulgaria
33institutetext: Department of Astronomy, Sofia University ”St. Kliment Ohridski”,
James Bourchier 5, BG-1164 Sofia, Bulgaria
33email: rkz@astro.bas.bg kstoyanov@astro.bas.bg
\papertypeResearch report, Received 24 September 2021 / Accepted .. … …….
spectroscopy of the recurrent nova RS Oph during the 2021 outburst
Abstract
We report spectroscopic observations of the emission line
of the recurrent nova RS Oph obtained between 12 and 23 August 2021
during the recent outburst.
On the basis of the sharp P Cyg profile superimposed onto the strong
emission, we estimate that the outflowing velocity of the material surrounding
RS Oph is in the range
32 km s-1 68 km s-1.
The new GAIA distance indicates that the red giant should be probably
classified in between II and III luminosity class.
The spectra are available upon request from the authors and on Zenodo.
keywords:
Stars: novae, cataclysmic variables – binaries: symbiotic – stars: individual: RS OphIntroduction
In the binary systems, the nova outburst is powered by thermonuclear runaway on the surface of the white dwarf (see Bode & Evans 2008 for a comprehensive review). For a long period of time, the hydrogen-rich material is being accreted from the donor star to the white dwarf and forms an envelope on its surface. Once the critical pressure at the base of the accreted layer is reached, the thermonuclear runaway is ignited, causing a dramatic brightening (e.g. Shafter et al. 2009). The binary system survives the outburst and the mass accumulates once again and the nova recurs on a time-scale that depends on the accretion rate and on the white dwarf mass. The objects that experience more than one nova outburst are known as recurrent novae (e.g. Mukai 2015). It is believed that all classical novae are recurrent with intervals between the outbursts of many centuries.
The 2021 nova outburst of RS Oph was reported on 2021 August 8.93 by K. Geary (AAVSO Alert Notice 752). The first spectral follow-up observations reveal resemblance of a He/N nova and the presence of prominent Balmer lines, and He I, Fe II, O I and N II features with P Cyg profiles (Taguchi, Ueta & Isogai 2021; Munari & Valisa 2021a). Further spectral observations, obtained 2 days after the outburst, indicate an acceleration of the ejecta, reaching velocities of about km s-1 and km s-1, estimated from the P Cyg profiles of the H and H lines respectively (Mikolajewska et al. 2021). The outburst was detected also in the radio (Williams et al. 2021), X-rays (Shidatsu et al. 2021) and -rays in GeV domain (Cheung, Ciprini & Johnson 2021) and TeV domain (Wagner & H. E. S. S. Collaboration 2021).
Here we present H observations of RS Oph from 2021 Aug 16 to 2021 Aug 23 and discuss (1) the P Cyg type profile at the top of the emission and (2) the absolute magnitude of the red giant.
1 Observations
High-resolution optical spectra of RS Oph are secured with the Coudè spectrograph attached to the 2m telescope of the Rozhen National Astronomical Observatory, located in Rhodope mountains, Bulgaria. The spectra cover 225 Å around the H line with a resolution of 0.11 Å/pixel. The spectra are reduced in the standard way including bias removal, flat-field correction, and wavelength calibration using the routines provided in iraf (Tody 1993). The wavelength calibration is done with Thorium-Argon (Th-Ar) hollow cathode lamp and tuned using the telluric lines imprinted in the spectrum (see Fig. 3 in Appendix). The FWHM (full width at half maximum) of the Th-Ar lines is 0.4 Å, the FWHM of the telluric lines is 0.5 Å. The spectra cover the wavelength range from 6450 Å to 6675 Å. The spectra are available upon request from the authors and on Zenodo (zenodo.org/record/5524465).
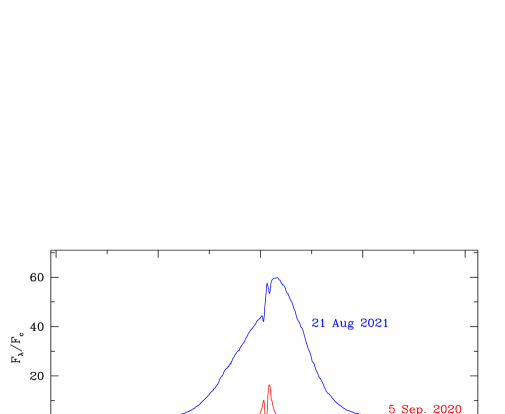
For comparative purposes, we also use two spectra obtained with the Echelle spectrograph of the same telescope in 2019 and 2020, and one spectrum obtained with an 11 inches Celestron C11 telescope and Lhires III spectrograph. Two observations of the emission line are plotted on Fig. 1. One of them is before the outburst (5 September 2020) and the second is in outburst (21 August 2021). In outburst, the emission is of about 20 times stronger and 5 times wider.
The journal of observations and the measured parameters of line are given in Table 1:
-
•
column 1 - date of observation (in format YYYY MM DD HH:MM). The time is the start of the exposure.
-
•
column 2 - telescope and spectrograph;
-
•
column 3 - the exposure time in minutes;
-
•
column 4 - the total equivalent width of emission line;
-
•
column 5 - the FWHM of the emission line. This is the FWHM of the strong broad component only. This component is emitted from the expanding envelope.
-
•
column 6 - the wavelength of the diffuse interstellar band DIB 6613, which is used for check of the wavelength calibration;
-
•
column 7 - the heliocentric radial velocity of the absorption part of the P Cyg profile. For the spectra 20190718 and 20200905, column 7 is the heliocentric radial velocity of the central dip, located in between the blue and red peaks.
-
•
column 8 - the heliocentric radial velocity of the emission part of the P Cyg profile.
| Date-obs | telescope | expo | EW | FWHM H | DIB6613 | RVabs | RVem |
|---|---|---|---|---|---|---|---|
| [min] | [Å] | [Å] | [Å] | [km s-1] | [km s-1] | ||
| 1 | 2 | 3 | 4 | 5 | 6 | 7 | 8 |
| 2019 07 18 20:06 | 2m Ech | 60 | 6613.369 | ||||
| 2020 09 05 19:07 | 2m Ech | 30 | 6613.318 | ||||
| 2021 08 12 20:32 | C11” | 30 | 80 | ||||
| 2021 08 16 20:28 | 2m Coude | 3 | 60 | 6613.305 | |||
| 2021 08 17 20:25 | 2m Coude | 5 | 6613.373 | ||||
| 2021 08 19 20:01 | 2m Coude | 5 | 60 | 6613.321 | |||
| 2021 08 20 19:17 | 2m Coude | 5 | 70 | 6613.391 | |||
| 2021 08 21 19:10 | 2m Coude | 10 | 90 | 6613.342 | |||
| 2021 08 22 19:01 | 2m Coude | 5 | 95 | 6613.353 | |||
| 2021 08 23 19:46 | 2m Coude | 5 | 95 | 6613.296 |
2 Results
In our data set is visible that (1) the FWHM of the the strong emission originating from the nova ejecta is monotonically decreasing from 45.8 Å on 12 August 2021 to 24.5 Å on 23 August 2021 (see Table 1, column 5); and (2) its EW is increasing. A more detailed atlas can be found in Munari & Valisa (2021b).
2.1 Absolute V magnitude () of the mass donor
The light curves of RS Oph during the last 30 years are well documented in AAVSO data. In quiescence the V band magnitude of RS Oph is . According to the AAVSO V-band light curve, the maximum brightness of RS Oph during the outburst is V=4.593 mag. The observations suggest an outburst amplitude of 6 – 6.5 mag. To calculate the absolute V band magnitude we use the well known formula:
| (1) |
where is the apparent V band magnitude, is the interstellar reddening, is the distance in parsecs. For RS Oph (Zamanov et al. 2018), and pc (GAIA eDR3, Gaia Collaboration et al. 2021). Using V=4.593 mag, we obtain an absolute V magnitude at the maximum mag.
The brightness of the red giant in RS Oph is 12.26 (Zamanov et al. 2018). Using again Eq. 1, we obtain that the absolute V-band magnitude of the red giant is mag. Following Straizys & Kuriliene (1981) M2III giant has absolute V magnitude , while for luminosity class II, M2II – . It means that the new GAIA distance puts the red giant of RS Oph in between luminosity classes III and II. It is worth noting that with the old value pc (Bode 1987), the red giant would have , in agreement with M2III spectral type.
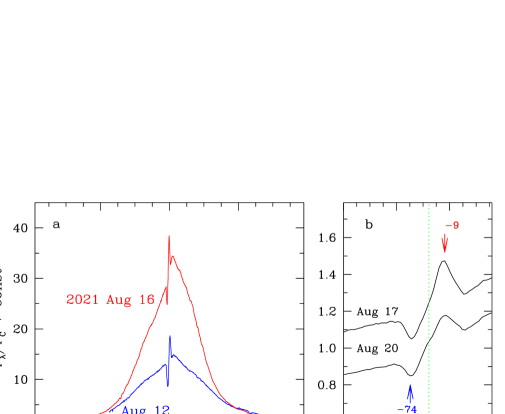
(b) Expanded view of the P Cyg profile. The average positions of the emission ( km s-1), and the absorption ( km s-1) are marked with arrows. The systemic velocity ( km s-1) is marked with vertical green line.
2.2 P Cyg profile
On Fig. 2a are plotted the H profiles observed on 12 August 2021 and 16 August 2021. A sharp P Cyg component is visible at the top of the strong emission. It is superimposed on the broad emission line. It probably is due to the outer parts of the slow wind of the red giant and/or the material from the previous outbursts ionized by the nova outburst. It consists of an blue absorption and red emission. It is strong and very well visible on the low resolution spectrum obtained on 12 August 2021. We measure the heliocentric radial velocity of these P Cyg absorption and emission. They are given in Table 1. The average position of the P Cyg absorption is km s-1 and of the P Cyg emission is km s-1. The position of the absorption is close to the radial velocity of the central dip of at quiescence.
The analysis of the CaII and NaD lines of RS Oph (Patat et al. 2011) reveals at least three distinct circumstellar components at km s-1, km s-1, and km s-1, respectively. Our measurements indicate that probably, the component at km s-1 is visible in our spectra.
On Fig. 2b is plotted an expanded view of the P Cyg profile. The average positions of the emission ( km s-1), and the absorption ( km s-1) are marked with red and blue arrow, respectively. The systemic velocity of RS Oph is estimated km s-1 (Brandi et al. 2009) and km s-1 (Fekel et al. 2000). The systemic velocity is marked with vertical green line.
Using the velocities given in Table 1, we can estimated the outflowing velocity, , as km s-1 and km s-1. These two values should be considered as limits, and consecutively our estimate of the outflowing velocity of the material surrounding RS Oph is 32 km s-1 68 km s-1 (1 error is taken into account).
Such velocities have been observed from the circumstellar envelopes of a few supernovae – SN 1991T, SN 1998es, SN 2006X (see Fig. 1 of Patat 2013). This similarity is a clue that the progenitor systems of some Type Ia supernovae can be former recurrent nova systems like RS Oph (e.g. Patat et al. 2011).
Conclusions: We report spectroscopic observations of the recurrent nova RS Oph obtained before and during the 2021 nova outburst. For the material surrounding RS Oph, we find outflowing velocity 32 km s-1 68 km s-1, which is similar to the circumstellar envelopes of some supernovae. We note that the new GAIA distance indicates that the red giant should be probably classified in between II and III luminosity class.
Acknowledgments: This work is supported by Bulgarian National Science Fund - projects KP-06-H28/2 ”Binary stars with compact object” and DN 18/13 12.12.2017 ”Evolutionary processes in astrophysics: synergy of observations with theory”. DM also acknowledges support from the Research Fund of the Shumen University.
References
- [1] Bode, M. F. 1987, RS Ophiuchi (1985) and the Recurrent Nova Phenomenon, VNU Science Press, p. 241
- [2] Bode, M. F., & Evans, A. 2008, Classical Novae, 2nd Edition. Cambridge Astrophysics Series, No. 43, Cambridge: Cambridge University Press, 2008., 43
- [3] Brandi, E., Quiroga, C., Mikołajewska, J., et al. 2009, A&A, 497, 815
- [4] Cheung, C. C., Ciprini, S., & Johnson, T. J. 2021, The Astronomer’s Telegram, 14834
- [5] Fekel, F. C., Joyce, R. R., Hinkle, K. H., et al. 2000, AJ, 119, 1375
- [6] Gaia Collaboration, Klioner, S. A., Mignard, F., et al. 2021, A&A, 649, A9
- [7] Gehrz, R. D., Truran, J. W., Williams, R. E., & Starrfield, S. 1998, PASP, 110, 3
- [8] Mikolajewska, J., Aydi, E., Buckley, D., et al. 2021, The Astronomer’s Telegram, 14852
- [9] Mukai, K. 2015, Acta Polytechnica CTU Proceedings, 2, 246
- [10] Munari, U. & Valisa, P. 2021a, The Astronomer’s Telegram, 14840
- [11] Munari, U. & Valisa, P. 2021b, 2021arXiv210901101
- [12] Patat, F., Chugai, N. N., Podsiadlowski, Ph., Mason, E., Melo, C., Pasquini, L., 2011, A&A, 530, A63
- [13] Patat, F., 2013, IAU Symp. 281, ”Binary Paths to Type Ia Supernovae Explosions”, eds. R. Di Stefano, M. Orio, M. Moe, p. 291
- [14] Shafter, A. W., Rau, A., Quimby, R. M., et al. 2009, ApJ, 690, 1148
- [15] Shidatsu, M., Negoro, H., Mihara, T., et al. 2021, The Astronomer’s Telegram, 14846
- [16] Straizys, V. & Kuriliene, G., 1981, Ap& SS, 80, 353
- [17] Taguchi, K., Ueta, T., & Isogai, K. 2021, The Astronomer’s Telegram, 14838
- [18] Tody, D. 1993, Astronomical Data Analysis Software and Systems II, 52, 173
- [19] Wagner, S. J. & H. E. S. S. Collaboration 2021, The Astronomer’s Telegram, 14844
- [20] Williams, D., O’Brien, T., Woudt, P., et al. 2021, The Astronomer’s Telegram, 14849
- [21] Zamanov, R. K., Boeva, S., Latev, G. Y., et al. 2018, MNRAS, 480, 1363
3 Appendix: Telluric lines around
The following telluric lines: 6532.359, 6543.907, 6548.622, 6552.629, 6557.171, 6572.072, 6574.847, 6580.786, 6586.596, 6599.324 are marked on Fig. 3. They are used for tuning the wavelength calibration.
