Normal, Dust-Obscured Galaxies in the Epoch of Reionization
Abstract
Over the past decades, rest-frame ultraviolet (UV) observations have provided large samples of UV luminous galaxies at redshift (z) greater than 6[Madau2014, Bouwens15aLF, Ono18], during the so-called epoch of reionization. While a few of these UV identified galaxies revealed significant dust reservoirs[Watson15, Hashimoto19, Tamura19, Bakx20], very heavily dust-obscured sources at these early times have remained elusive. They are limited to a rare population of extreme starburst galaxies[Riechers2013, Strandet17, Marrone2018, Dudzeviciute20, Riechers2020], and companions of rare quasars[Decarli2017, Mazzucchelli2019]. These studies conclude that the contribution of dust-obscured galaxies to the cosmic star formation rate density at is sub-dominant. Recent ALMA and Spitzer observations have identified a more abundant, less extreme population of obscured galaxies at [Wang2019, Williams2019]. However, this population has not been confirmed in the reionization epoch so far. Here, we report the discovery of two dust-obscured star forming galaxies at and . These objects are not detected in existing rest-frame UV data, and were only discovered through their far-infrared [CII] lines and dust continuum emission as companions to typical UV-luminous galaxies at the same redshift. The two galaxies exhibit lower infrared luminosities and star-formation rates than extreme starbursts, in line with typical star-forming galaxies at . This population of heavily dust-obscured galaxies appears to contribute 10-25 per cent to the cosmic star formation rate density.
Department of Astronomy, University of Geneva, 51 Ch. Pegasi, 1290 Versoix, Switzerland
Research Institute for Science and Engineering, Waseda University, 3-4-1 Okubo, Shinjuku, Tokyo 169-8555, Japan
National Astronomical Observatory of Japan, 2-21-1, Osawa, Mitaka, Tokyo, Japan
Cosmic Dawn Center (DAWN), Niels Bohr Institute, University of Copenhagen, Jagtvej 128, København N, DK-2200, Denmark
Leiden Observatory, Leiden University, PO Box 9500, 2300 RA Leiden, The Netherlands
Astrophysics Research Institute, Liverpool John Moores University, 146 Brownlow Hill, Liverpool L3 5RF, UK
Sub-department of Astrophysics, The Denys Wilkinson Building, University of Oxford, Keble Road, Oxford, OX1 3RH, UK
Steward Observatory, University of Arizona, 933 N Cherry Ave, Tucson, AZ 85721, USA
Departmento de Astronomia, Universidad de Chile, Casilla 36-D, Santiago 7591245, Chile
Centro de Astrofisica y Tecnologias Afines (CATA), Camino del Observatorio 1515, Las Condes, Santiago 7591245, Chile
Hiroshima Astrophysical Science Center, Hiroshima University, 1-3-1 Kagamiyama, Higashi-Hiroshima, Hiroshima 739-8526, Japan
Centre for Astrophysics & Supercomputing, Swinburne University of Technology, PO Box 218, Hawthorn, VIC 3112, Australia
Nucleo de Astronomia, Facultad de Ingenieria y Ciencias, Universidad Diego Portales, Av. Ejercito 441, Santiago, Chile
International Centre for Radio Astronomy Research, University of Western Australia, 35 Stirling Hwy, Crawley, WA 6009, Australia
ARC Centre of Excellence for All Sky Astrophysics in 3 Dimensions (ASTRO 3D)
Kapteyn Astronomical Institute, University of Groningen, PO Box 800, NL-9700 AV Groningen, the Netherlands
Scuola Normale Superiore, Piazza dei Cavalieri 7, 56126 Pisa, Italy
Dipartimento di Fisica, Sapienza, Universita di Roma, Piazzale Aldo Moro 5, I-00185 Roma, Italy
INAF/Osservatorio Astronomico di Roma, via Frascati 33, 00078 Monte Porzio Catone, Roma, Italy
INAF/Osservatorio Astrofisico di Arcetri, Largo E. Femi 5, I-50125 Firenze, Italy
Department of Astronomy & Astrophysics, The Pennsylvania State University, 525 Davey Lab, University Park, PA 16802, USA
Institute for Gravitation and the Cosmos, The Pennsylvania State University, University Park, PA 16802, USA
Sterrenkundig Observatorium, Ghent University, Krijgslaan 281 - S9, 9000 Gent, Belgium
Dept. of Physics & Astronomy, University College London,Gower Street, London WC1E 6BT, UK
Cornell University, 220 Space Sciences Building, Ithaca, NY 14853, USA
Sapienza School for Advanced Studies, Viale Regina Elena 291, 00161 Roma Italy
INFN, Sezione di Roma 1, P.le Aldo Moro 2, 00185 Roma,
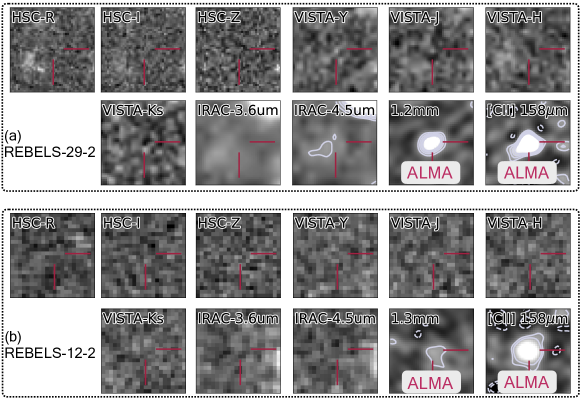
As part of the ongoing ALMA large program REBELS (Reionization-Era Bright Emission Line Survey), we are observing 40 UV-luminous primary targets at [Bouwens21]. Among these targets are REBELS-12 and REBELS-29. When inspecting the ALMA data cube of these two sources, we identified two additional emission line neighbors.
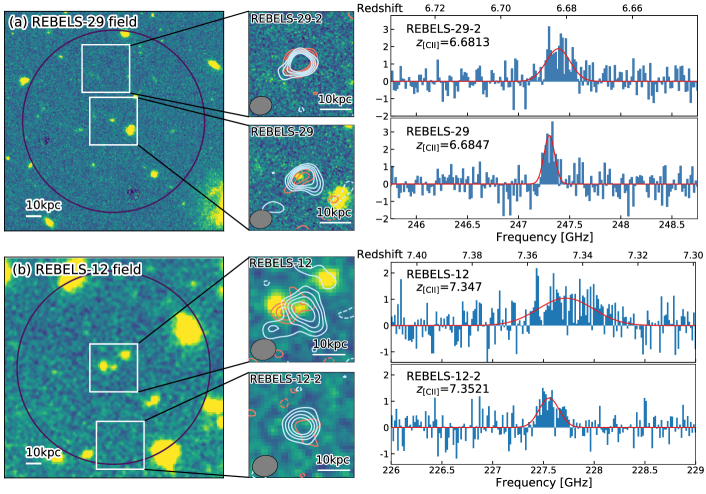
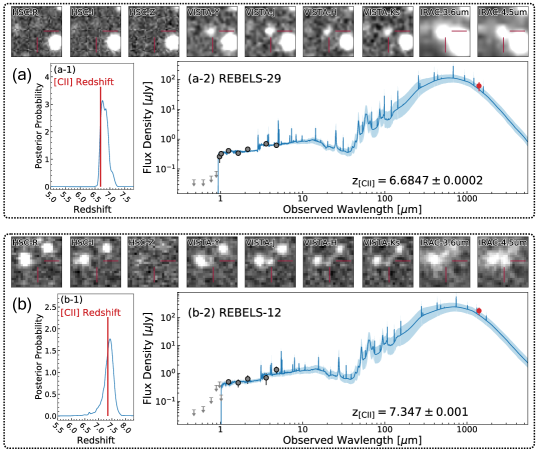
The primary targets of our ALMA observing program, REBELS-12 and REBELS-29, represent some of the most UV-luminous galaxies in this redshift range, and have and They were originally identified with a photometric redshift of and , respectively, based on deep ground based optical and near-infrared (NIR) data. The ALMA observations were carried out on 24 and 29 November 2019, targeting the singly ionized carbon emission line, [CII] and dust continuum emission with a frequency coverage of the vast majority of the photometric redshift probability distribution. The ALMA observations reached emission line sensitivities of and per spectral element for REBELS-29 and REBELS-12, respectively. This resulted in clear [CII] emission line detections of both sources, at frequencies perfectly consistent with the photometric redshift estimations (see Figure 1 and Extended Data Figure 1). The integrated flux densities of these lines are and corresponding to point source detection significances of and , respectively. These lines yield a spectroscopic redshift of and for REBELS-29 and REBELS-12, respectively.
The [CII] line integrated maps of these galaxies revealed two strong, serendipitous emission lines at and arcsec offset from the primary targets, corresponding to and , respectively. The continuum subtracted spectra then confirmed that the additional emission lines emerge at almost exactly the same frequency as the central targets (velocity offsets of and for REBELS-29 and REBELS-12, respectively; see Right Panels of Figure 1). Hereafter, we call these additional line sources REBELS-12-2 and REBELS-29-2.
After correcting for the primary beam attenuation, these emission lines have integrated flux densities of and corresponding to a detection significance of and in the moment-0 maps for REBELS-29-2 and REBELS-12-2, respectively. Additionally, REBELS-29-2 has a clear () dust continuum detection, while only a tentative () continuum signal is found for REBELS-12-2. These measurements correspond to flux densities of and after applying primary beam and cosmic microwave background (CMB) corrections, respectively (see Extended Data Table 1).
Given the significance of the emission line detections and the number of independent beams in the moment-0 maps, the probability of a random Gaussian noise fluctuation is negligible. Furthermore, the co-spatial continuum signals confirm that these blind line detections are real. In the Method section, we estimate the probability of finding an unassociated, random emission line almost exactly at the same frequency as a primary one in an ALMA data cube to be extremely small (). Therefore, this strongly suggests that these serendipitous detections stem from neighboring sources sitting in the same environment as the primary targets. The [CII] redshifts of REBELS-29-2 and REBELS-12-2 are thus and , respectively.
REBELS-29-2 and REBELS-12-2 are covered by deep optical/NIR observations, corresponding to rest-frame UV/optical wavelengths. However, neither source shows any optical counterpart (Figure 1 and Extended Data Figure 2) except for a tentative () Spitzer IRAC detection of REBELS-29-2. These non-detections in rest-frame UV/optical bands indicate that these serendipitously found [CII] line emitters are heavily dust-obscured galaxies.
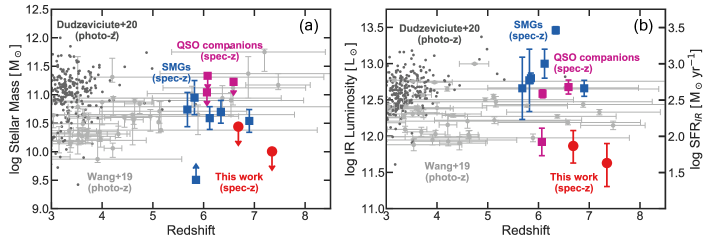
SFRs are estimated based on the UV and FIR luminosities. However, due to the non-detections in rest-UV data we can only provide limits on the UV-based SFRs, for which we find and (at 2); the IR-based SFRs from the ALMA dust continuum amount to and for REBELS-29-2 and REBELS-12-2, respectively. We hereafter use the SFRs directly derived from FIR luminosities as our fiducial SFRs (for more information, see Methods).
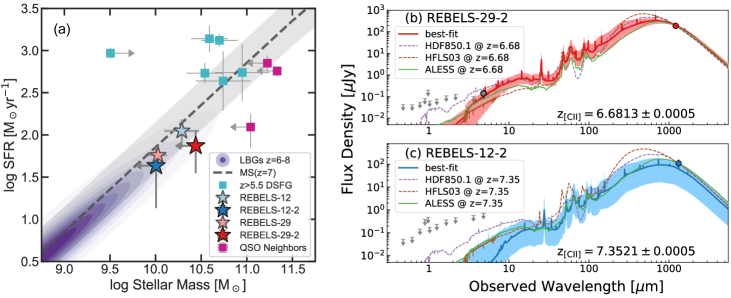
Given the optical non-detections of REBELS-29-2 and REBELS-12-2, also their stellar masses cannot be accurately constrained. We only derive upper limits from spectral energy distribution (SED) fitting (see Methods). The estimated SFRs and stellar mass limits are consistent with normal L∗ Lyman Break galaxies (LBGs) at selected from rest-frame UV data such as the REBELS primary target sample, which define the so-called main-sequence of star-formation[Schreiber2015] (Figure 2).
| Table 1: Summary of Galaxy Properties | |||||||
|---|---|---|---|---|---|---|---|
| Galaxy Name | Redshift†dagger | RA | Dec | Stellar Mass | ††ddagger | ||
| (deg) | (deg) | () | () | () | () | ||
| REBELS-29∗* | 150.403542 | 2.630306 | |||||
| REBELS-29-2 | 150.403875 | 2.632339 | |||||
| REBELS-12 | 36.2830833 | -5.111316 | |||||
| REBELS-12-2 | 36.2828333 | -5.114225 | |||||
-
•
* ID304384 in Bowler et al. (2018)[Bowler2018]
-
•
Spectroscopic redshift measured from [CII] emission lines.
-
•
Based on LIR estimates with conservative errorbars (see Supplementary Material)
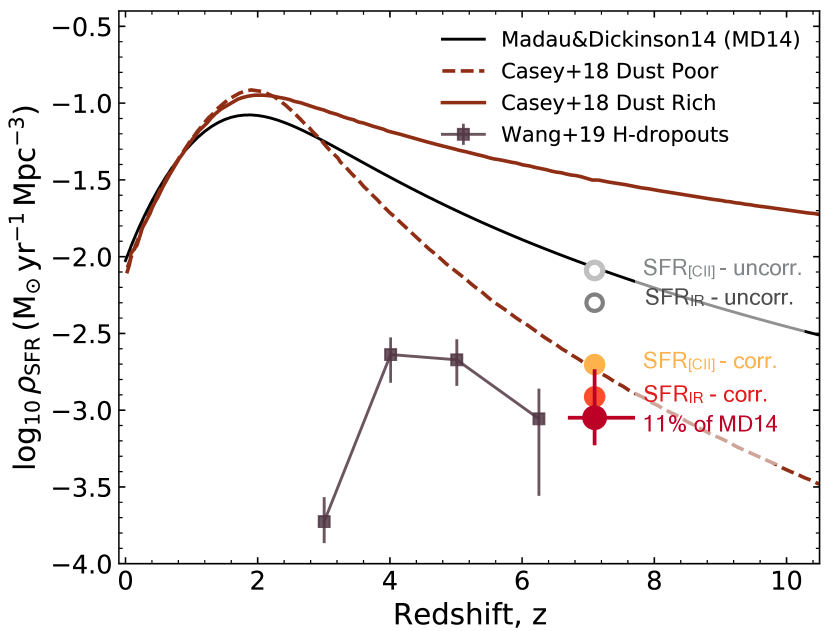
The serendipitous discovery of these two dusty galaxies at shows that our current (UV-based) census of very early galaxies is still incomplete. It is thus crucial to estimate the contribution of such sources to the total cosmic SFR density. However, this is not a trivial task given that these sources were only found as neighbors to UV-luminous primary targets. We therefore provide several different estimates (see Methods for details). Assuming that REBELS-29-2 and REBELS-12-2 were found in a completely blind survey consisting of all REBELS data-cubes and using their UV+IR-based SFRs, their SFRD would amount to 60-100 % of the total SFRD contributed from UV-selected LBGs, [Madau2014] (Figure 3). However, given that these sources were in fact detected as clustered galaxies in a targeted follow-up survey, we have to account for the excess probability of finding such sources based on the correlation function. Doing this, we estimate that the actual contribution by these sources to the SFRD is reduced by a factor , i.e., amounting to of .
An independent, conservative estimate of their SFRD contribution can be obtained from the fraction of primary UV-luminous targets with confirmed [CII] lines that revealed such a dusty neighbor (2 out of 19, i.e., ). Assuming that this fraction also applies to fainter sources, this would result in an additional SFRD of , i.e., of UV luminous sources. All these estimates are starting to constrain different models for the contribution of dust-obscured sources at high redshifts[Casey2018] (see Figure 3). It is clear, however, that a blind, wide area survey for such sources is required in the future to properly constrain their number density in blank fields. These surveys must observe substantially deeper than had been envisioned previously[Zavala21] to sample the fainter dust-obscured, but otherwise “normal” galaxies such as REBELS-12-2 and REBELS-29-2.
References
Methods
Appendix A Cosmology
Throughout this paper we assume a concordance cosmology with , , .
Appendix B Target Selection
REBELS-12 and REBELS-29 are among the sample selected in the ALMA large program REBELS (Reionization-Era Bright Emission Line Survey). The entire sample of the REBELS program consists of 40 UV-luminous galaxies () with photometric redshifts at . The corresponding UV-derived SFRs are in excess of , but they still correspond to “normal” star-forming galaxies, i.e., they lie on the main-sequence of star-formation (see Figure 1). An additional, important criterion for choosing the targets was a small uncertainty on their photometric redshifts to maximize the efficiency of the overall survey. The REBELS program is still on-going, with of the final data acquired so far. For this paper, we exploit the current dataset taken during cycle 7.
Appendix C Observations and Reduction of ALMA data
Our ALMA observations were performed as part of the project 2019.1.01634.L during ALMA Cycle-7. To scan the whole redshift probability of [CII] emission lines, the receivers were tuned to cover for REBELS-29, and for REBELS-12. In the each frequency setup, the correlator was set to frequency domain mode with a band width of in each spectral window, in order to sufficiently resolve [CII] emission lines. The observations were carried out in ALMA configuration C43-2, with projected baselines ranging from to . With our observing frequency, flux calibration errors are .
The data were calibrated using the standard ALMA calibration pipeline implemented in the Common Astronomy Software Applications package (CASA) version 5.6.1. We imaged the continuum and data cubes using the CASA task tclean with natural weighting to maximize point source sensitivity. The resulting synthesized beam sizes were and for REBELS-29 and REBELS-12, respectively. During the imaging process, synthesized beam is deconvolved by applying a source detection threshold of three times background RMS of dirty images. Because there are no extremely bright sources in our cubes and the side lobes of the synthesized beam contribute of the sensitivity, the exact choice of the cleaning threshold does not affect our image products.
After subtracting the continuum using the CASA task uvcontsub, we extracted spectra in an iterative way to create robust apertures for the extraction. From the extracted spectra, we created moment-0 map spanning over velocity width of the emission line. In the next iteration, any other pixels having positive signals down to were added and the spectra were re-extracted. This iteration continued until the integrated emission line flux converged. In all cases a few iterations were enough to achieve this.
Appendix D Optical and Near-Infrared Data
Optical and near-infrared images are obtained from publicly available surveys. In particular, REBELS-29 lies in the 2 deg2 COSMOS field covered by UltraVISTA[McCracken12], and REBELS-12 is in the VIDEO survey[Jarvis13] within the XMM-Newton Large-Scale Structure (XMM-LSS) field 3. Both of these fields thus have relatively deep, ground-based NIR imaging data in the YJHKs bands, from which the primary REBELS sources are selected. We use the DR4 images of the UltraVISTA survey. The 5 limiting magnitudes in the J-band are thus 26.0 and 24.9, respectively. REBELS-29 is covered by deep optical images with Megacam from the Canada-France-Hawaii Legacy Survey (CFHTLS[Erben09]) and both sources have additional optical imaging from the Subaru Hyper Suprime-Cam (HSC) survey[Aihara18]. These fields have also been observed with Spitzer/IRAC from various programs over the past few years. In the VIDEO field only and data are available, while COSMOS has also been covered with IRAC at and . In , the 5 limiting magnitudes measured in diameter apertures are 25.5 and 24.3 mag, respectively. For more details on the ground-based and Spitzer imaging over these fields see Bowler et al[Bowler20] and Stefanon et al[Stefanon19]. Additionally, REBELS-29 is covered by HST observations in the F140W filter[Bowler17], reaching a 5 depth of 26.9 mag. We combine all the available data to constrain the panchromatic SEDs of both the primary REBELS targets as well as the serendipitous, dusty companions.
Appendix E Derivation of Physical Parameters
Star formation rates: SFRs are estimated based on the UV and FIR luminosities (including conservative assumptions about the IR SED shapes; see the section below and Extended Data Table 1). Alternatively, we also estimate SFRs based on the correlation between SFR and L[CII], previously measured at 4z6 [Schaerer2020] and [DeLooze2014]. While this [CII] approach yields slightly higher values of and , respectively, they are still consistent within uncertainties with those derived from the UV and IR continuum (Table 1). Given the uncertain calibration of the L[CII]-SFR correlation of high-redshift galaxies, we use the SFRs directly derived from FIR luminosities as our fiducial SFRs.
Stellar mass limits: To interpret the serendipitous dusty galaxies, we estimate upper limits for their stellar masses based on their optical, NIR, and FIR photometry and SED modeling. These limits are further tested with dynamical mass estimations.
We use the publicly available code Bayesian Analysis of Galaxies for Physical Inference and Parameter EStimation (BAGPIPES[Carnall2018]) to derive SEDs consistent with all linear flux measurements and their uncertainties (see Extended Table 2), while the redshifts are fixed to the [CII] detections. The input stellar population synthesis models for BAGPIPES are based on the 2016 version of the Bruzual & Charlot library[Bruzual03], using a Kroupa[Kroupa02] initial mass function. We adopt constant SFH models with formation time as a free parameter, and we allow for metallicities ranging from 0.1 to 2.5 . Nebular continuum and line emission are added in a self-consistent manner[Byler17] based on the photoionization code CLOUDY[Ferland17] using the ionization parameter () as a free parameter. Dust attenuation is included using the standard attenuation law for star-forming galaxies[Calzetti00], with the attenuation in the V-band () as a free parameter. We have also tested the impact of using a different dust attenuation model[Charlot2000], but obtained consistent mass limits. Differential dust attenuation is allowed for stars in their birth clouds by a multiplicative factor (). Dust emission is then included self-consistently using a grid of SED models[DrainLi07] under the assumption of energy balance, i.e., that the dust-absorbed energy is re-radiated in the far-infrared. The dust emission model has three parameters: the minimum intensity of starlight incident on the dust (), the fraction of dust particles at this lowest intensity (), and the amount of PAH emission (). Overall, these SED fits thus have nine free parameters, for which we assumed very wide, uniform priors (see Extended Data Table 3 for input priors). With the current optical/NIR data we do not expect to constrain all these free parameters for the dust-obscured sources. However, our approach allows us to marginalize over these parameters in order to derive realistic upper limits of stellar masses. Through this analysis, we find 90% probability upper limits of for REBELS-29-2 (REBELS-12-2). The results are listed in Table 1 in the main text and the posterior SEDs are shown in Figure 2 and Extended Data Figure 1.
Additionally, we derive dynamical masses to test the above stellar mass limits from SED analyses. While dynamical masses are very uncertain given the current low resolution observations, they can provide a useful, independent check. In particular, we estimated dynamical masses using the [CII] emission velocity dispersion (Table 1) and [CII] emission sizes. [CII] emission sizes are measured using CASA task uvmodelfit assuming a 2D Gaussian with free parameters of total fluxes and full width at half maximum (FWHM) while centroids are fixed. REBELS-29-2 is unresolved and thus consistent with a point source in our resolution. To estimate the upper limit of dynamical masses of REBELS-29-2, we therefore assumed a synthesized beam FWHM as an upper limit size of REBELS-29-2. REBELS-12-2 is marginally resolved with the best fit Gaussian FWHM of with a position angle of degree. Following previous studies[Wang2013, Capak15], we used a simplified dyanmical mass estimate, namely: where is a [CII] emission diameter in , and the circular velocity is approximated using velocity dispersion () and inclination angle as . For the inclination angles, as the low resolution observations only provides unconstrained or uncertain values, we assumed a uniform distribution of as estimated as an approximations from a dispersion dominated system to an edge on disk[Capak15]. In this way, we found dynamical masses of , and . Assuming gas mass fraction of [Dessauges2020], these dynamical masses provide stellar mass constraints of , and for REBELS-29-2 and REBELS-12-2, respectively. While still uncertain, these estimates are thus higher, but completely consistent with the stellar mass upper limits from the panchromatic SED analyses.
Infrared Luminosity and Dust Masses: Using the rest-frame continuum measurements we estimated total infrared () luminosities following previous works[Casey2012, Capak15], which assume a range of gray body models consistent with galaxies observed at [Schreiber18, Faisst2020]. In particular, we use SEDs for which the optical depth reaches unity at . To construct FIR SED models, we assumed the following parameters: the blue power-law, the long wavelength slope, and the luminosity weighted dust temperature. We assumed a very conservative range of these parameters uniformly distributed between , , and . The range of luminosity weighted dust temperatures used here corresponds to a range of “peak temperatures” of , as calculated from the peak wavelength of the SED and assuming Wien’s displacement law (). Using the assumed parameter distributions, we normalized the FIR SEDs to the ALMA continuum fluxes at the observed wavelength of and for galaxies in the REBELS-29 and REBELS-12 fields, respectively, and calculated IR luminosity distributions. We derived IR luminosities from the obtained IR luminosity distributions by calculating the posterior median, 16th percentile, and 84th percentile values. In both the IR luminosity and dust mass calculations (see next paragraph), we applied corrections due to the CMB heating and CMB background against which we observe the dust continuum[Dacunha2013]. The results are listed in Extended Data Table 1.
We derived dust masses using the same distribution of SED parameters assuming a dust mass absorption coefficient of at the observed wavelength of and for galaxies in REBELS-29 and REBELS-12 fields, respectively. In particular, we assumed that the mass weighted dust temperatures have the same conservative distribution as the luminosity weighted dust temperatures. The estimated dust masses are and , consistent with previous studies of sources at similar redshift[Watson15, Laporte17]. Note that these masses are likely lower limits of the total dust budget, as diffuse and relatively cold dust components would be in thermal equilibrium with the CMB [Behrens2018, Liang2019, Sommovigo2020] and thus invisible from observations. Nevertheless, even with the current dust mass estimates, of metals ever produced by supernovae in these sources are already locked into dust grains, consistent with local Universe values[deVis19]. This suggests very fast dust build-up at [Mancini16, Graziani20], which will be further investigated in a follow-up paper.
Appendix F Possible Lower Redshift Contamination?
In the main text, we argued that the two serendipitously detected sources lie at the same redshift as the primary REBELS targets. The main reason for this is that galaxies in the Universe are clustered and that the emission lines lie at almost exactly the same frequency (within less than 0.2GHz) of the main targets’ lines, corresponding to velocity offsets of 250 km s-1. Here, we further quantify the probability of detecting a lower redshift source that has an emission line within 0.2 GHz of the primary target’s [CII] frequency and within the HPBW of our ALMA observations ( arcsec radius). We base this analysis on the ALMA continuum detections of the two sources, and the IR luminosity functions measured at lower redshifts[Gruppioni13]. The most likely candidate for random emission lines are transitions of CO. However, we also test other lines that have been detected in distant galaxies[Carilli13]. For each possible line, we compute the corresponding source redshift and then convert the ALMA continuum emission to a total infrared luminosity using the same template SED. Based on the IR LFs, we then compute the expected number of galaxies with ALMA fluxes larger than the observed source within a redshift interval such that the emission line would lie within 0.2 GHz of the main target’s line. As an example, if the emission line of REBELS-29-2 were CO(8-7), the source would lie at and have an infrared luminosity of . Based on the IR LF, one would then expect 3.3 galaxies per random ALMA pointing with a continuum flux larger than what is observed. For all the lines we tested, these numbers turn out to be similarly small ( galaxies) for both REBELS-12-2 and REBELS-29-2. Expressed in another way, one would need to observe ALMA pointings to find one galaxy with a continuum flux density higher than either of the two serendipitous sources and with an emission line within 0.2 GHz of the primary targets. Hence, we can safely exclude the possibility that these lines stem from random foreground galaxies.
Appendix G A New Parameter Space of Dusty Galaxies
As discussed in the main text, the two sources REBELS-29-2 and REBELS-12-2 are likely higher redshift analogues of the dust-obscured galaxies previously identified based on photometric redshifts at [Wang2019]. In Extended Data Figure 3, we compare these sources to different galaxy samples from the literature. In particular, we also show three of the four dusty companion galaxies to QSOs reported in Decarli et al.[Decarli2017] that remained undetected in follow-up rest-frame UV observations[Mazzucchelli2019]. Those sources are likely much rarer than our galaxies detected here. The number density of their central QSOs is two orders of magnitude lower than the UV-luminous LBGs of our sample. Additionally, the newly found dusty companions are located at the lower end of QSO companions in terms of infrared and [CII] luminosities. Therefore, as can be seen in Extended Data Figure 3, our sources at probe a different parameter space in terms of stellar mass and IR luminosities than previous samples.
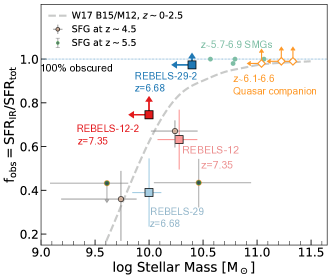
Even though uncertain, the SEDs of our sources are consistent with being lower luminosity versions of the typical dust-obscured, starburst galaxies at (Figure 2). Given the current depth of the rest-frame UV images, and of their star formation activities are obscured ( confidence lower limit). This is in stark contrast to the UV-luminous targets, REBELS-12 and REBELS-29, for which only to of star formation is obscured (see Extended Data Figure 4). This means that DSFGs need to be searched for in deeper surveys than previously assumed. The main question now is: How common are such lower-luminosity DSFGs in the early Universe? In the next section, we provide several estimates of their contribution to the cosmic SFRD.
Appendix H Contribution to the Cosmic SFR Density
The calculation of the cosmic SFRD contributed by the dusty REBELS galaxies is not trivial. In particular, because these galaxies were only discovered as neighbors to UV-luminous primary sources in our targeted follow-up program. As discussed in the main text, we derive several estimates, which are detailed below.
A somewhat naive, first estimate can be obtained, if we assume that these two sources were detected at random in a blind survey. In this case, the SFRD is simply given by their summed SFR divided by the whole survey volume spanned by the current REBELS dataset. For the survey volume, we integrate over the full frequency ranges over which we scanned for [CII] emission lines and we use the area covered by the half primary beam widths (HPBWs). This totals to a survey volume of . Then, summing the UV+IR-based SFRs of REBELS-29-2 and REBELS-12-2, we obtain . Using the [CII]-based SFRs, this amounts to . However, as indicated above, these numbers should be taken as upper limits given that REBELS is not a blind survey.
To account for clustering, we can obtain an estimate for the expected boost in number counts (and hence the SFRD) compared to a random, blind survey based on the correlation function[Peebles80]. Starting from the real-space correlation function as measured for galaxies[BaroneNugent14], we perform the Limber transform to derive the corresponding angular correlation function[Adelberger05]. This requires a redshift selection function, which we assume to be a top-hat with redshift depth of , i.e., the minimum frequency coverage of the REBELS [CII] line search. The expected number of neighbors in excess of a random field is then derived from this angular correlation function by integrating over a solid angle with radius corresponding to the HPBW (13\arcsec). Using the measured correlation function parameters cMpc and , this results in a boost factor due to clustering of 4.10.6. Hence, the SFRD estimates above need to be corrected down by this amount, resulting in or , respectively, using the UV+IR based SFRs or the [CII]-derived SFRs.
Unfortunately, the correction factor due to clustering depends quite sensitively on the assumed correlation function parameters, which themselves depend on the mass and luminosity of the sources[Qiu18]. For instance, using the simulated correlation function[Bhowmick20] for UV-luminous galaxies with (corresponding to SFRM⊙yr-1), as appropriate for the REBELS primary sample, we derive a boost factor as high as 30. However, we note that these simulations do not include such dusty sources (which have and , respectively), and we will defer the reader to a later paper to estimate an appropriate correlation function for DSFGs such as REBELS-29-2 and REBELS-12-2.
Another, more conservative SFRD estimate of dusty galaxies can be obtained from the fraction of REBELS data cubes that showed such sources, and assuming that these are representative of the cosmic average. Given the existing data from our on-going program, we currently have [CII] emission lines confirmed in 19 primary targets (at ). We performed a blind search for other lines in the current data set, but have only found REBELS-12-2 and REBELS-29-2 without optical counterparts. Hence, for 19 UV-luminous galaxies we found 2 dust-obscured counterparts with similar masses and SFRs. If we extrapolate this to the full LBG population, this would imply that such dusty sources contribute of , i.e. . Note that within the large uncertainties, this value is completely consistent with our clustering-corrected SFRDs derived above.
As a final reference, we can also derive an upper limit from the ALMA large program ASPECS, which performed a completely blind line scan over the HUDF, covering [CII] in the redshift range . This scan would have been sensitive to galaxies with [CII]-based SFRs (5 detection limit). However, no such sources were found[Uzgil21]. Using the full ASPECS survey volume, one can thus derive a limit on the total cosmic SFRD from ASPECS down to these SFRs, which results in .
All the estimates derived above, including the ASPECS blind search, lie significantly below the “Dust-Rich” model from Casey et al.[Casey2018], which assumes that dust-obscured galaxies contribute of the total SFR density at . On the other hand, our clustering-corrected estimates are in good agreement with the “Dust-Poor” model. However, we note that our sample is limited in SFR and that we needed to extrapolate to lower luminosity sources, as outlined above. At lower redshifts, the fraction of obscured star-formation decreases very rapidly, however, to lower mass and luminosity systems[Whitaker2017, Fudamoto2020]. Based on this, it would in principle not be expected that the integration to fainter systems would increase the SFRD of dust-obscured galaxies. However, as we show in (see Extended Data Figure 4), the obscured fraction of star-formation may indeed show a much larger variation than previously expected, given that earlier estimates were mostly based on UV-selected samples. Clearly, larger datasets are required to test this further in the future.
References
The authors thank Christina Williams for helpful discussions. YF and PAO acknowledge support from the Swiss National Science Foundation through the SNSF Professorship grant 190079 ‘Galaxy Build-up at Cosmic Dawn’. YF further acknowledges support from NAOJ ALMA Scientific Research Grant number 2020-16B ‘ALMA HzFINEST: High-z Far-Infrared Nebular Emission STudies’. PD, AH and GU acknowledge support from the European Research Council’s starting grant ERC StG-717001 (DELPHI). PD also acknowledges support from the NWO’s VIDI grant (“ODIN”; 016.vidi.189.162) and the European Commission’s and University of Groningen’s CO-FUND Rosalind Franklin program. LG and RS acknowledge support from the Amaldi Research Center funded by the MIUR program ”Dipartimento di Eccellenza” (CUP:B81I18001170001). HI acknowledges support from JSPS KAKENHI Grant Number JP19K23462. RS acknowledges support from an STFC Ernest Rutherford Fellowship (ST/S004831/1). M.A. has been supported by the grant “CONICYT + PCI + INSTITUTO MAX PLANCK DE ASTRONOMIA MPG190030” and “CONICYT+PCI+REDES 190194.”. The Cosmic Dawn Center (DAWN) is funded by the Danish National Research Foundation under grant No. 140.
The authors declare that they have no competing financial interests. Correspondence and requests for materials should be addressed to Y.F. (email: y.fudamoto@aoni.waseda.jp).
Y.F. wrote the main part of the text, analyzed the data, produced most of the figures. P.A.O. contributed text and led the SED fitting and data analysis. S.S. calibrated the ALMA data and produced images. M.S. performed detailed photometric measurements from the ground-based images. R.S. contributed comparison plots of different galaxy samples. All co-authors contributed to the successful execution of the ALMA program, to the scientific interpretation of the results, and helped to write up this manuscript.
The datasets generated during and/or analysed during the current study are available from the corresponding author on reasonable request. This paper makes use of the following ALMA data: ADS/JAO.ALMA #2019.1.01634.L. ALMA is a partnership of ESO (representing its member states), NSF (USA) and NINS (Japan), together with NRC (Canada), MOST and ASIAA (Taiwan), and KASI (Republic of Korea), in cooperation with the Republic of Chile. The Joint ALMA Observatory is operated by ESO, AUI/NRAO and NAOJ.
The codes used to reduce and analyse the ALMA data are publicly available. The code used to model the optical-to-infrared SEDs is accessible through github (https://github.com/ACCarnall/bagpipes).
Extended Data
| Extended Data Table 1: FIR Observed Properties (ALMA measurements) | |||||||
|---|---|---|---|---|---|---|---|
| Galaxy Name | † | † | Dust Mass∗* | ||||
| (GHz) | (km/s) | () | () | () | () | () | |
| REBELS-29 | |||||||
| REBELS-29-2 | |||||||
| REBELS-12 | |||||||
| REBELS-12-2 | |||||||
| All values are corrected for the primary beam attenuation and CMB, with and , if necessary. | |||||||
| and are measured by Gaussian fitting the extracted spectra. | |||||||
| Extended Data Table 2: Near Infrared Photometric Data | ||||||
| Band | Wavelength [Å] | REBELS-29† | REBELS-29-2† | REBELS-12†† | REBELS-12-2†† | Telescope |
| g-band | 4816.12 | Subaru/HSC | ||||
| r-band | 6234.11 | Subaru/HSC | ||||
| i-band | 7740.58 | Subaru/HSC | ||||
| z-band | 9125.20 | Subaru/HSC | ||||
| Y-band | 10214.19 | VISTA/VIRCAM | ||||
| J-band | 12534.65 | VISTA/VIRCAM | ||||
| H-band | 16453.41 | VISTA/VIRCAM | ||||
| Ks-band | 21539.88 | VISTA/VIRCAM | ||||
| 35634.28 | Spitzer/IRAC | |||||
| 45110.13 | Spitzer/IRAC | |||||
| Flux densities are shown in units of | ||||||
| Images are available as a part of the COSMOS survey[Scoville07a] and UltraVISTA DR4[McCracken12] | ||||||
| Images are available as a part of the VIDEO survey[Jarvis13] . | ||||||
| Extended Data Table 3: Priors used for panchromatic SED modeling | ||
|---|---|---|
| Assumed Physical Properties | ||
| Initial mass function | Kroupa & Boily[Kroupa02] | |
| Stellar population synthesis model | Bruzual & Charlot[Bruzual03] | |
| Dust attenuation law | Calzetti et al.[Calzetti00] | |
| Star formation history | Constant star formation | |
| Parameters | Priors | Description |
| Minimum Age | [0.1,1.0] | Time since star formation switched on in Gyr |
| Stellar Mass | [8.0,12.0] | of stellar mass in solar mass () |
| Metallicity | [0.1,2.5] | in solar metallicity () |
| [0.0,10.0] | V band dust attenuation | |
| [1.,3] | Multiplicative factor producing extra attenuation for young stars in birth clouds | |
| [-4.0,-2.0] | Starlight intensity on dust grains | |
| [1.0,25.0] | Lower limit of starlight intensity distribution | |
| [0.5,4.0] | Fraction of stars at | |
| [0.01,0.99] | PAH mass fraction | |
| All priors are uniformly distributed in the range listed in the second column. | ||
| The parameters in parentheses are used in independent runs to study the impact of different assumptions. | ||