An acrylic assembly for low temperature detectors
Abstract
Thermal detectors are a powerful instrument for the search of rare particle physics events. Inorganic crystals are classically used as thermal detectors held in supporting frames made of copper. In this work a novel approach to the operation of thermal detectors is presented, where TeO2 crystals are cooled down to in a light structure built with plastic materials. The advantages of this approach are discussed.
1 Introduction
Thermal detectors Enns (1, 2) are largely used in rare event particle physics in the search of neutrinoless double beta decay () FIORINI (3, 4) and dark matter interactions reviewDM (5). They are employed as calorimeters, thus measuring the energy released by particles, in a setup cooled down to .
One of the main experimental challenges of this technique is the capability of cooling down several crystals to extreme temperatures, maintaining them thermally stable. Detector holders characteristics are crucial to achieve satisfying performances. For this reason, copper holders have always been used for their known mechanical response at milli-Kelvin scale and high thermal conductivity. This allows to cool the material more efficiently and to provide an ideal thermal bath in which the detector discharges the absorbed energy. The CUORE experiment CUORE (6) succeeded in cooling and operating a detector made of \ceTeO_2 crystals, by building the most powerful cryostat ever made Criostato (7).
In experiments employing \ce^130Te as emitter, the largest gamma-background component comes from high-energy photons undergoing Compton scattering in passive elements of the system BackgroundBudget (8). Copper is therefore not an optimal choice from this point of view as it has a large Compton scattering cross-section, on top of being heavy and expensive when produced with high radio-purity standards.
We decided to test another material to be used as holder in the close vicinity of thermal detectors. We selected an organic compound, commercially available as Stratasys VeroClear™. It is a transparent PolyJet photopolymer for clear acrylic simulation. It is also inexpensive, light (density ) and, being organic, characterized by a low 333The effective atomic number has been computed as as in MURTY1965 (9).. These features could passively lower the background induced by Compton interaction with the holder itself, meeting the requirements of rare events physics.
From a mechanical point of view, at room temperature, the VeroClear™ is characterized by good rigidity and strength444The VeroClear™ specifics are available at https://www.stratasys.com/-/media/files/material-spec-sheets/mds_pj_veroclear_0320a.pdf., not far from the ones in copper. Conversely the acrylic has lower elasticity. These characteristics makes the polymer suitable to build structural frames. If copper properties are well known at cryogenic temperatures, VeroClear™ has to be tested in such extreme conditions.
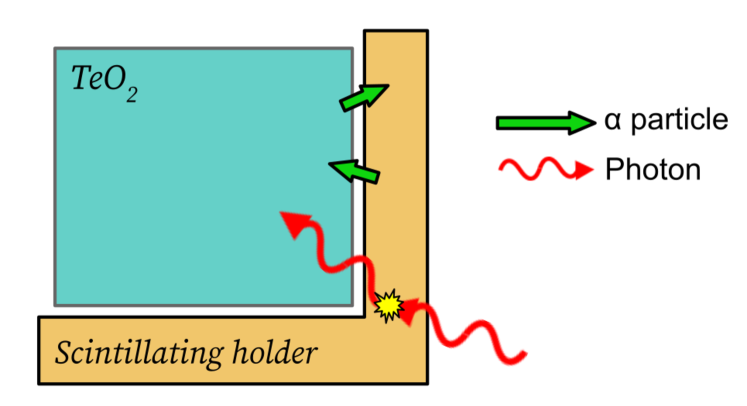
VeroClear™ was born to simulate the optical properties of polymethyl methacrylate (PMMA), largely used as base for many organic scintillators PMMAScintillator (10). This opens the possibility to activate a component of the setup which is passive in classical designs. An active holder would veto its own surface contamination and part of the crystals one, together with the component that Compton scatters with the holder itself (See Figure 2).
The main difference of VeroClear™ with respect to PMMA is the possibility to be 3D printed, a useful opportunity for building structures with complex geometries, if required. Right now, we are not yet considering the impact of such a build-up technique from the point of view of induced contamination.
However, there is poor literature about properties of acrylic and, more generally, organic compounds, at the milli-Kelvin scale, even if some can still be found Ventura (11). We don’t know how the VeroClear™ characteristics, such as low thermal conductance and large heat capacity, would modify the cool-down as well as the detector response’s shape and performance. For these reasons, an initial proof of principle is of primary importance. It is essential to check detector behaviour at cryogenic temperature, to be compared to the one coming from copper holders.
2 Experimental Setup
The measurements have been performed using \ceTeO_2 crystals. They have been operated in a cryogenic facility located at Milano - Bicocca University (Italy). The crystals were equipped with Neutron Transmutation Doped \ceGe (NTD) employed as thermistors Haller (12). The NTDs were mechanically and thermally coupled to the crystals with six spots of epoxy glue. The NTD consists of a \ceGe chip with a doping level slightly below the Mott transition MottTransition (13). Since the NTDs are naturally well-compensated semiconductors (the uniformly-distributed dopants are both donors and acceptors), the \ceGe lattice electrons behavior can be well described by the Shklovskii’s and Efros’ Variable Range Hopping (VRH) model VariableRangeHopping (14). In this regime, the NTD’s conductivity strongly depends on the temperature . It can be shown that the resistance can be written as:
| (1) |
The employed NTDs had already been characterized ArticoloSimone (15) and their parameters, and , were respectively evaluated as and . A biasing and read-out circuit provided the polarization current to the thermistors, using either or load resistors, depending on the NTD’s resistance value at the chosen working point. The latter is defined by the position in the NTD’s I-V curve, usually referred as load curve. The working point mainly determines the signal-to-noise ratio and the pulse shape of the detector.
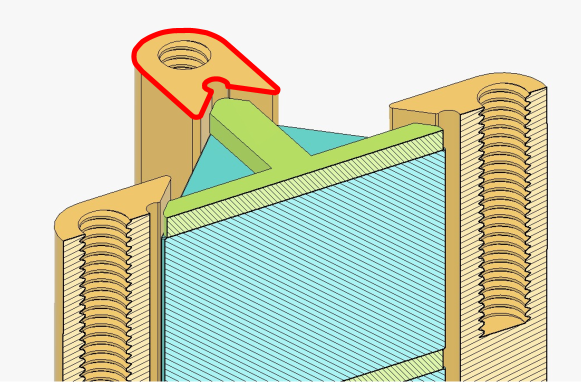
Two similar holding structures have been built for our purposes. One is the acrylic tower, composed of a thick base and four columns which accommodate three \ceTeO_2 stacked crystals. To reduce the risk of damage to the detectors, due to the distinct differential contractions of acrylic and \ceTeO_2, the holder was designed to minimize stresses while maintaining the needed stiffness. This has been accomplished by shaping the VeroClear™ columns as in Figure 2. The holder fits the crystals’ faces so to avoid vibration but leaving a mechanical unloading at the edges. Moreover, on top of the crystal stack, some space has been left to account for contractions at cryogenic temperatures. Lastly, thick VeroClear™ spacers were interposed between crystals mainly to avoid thermal cross-talk among detectors. The VeroClear™ holder and spacers have been produced through a Stratasys ObjetPRO machine, a 3D-Printer working by means of polyjet technology which guarantees high accuracy (order of hundredths of a mm) and quality of the parts produced through a process of instant cure by UV light of photosensitive resins (such as VeroClear™). Soluble support material (Stratasys SUP706-B™) was used for the construction of these parts, in order to optimize the cleaning and consequently the surface finishing. The printed substrates can be also treated for a few hours inside a lighting chamber equipped with fluorescent lamps, selected both in power and color temperature, in order to improve the final transparency. The production took place at INFN Rome mechanical workshop, exploiting the HAMMER555For more information consult https://hammer.lngs.infn.it/. facilities (Hub for Additive Manufacturing Materials Engineering and Research) instituted by INFN.
The second holder, made of copper, includes a thick base, columns and a thin plate. It can house two crystals glued, by means of Araldite® Rapid glue spots, on the base and on the plate.
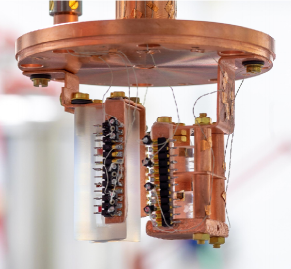
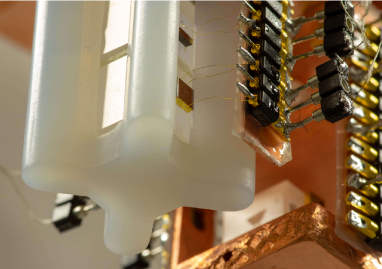
Both the towers were hosted in an Oxford TL-200 \ce^3He-\ce^4He dilution refrigerator. Each holder was fixed through brass screws to a copper S-shaped strip, in turn thermally coupled to a copper plate. The latter is directly connected to the cold finger and the mixing chamber. The cryostat operating temperature was maintained at and the heat bath was monitored through a MAGNICON MFFT SQUID thermometer, positioned under the mixing chamber, and thermally linked to the same copper plate the detectors were connected to. The entire detector setup is shown in fig. 3. The NTDs readout was performed through gold wires ball-bonded to the \ceGe thermistors and soldered to metallic pins on the other side. In the case of acrylic holder, these gold wires provided the detector main thermal coupling, as demonstrated in ArticoloSimone (15). The electric signal was carried out of the cryostat through twisted constantan wires, lastly reaching a Faraday cage where it underwent amplification and anti-aliasing Bessel filtering. Eventually, the detector signal was digitized and stored using two ADC boards.
A 2 cm thick Cu layer surrounded the setup to reduce the environmental radiation reaching the two towers, together with a thick Pb disk on top of the cold plate. A \ce^232Th source was employed to calibrate the energy scale and was put under the cryostat during calibration runs.
3 Data analysis
When a particle passes through the \ceTeO_2 crystals, it releases energy and, consequently, the detector temperature raises. This variation is detected through the NTD, operated as a thermometer.
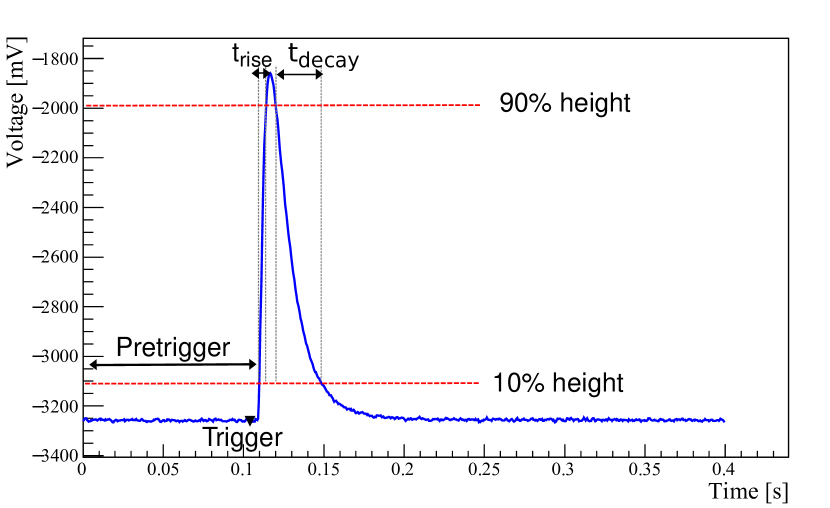
The NTDs output was digitized and stored as a continuous waveform. During the data-taking, a derivative trigger flagged events from the continuous stream. The selected pulses were stored as windows of length (Figure 5). The pulse window contains a pre-trigger region used to extract information about the specific event baseline. Moreover, noise windows were sampled randomly. They have been used later to construct a noise power spectrum for each channel, run by run.
The first part of the offline analysis identified periods of time in which the detectors were misbehaving. The check was done by looking for intervals with unstable baseline or high baseline RMS. These “bad intervals” were excluded from the subsequent analysis steps. For each channel the average pulse (AP) and the average noise power spectrum (ANPS) have been computed. They were used to evaluate the pulse amplitude with the Optimum Filter technique OptimumFilter (16), which allows to maximize the signal-to-noise ratio.
Since the thermal gain depends on temperature, it was essential to correct the detector response compensating for temperature variations among events. For this reason, we applied a thermal gain stabilization by using the detector baseline level, that is the pretrigger average baseline, as a temperature proxy. The temperature dependence of the gain was corrected by correlating the amplitude of pulses belonging to a peak of known energy ( from \ce^208Tl) to the baseline level ThermalStabilization (17).
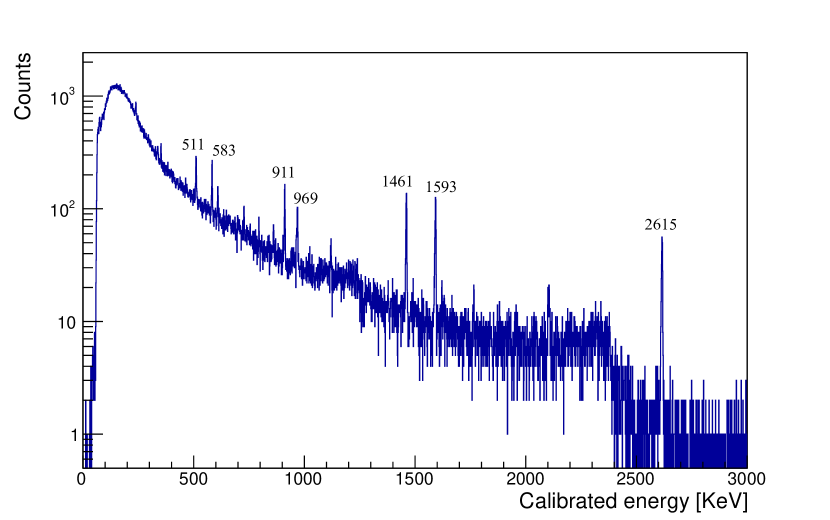
The spectrum was calibrated using recognizable peaks, mainly coming from the \ce^232Th calibration source. These lines have been fitted using a Gaussian function added to a linear background. For the calibrating function a order polynomial with intercept at zero has been employed. An example of the obtained energy spectra is reported in fig. 5.
All considered, we analyzed one reference channel in the copper assembly (here named channel 1) and channels from the acrylic tower (channel 2 and channel 3).
4 Results
During the cool-down some high-statistics calibration runs were collected. They all lasted more than and they contain a total of physical pulses each. Before the data acquisition, test runs were needed to optimize NTDs’ working point and trigger parameters.
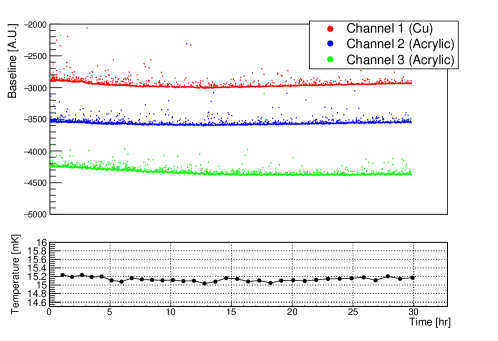
The first obtained result is related to the detector stability over time. Acrylic is amorphous and it has low thermal conductance. The disordered molecule structure could in principle relax and, unpredictably, release energy, acting as a residual heat load on the holder. Therefore, the presence of acrylic could induce temperature shifts on long time scales or fast and large spikes. The latter, in contrast to the usual temperature variations, could not be corrected with the stabilization described in the previous chapter. However, the acrylic setup baseline level, proxy for the crystals temperature in the holder, was as stable as the one in the copper holder for very long times. The stability has been checked for all channels and all acquired runs. An example is shown in fig. 6.
Since crystal holders have also structural roles, another important result concerns acrylic mechanical properties. The plastic holder had already undergone many cool-down cycles from room temperature to and few cycles from room temperature to . After each group of tests it was examined carefully at the microscope and no cracks or visible defects were found. No spurious thermal noise of the type registered in CRESST CRESST (18) was observed during data taking, nor cracks on the crystals after warm-up.
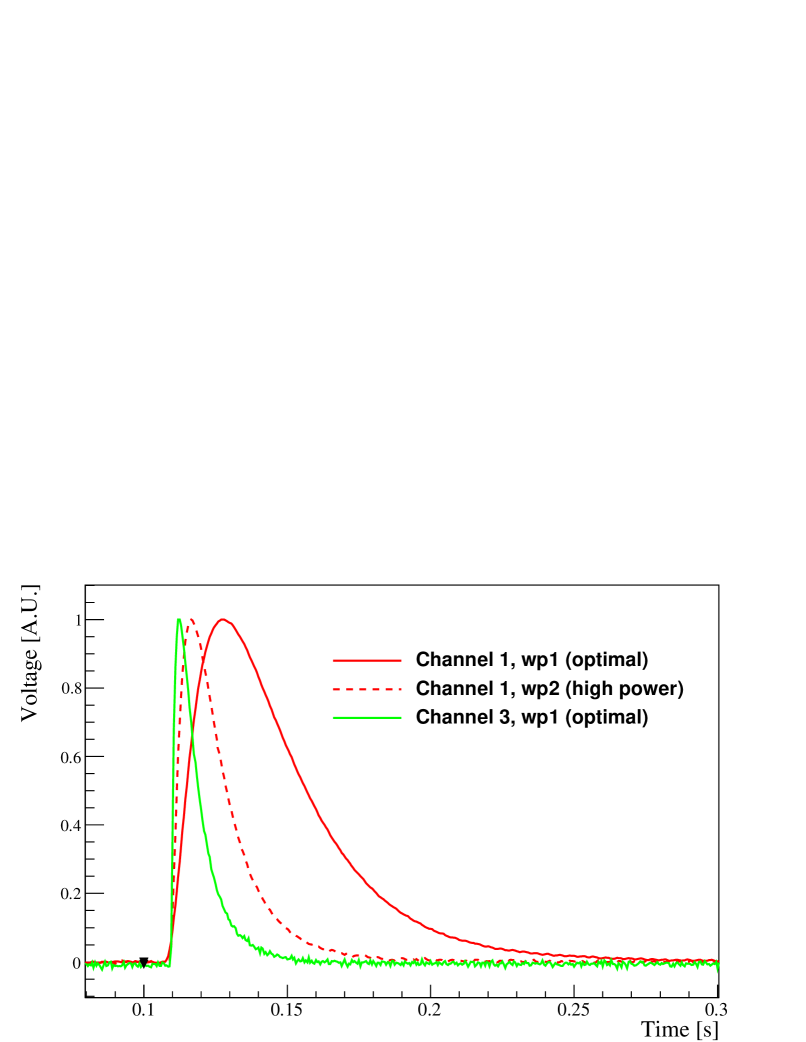
We expected the different conductivity of the holding material ArticoloSimone (15) to influence pulse formation. Indeed, at their respective optimal working points (wp1) the signals from channel in the acrylic holder are faster than those from channel (Cu tower). The effect can be qualitatively appreciated by comparing the pulse shapes plotted in fig. 8. This can be explained by the weaker thermal coupling provided by the acrylic, leading to an higher crystals operating temperature of (with smaller working resistances resulting in smaller intrinsic gain but faster time response). Conversely, the detectors in the copper tower were at the cryostat temperature, that was . Since fast pulses could be useful to reduce pile-up whenever this background is an issue (as in the proposed CUPID experiment CUPIDpileup (19, 20)), this acrylic holder additive feature is very promising. To achieve similarly fast pulses on standard Cu frames, the NTDs can be warmed up by increasing the bias current. This approach was applied to channel by operating it at a different working point (wp2), dissipating through the bias circuit666In the case of wp1 the dissipated power is negligible, in the order of .. The dissipated power was such that the pulses duration were shortened but the resolution (and the pulse shape) didn’t suffered the non optimal working point yet. We characterize the signals by means of their rise and decay time, defined as the time elapsed for a pulse from to of its amplitude and vice versa. The obtained average values are reported in table 1, together with their working resistances . Using these results, the pile-up probability, modelled as a Poissonian distribution, would be lower in acrylic holder channels by a factor , when the NTDs are operated at their optimal working point.
| Holder material | Channel | Working point | Rise time [] | Decay time [] | NTD |
|---|---|---|---|---|---|
| Copper | 1 | wp1 | |||
| Acrylic | 2 | wp1 | |||
| Acrylic | 3 | wp1 | |||
| Copper | 1 | wp2 |
Besides these thermal considerations, the pulse shape of the detectors housed in the acrylic holder is not further modified. This fact allowed to process events from the two setups with the same algorithms without adapting or tuning the employed software.
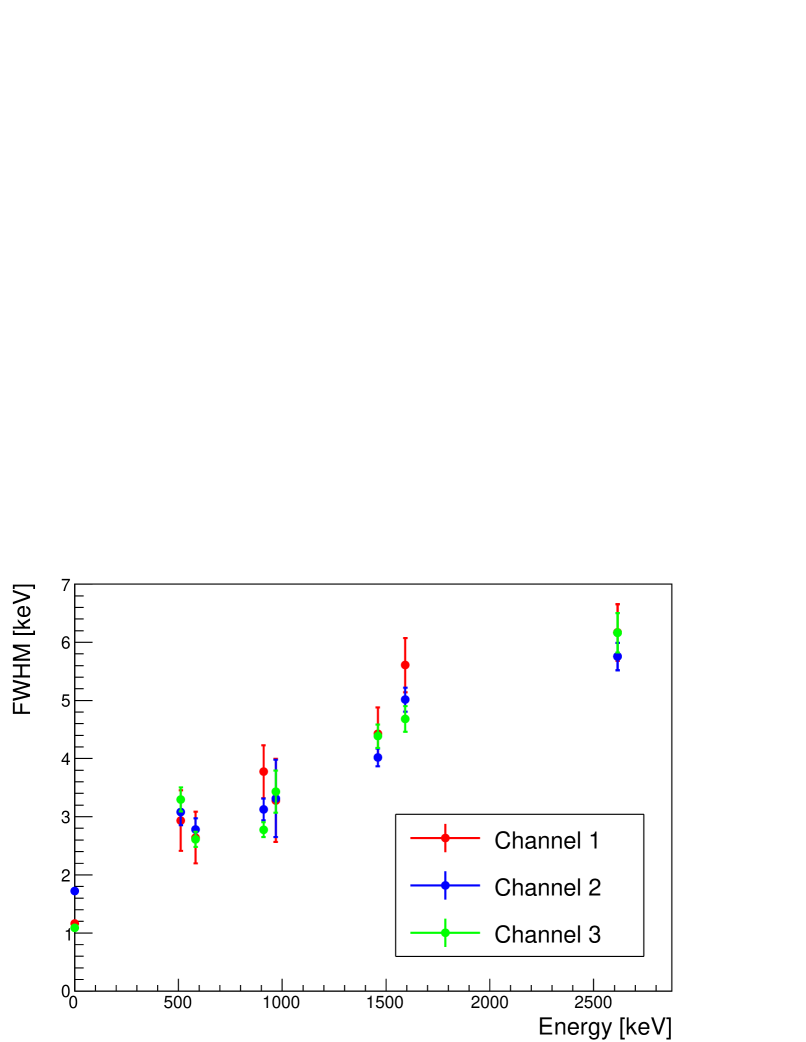
An important parameter used to assess the detector performance is the FWHM energy resolution. The most prominent calibration spectrum peaks, whose energies are reported in fig. 5, have been fitted with a Gaussian function plus a linear background at the end of the calibration step. A zero-energy FWHM, corresponding to the baseline resolution, has been computed taking into account the baseline distribution spread evaluated after filtering. The obtained resolution-energy plot is shown in fig. 8. The resolution is dominated, at low energies, by the baseline noise. Then, it grows monotonically, following the typical low temperature calorimeters trend. The FWHM resolutions of baseline and of the highest energy peak of the calibration are reported in table 2, where channel 1 is operated at wp2 and channel 2 and 3 at wp1.
| Channel | Holder material | FWHM baseline [] | FWHM [] |
|---|---|---|---|
| Copper | |||
| Acrylic | |||
| Acrylic |
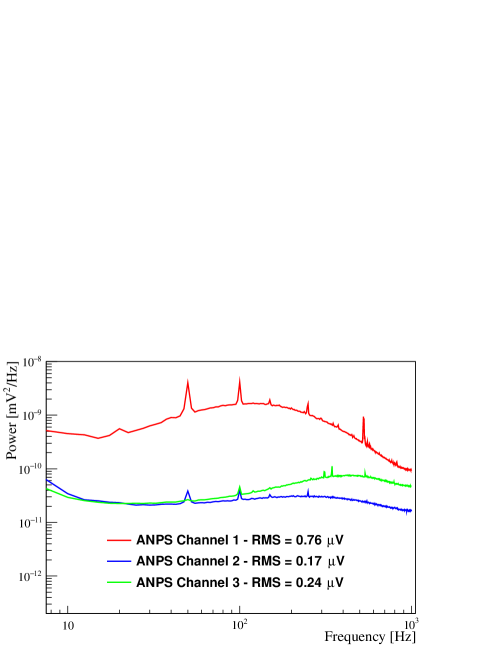
We also compared the noise registered on the different channels by computing, run by run, their ANPS and normalizing for the electronic gain. As can be seen from fig. 9, the noise belonging to channels in the acrylic tower doesn’t show problematic features when operated at the optimal working points. As already pointed out, the crystals in the acrylic work at slightly higher temperatures, that is at lower . As a check, the Johnson contribution to the continuum is confirmed to be lower.
5 Conclusions and Comments
Neutrinoless double beta decay searches, decade after decade, improve the limits on the half-life for different emitting isotopes. Future experiments will ask for more demanding material radio-purity, background rejection capability, and better energy resolutions. For this reason, acting on structures close to the detectors will be essential to fulfill the desired requirements. In the field of low temperature detectors, copper has always been employed for the construction of the crystal holding structures. However, copper is expensive and its Compton scattering cross-section can cause significant background for experiments using \ce^130Te as target isotope. A novel approach would consist in using holding structures made of light organic compounds, which would reduce both the cost and the impact on the measured background.
In our experimental setup, VeroClear™ has shown good mechanical characteristics and thermal coupling with our crystals down to the milli-Kelvin scale. Since it can be 3D printed, even complicated structures can be realised with a low number of components, simplifying the assembly. From a mechanical point of view, it would be possible to scale our test holder to real experiments dimension. A VeroClear™ holder would bear the CUORE detector strings, while maintaining the same frame volume employed in the experiment (with great margin, thus leaving room for further optimization). There are already examples of acrylic laminates produced with low \ce^238U and \ce^232Th contamination, at levels comparable to the CUORE cleanest copper. Therefore, the bulk contamination introduced by the detectors’ holder would gain a factor at least 7.5 (density ratio), passively lowering the induced background.
We demonstrated that the material replacement doesn’t compromise the detector working properties (resolution, stability, etc.). The detectors housed in the plastic tower are as stable as the ones framed in copper for long times. In addition, their equilibrium temperature is only a few higher than in the copper case. As a consequence, the pulses are faster, allowing to reduce the background induced by pile-up in searches with isotopes characterized by shorter half-life CUPIDpileup (19, 20). The acrylic holder doesn’t cause any deterioration in the energy resolution and in the noise power spectrum. Since the acrylic frame is characterized by low conductance, thermalization issues cannot be excluded, especially when the detector strings become longer. These kind of tests are required to check where such effects are negligible and where they become a severe issue.
A first hint of a real reduction of the Compton background events has been obtained and validated by Monte Carlo simulations and it is discussed in a specific paper ArticoloSIF (21). We will therefore further proceed in this direction in the near future, studying the VeroClear™ scintillation light properties at the milli-Kelvin scale, together with the associated readout. These tests will be critical to evaluate the feasibility of an “active” acrylic holder, useful to reach a further background rejection mainly tagging and suppressing induced events and rejecting radiation coming from the components close to the detectors. These additional features will be essential for future-generation experiments, expected to operate close to the background-free regime.
Acknowledgments
We thank Marco Iannone from INFN - Section of Roma1 and member of the Hammer project for helping with the production and preparation of the 3D printed components of the assembly.
References
- (1) C. Enss Springer, Berlin, Heidelberg, 2005 DOI: 10.1007/b12169
- (2) S. Pirro and P. Mauskopf In Annu Rev Nucl Part S 67.1, 2017, pp. 161–181 DOI: 10.1146/annurev-nucl-101916-123130
- (3) E. Fiorini and T.O. Niinikoski In Nucl Instrum Methods 224.1, 1984, pp. 83–88 DOI: 10.1016/0167-5087(84)90449-6
- (4) M. Biassoni and O. Cremonesi In Prog Part Nucl Phys 114, 2020, pp. 103803 DOI: 10.1016/j.ppnp.2020.103803
- (5) T.. Undagoitia and L. Rauch In J Phys G Nucl Partic 43.1 IOP Publishing, 2015, pp. 013001 DOI: 10.1088/0954-3899/43/1/013001
- (6) D.. Artusa et al. In Adv High Energy Phys 2015 Hindawi Limited, 2015, pp. 1–13 DOI: 10.1155/2015/879871
- (7) C. Alduino et al. In Cryogenics 102 Elsevier, 2019, pp. 9–21 DOI: 10.1016/j.cryogenics.2019.06.011
- (8) C. Alduino In Eur Phys J C 77.8, 2017, pp. 543 DOI: 10.1140/epjc/s10052-017-5080-6
- (9) R.. Murty In Nature 207.4995, 1965, pp. 398–399 DOI: 10.1038/207398a0
- (10) V.. Salimgareeva In Instrum Exp Tech+ 48.3, 2005, pp. 273–282 DOI: 10.1007/s10786-005-0052-8
- (11) G. Ventura and M. Perfetti Springer, 2014 DOI: 10.1007/978-94-017-8969-1
- (12) EE Haller In Infrared Phys Techn 35.2-3 Elsevier, 1994, pp. 127–146 DOI: 10.1016/1350-4495(94)90074-4
- (13) N.F. Mott In Philos Mag 19.160 Taylor & Francis, 1969, pp. 835–852 DOI: 10.1080/14786436908216338
- (14) A.. Efros and B.. Shklovskii In J Phys C Solid State 8.4 IOP Publishing, 1975, pp. L49–L51 DOI: 10.1088/0022-3719/8/4/003
- (15) S. Quitadamo “A thermal model for low temperature \ceTeO_2 calorimeters” Submitted in J Low Temp Phys
- (16) E. Gatti and P.. Manfredi In Riv Nuovo Cimento 9.1, 1986, pp. 1–146 DOI: 10.1007/BF02822156
- (17) A Alessandrello et al. In Nucl Instrum Meth A 412.2, 1998, pp. 454–464 DOI: https://doi.org/10.1016/S0168-9002(98)00458-6
- (18) J. Åström et al. In Phys Lett A 356.4, 2006, pp. 262–266 DOI: 10.1016/j.physleta.2006.03.059
- (19) J.W. Beeman et al. In Phys Lett B 710.2 Elsevier, 2012, pp. 318–323 DOI: 10.1016/j.physletb.2012.03.009
- (20) D.. Chernyak et al. In Eur Phys J C 72 Springer ScienceBusiness Media LLC, 2012 DOI: 10.1140/epjc/s10052-012-1989-y
- (21) S. Ghislandi “Organic compounds for rare events physics” In Nuovo Cimento C 44, 2021 DOI: 10.1393/ncc/i2021-21093-6