11email: tullia.sbarrato@inaf.it 22institutetext: INAF–Istituto di Radioastronomia, via P. Gobetti 101, 40129 Bologna, Italy 33institutetext: University of Bologna, Department of Physics and Astronomy, via P. Gobetti 93, 40129 Bologna, Italy
Jetted radio-quiet quasars at z¿5
We report on the JVLA observations of three high-redshift active galactic nuclei (AGNs) that have black hole masses estimated to be among the largest known. Two of them, SDSS J0100+2802 and SDSS J0306+1853 at redshift 6.326 and 5.363, respectively, are radio-quiet AGNs according to the classic definition, while the third (B2 1023+25 at ) is a powerful blazar. The JVLA data clearly show a radio structure in the first source and a radio emission with a relatively steep radio spectrum in the second one, indicating the presence of a radio jet and a diffuse component. Therefore, being radio-quiet does not exclude the presence of a powerful relativistic jet, which has important consequences on population studies and on the ratio between jetted and non-jetted AGNs. We can estimate the viewing angle of these jets, and this allows us to find, albeit with some uncertainty, the density of black holes with a mass in excess of at high redshifts. We found that their density in jetted AGNs is very large in the redshift bin 5–6 and comparable with the overall AGN population of the same optical luminosity. Jets might thus play a crucial role in the fast formation and evolution of the most massive black holes in the early Universe. They are more common than what is expected from wide radio surveys with milliJansky flux sensitivity. Deeper JVLA or very-long-baseline interferometry observations are key to discovering a possible relativistic jet population hiding in plain sight at very high redshift. The discovery of powerful relativistic jets associated with the most massive black holes in the early Universe revives the question: is the jet instrumental for a rapid growth of the black hole or, instead, is the black hole mass the main driver for the jet formation?
Key Words.:
quasars: general – galaxies: jets – galaxies: nuclei – galaxies: active – accretion1 Introduction
The number of known quasars at redshifts larger than 5 has been dramatically increasing in the last few years, following their first discovery more than 20 years ago (Fan et al., 1999). Currently, sources have been discovered. The few for which a virial-based black hole mass has been derived host supermassive black holes (SMBHs) with . At such high redshift, host galaxies show intense star forming activity, with star formation rates of (Decarli et al., 2018; Shao et al., 2019), suggesting that in that phase black holes outgrow their host galaxies (Venemans et al., 2016; Neeleman et al., 2021).
The formation and life cycle of early active SMBHs have been long-standing puzzles since their first observations (see the reviews by Volonteri, 2012; Inayoshi et al., 2020, and references therein). The expected Eddington-limited accretion through an -disc (Shakura & Sunyaev, 1973; Novikov & Thorne, 1973) would imply a seed black hole of more than . To form such a massive seed, direct collapse from a massive gas cloud would be needed, which would likely cool and fragment before collapsing into a compact object. Assembling black holes from more realistically expected seeds of instead would imply breaking the Eddington limit. Both solutions are strongly affected by issues and difficulties. Finding and studying more and more massive quasars at will keep challenging the current formation models, but it will also allow us to dig deeper into this subject.
Among these massive sources, some are particularly interesting: SDSS J010013.02+280225.8 (hereafter SDSS J0100+2802) and SDSS J030642.51+185315.8 (SDSS J0306+1853) are the only two known quasars with masses larger than at redshifts higher than 5. Specifically, SDSS J0100+2802 is at redshift , and its mass is (Wu et al., 2015), while J0306+1853 is at with a mass of (Wu et al., 2015; Wang et al., 2015). They are definitely the most challenging objects: how is it possible to build such massive black holes in less than Gyr (i.e. the age of the Universe at )?
SDSS J0100+2802 was selected by Wu et al. (2015) as a high-redshift quasar candidate from a photometric cross-matched sample of the Sloan Digital Sky Survey (SDSS; York et al., 2000), the Two Micron All-Sky Survey (2MASS; Skrutskie et al., 2006), and the Wide-Field Infrared Survey Explorer (WISE; Wright et al., 2010) because of its red optical colours and bright IR detection. Spectroscopic confirmation was obtained with the Lijiang 2.4 m telescope, the Multiple Mirror Telescope (MMT), and the Large Binocular Telescope (LBT). The optical–near-IR spectrum obtained with LBT, Magellan, and Gemini shows CIV and MgII lines. The latter allowed Wu and collaborators to obtain a virial-based black hole mass estimate for this source. Fujimoto et al. (2020) suggest that SDSS J0100+2802 is likely gravitationally lensed with a magnification factor of . On the basis of the Ly-transparent proximity zone, Davies et al. (2020) rule out magnifications of at 95% and of conclusively. Finally, Pacucci & Loeb (2020) performed a consistency check on the magnification results with the quasar luminosity function, finding that if J0100+2802 is magnified, then all quasars in SDSS should be as well.
SDSS J0306+1853 was selected by Wang et al. (2015) as a high-redshift quasar candidate based on SDSS and WISE photometric data because of its red colour and IR brightness. Spectroscopic confirmation was obtained with the Lijiang 2.4 m telescope. The optical–near-IR spectrum obtained with the Magellan telescope shows CIV and MgII lines. Wang and collaborators derived virial-based black hole mass estimates from both emission lines.
Relativistic jets have been suggested to play a role in such fast formation and accretion (Jolley & Kuncic, 2008; Ghisellini et al., 2013; Regan et al., 2019). Feedback from the jet is also largely regarded as crucial in regulating the common evolution of black holes and their host galaxies. The presence of a relativistic jet is generally associated with strong radio emission, and the radio-loud fraction in a quasar population is commonly used to trace the occurrence of jetted sources. The radio-loud fraction in quasars seems consistent with or lower than the same value in the local Universe (Liu et al., 2021). However, when aligned sources are considered to trace the jetted population (i.e. when blazars classified through high-energy properties are used as proxies for all jetted sources), the jetted fraction significantly increases at (Ghisellini et al., 2010; Sbarrato et al., 2015; Sbarrato, 2021). Therefore, either we are losing misaligned sources in radio and/or optical catalogues or we are misclassifying a fraction of blazars (Cao et al., 2017). It is already well known that the cosmic microwave background (CMB) efficiently quenches extended radio emission, resulting in a deficit of observed misaligned jetted sources (Bassett et al., 2004; Ghisellini et al., 2014a, 2015; Napier et al., 2020). An over-obscuration of quasar nuclei could also play a role in our inability to find and classify the misaligned population (Ghisellini & Sbarrato, 2016; Fan et al., 2020). Jets, in fact, might be able to pierce the surrounding dust, making aligned jetted quasars more likely to be visible in optical light111 In this case, non-jetted quasars would be underestimated as well, complicating the picture.. For this reason, the radio-loud fraction alone should not be used as a reliable proxy for the number of jetted sources. A thorough study of broadband properties is needed to derive the presence of a jet at high redshift.
Although the jet might help the SMBH to accrete more and faster, in the literature there is no observational signature of jet presence in SDSS J0100+2802 or SDSS J0306+1853. Neither of these two objects is in fact included in any large radio catalogue, such as the Faint Images of the Radio Sky at Twenty Centimeters (FIRST; Becker et al., 1994) or the NRAO VLA Sky Survey (NVSS; Condon et al., 1998). Wang et al. (2016, 2017) observed SDSS J0100+2802 radio continuum and line emissions with the Very Large Array (VLA) and the Very Long Baseline Array (VLBA), concluding that it cannot be due only to star formation activity; however, they did not infer the presence of a jet. Since the extended emission of these two sources is likely quenched by the CMB, though, we chose to rely on observations with a microJansky flux limit and search with a deeper sensitivity. In the following sections, we present the observations we performed on these two sources with the JVLA.
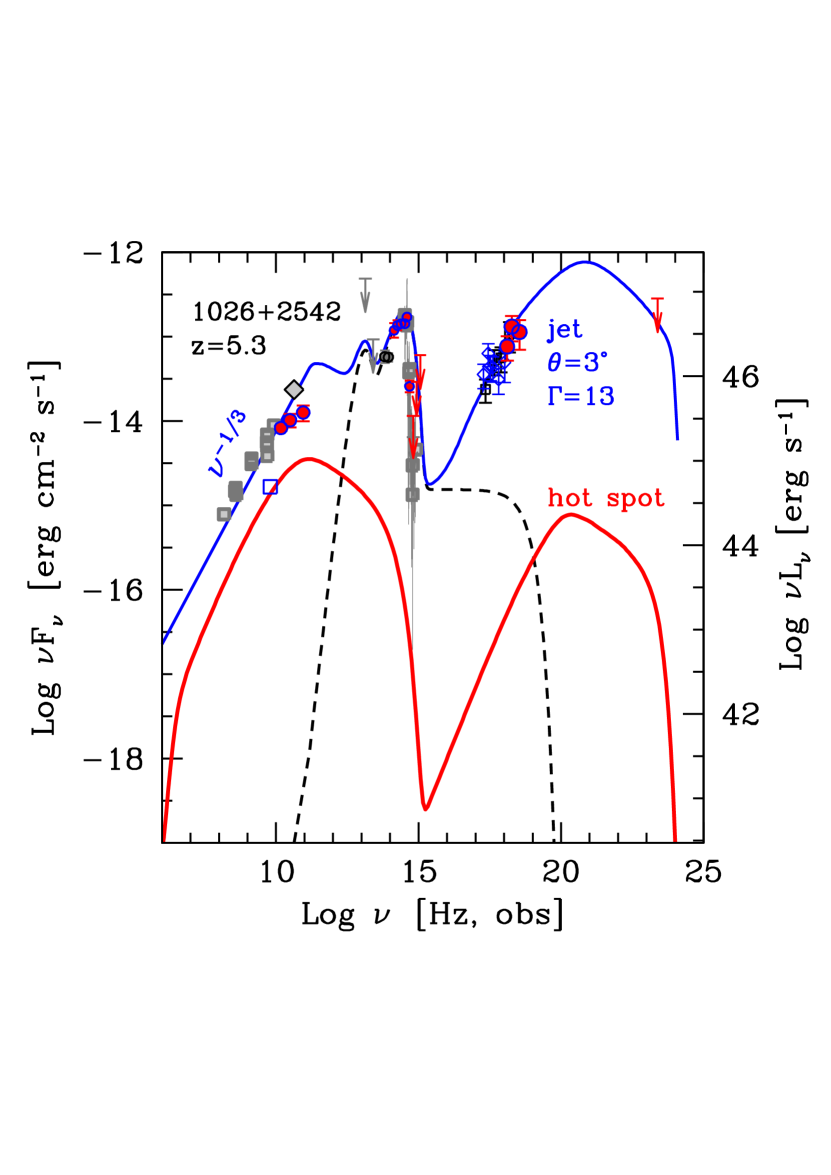
Along with these two extreme sources (in terms of their mass and luminosity), we also performed observations on a known high-, jetted source with its jet aligned to our line of sight: SDSS J102623.61+254259.5 (hereafter B2 1023+25, ). We aimed at comparing known extremely massive jetted sources in the same redshift bin. Unfortunately, no blazar has yet been detected at ; therefore, we chose a very well-studied source with the largest mass possible. This source was selected as a potential blazar candidate from the SDSS spectroscopic sample cross-correlated with FIRST because of its strong radio flux (mJy) and extreme radio-loudness (Sbarrato et al., 2013a). Sbarrato et al. (2012) observed it in the X-rays and managed to classify it as a blazar thanks to its strong and hard X-ray flux. This classification was further confirmed thanks to the Nuclear Spectroscopic Telescope Array (NuSTAR; Sbarrato et al., 2013b) and very-long-baseline interferometry (VLBI) observations. The latter also allowed Frey et al. (2015) to observe the first jet proper motion at . B2 1023+25 has no single-epoch virial-based mass estimates, but its mass falls in the range, according to spectral energy distribution (SED) fitting.
In this paper we present our study on the jet and accretion features of the three sources, with the aim of studying the evolution of the most massive sources in the early Universe. Section 2 presents the JVLA radio observations of the three sources. Section 3 shows the comparison of the available IR-optical-UV data with different accretion disc emission models in order to assess the masses and accretion regimes of the sources. Section 4 discusses the broadband SED modelling, aimed at understanding the presence and features of relativistic jets. Section 5 discusses the implication of our findings in the picture of quasar distribution and evolution in the early Universe, and Sect. 6 presents our conclusions.
In this work we adopt a flat cosmology with km s-1 Mpc-1 and . The radio spectral index is defined such that the flux density is proportional to .
2 Radio observations


2.1 Data reduction
Notes. Column 1: source name; Col. 2: measured redshift; Col. 3: angular to linear scale conversion factor; Col. 4: luminosity distance; Cols. 5 and 6: observing frequency and angular resolution; Col. 7: measured noise level in images; Col. 8: nuclear component flux density, the peak of a Gaussian fit; Col. 9: nuclear radio power (logarithm), no K-correction applied; Col. 10: total flux density; Col. 11: total radio power (logarithm), no K-correction applied; Col. 12: source size in our images.
| Name | z | kpc/” | Dl | Freq | HPBW | noise | Sc | Log Pc | St | LogPt | size |
|---|---|---|---|---|---|---|---|---|---|---|---|
| Mpc | GHz | ” | mJy/beam | mJy | [W/Hz] | mJy | [W/Hz] | ” | |||
| J0100+2802 | 6.326 | 5.556 | 61073 | 1.5 | 5 | 0.012 | 0.0620.012 | 25.45 | 0.1540.012 | 25.84 | 13 |
| 5.0 | 7 | 0.005 | 0.0910.005 | 25.61 | 0.1130.005 | 25.70 | 13 | ||||
| J0306+1853 | 5.363 | 6.062 | 50628 | 1.5 | 4 | 0.013 | 0.2520.014 | 25.89 | 0.2520.014 | 25.89 | ¡3 |
| 5.0 | 4 | 0.0045 | 0.0880.005 | 25.43 | 0.0880.005 | 25.43 | ¡3 | ||||
| B2 1023+25 | 5.284 | 6.109 | 49756 | 1.5 | 0.9 | 0.09 | 209.54.1 | 28.79 | 209.54.1 | 28.79 | ¡0.3 |
| 5.5 | 1.0 | 0.013 | 112.32.2 | 28.52 | 112.32.2 | 28.52 | ¡0.3 |
2.1.1 SDSS J0100+2802
We observed this source with the JVLA in the L band (20cm) and the C band (6cm). Observations in the L band were in B configuration, with a total bandwidth of 1 GHz (from 1 to 2 GHz). The source was observed in seven scheduling blocks (SBs), each 45 minutes long, in the period May–August 2016. Observations in the C band were in C configuration, with a total bandwidth of 2 GHz (from 4.5 to 6.5 GHz). The source was observed in two 40-minute-long SBs on January 31, 2016. At both frequencies the flux density and bandpass calibrator was 3C 48, and J0119+3210 was the phase calibrator. 3C 48 was observed once in each SB, and the phase calibrator was observed two or three times.
Data reduction was done using the AIPS package, applying the standard technique suggested by the AIPS cookbook. A large fraction of data (about 15%) in the L band were flagged because of strong interferences; in particular, the first SB was not used because of the strong interferences that also affected calibrator sources. In the C band, only about 5% of data suffered this problem. Each SB was calibrated separately. No self-calibration was possible in the C band because of the too-low flux density of sources in the field; in the L band we did two cycles of phase-only self-calibration, exploiting a few moderately bright radio sources present in the large L-band primary beam. Images from calibrated data were obtained using the AIPS package for each SB.
At the end, we combined all the data at each frequency to obtain the final images. Because of the good quality of the data and the low noise level in the L-band images, it was necessary to map a large field and a few additional outer, smaller fields, using the AIPS task IMAGR to clean many distant sources whose sidelobes were present in the central image region. In C-band observations, a single field of 1024 x 1024 pixels was enough to obtain a high quality image. In Table 1 we report the image and source parameters. The noise level in all images was estimated using the AIPS task IMEAN in a large area near the map centre with no visible radio sources. The core flux density is the peak of a Gaussian fit of the inner region (AIPS task JMFIT). The flux density of the extended jet feature was computed within the region visible in Fig. 1 using the AIPS task TVSTAT; the total flux is the sum of the extended and nuclear emission.
2.1.2 SDSS J0306+1853
Observations were carried out as for the previous source and during the same time range in the L band, as well as on February 2 and 3, 2016, in the C band. The gain and bandpass calibrator was 3C 48, and J0319+1901 was the phase calibrator. The data calibration and reduction was similar, and the problems were the same as for the previous source. The source is unresolved in our images. Results in Table 1 have been obtained with a Gaussian fit.
2.1.3 B2 1023+25
We observed this source in the L and C bands. In the L band we observed in A configuration, with a total bandwidth of 1 GHz (from 1 to 2 GHz), for 30 minutes on April 12, 2014. The observation in the C band was in B configuration, with a total bandwidth of 2 GHz (from 4.5 to 6.5 GHz). The source was observed for 30 minutes on October 24, 2013. At both frequencies the gain and bandpass calibrator was 3C 286, and J1013+2649 was the phase calibrator. The data were self-calibrated in phase and amplitude. The source is unresolved in our images. Results in Table 1 have been obtained with a Gaussian fit.
2.2 Results in radio band
J0100+2802 shows, in images in the L and C band, a dominant nuclear emission with a faint jet-like emission in the northern direction. In the L-band image the structure has a surface brightness at the level; however, the same structure is visible in the C-band image (see Fig. 1) at a more than level. Therefore, we conclude that it is a real one-sided jet emission. Its length is arcsec, which corresponds to kpc. The core is self-absorbed (), and the jet-like structure shows a steep spectrum with (Table 1).
At about 10” west of the core, we note a faint, slightly resolved emission present in images at 1.5 and 5 GHz. Its spectrum is steep; we investigated a possible optical identification of this source, but no optical emission is present in this region. It could be diffuse emission related to our target source or an unrelated emission on the line of sight. Deeper radio and optical data are necessary to investigate this emission.
SDSS J0100+2802 was observed with the JVLA at 3 GHz (Wang et al., 2016) and with the VLBA at 1.5 GHz (Wang et al., 2017). The reported JVLA total flux density is , lower than our flux density at 5 GHz, suggesting a possible source variability. The jet feature is not present in Wang et al. (2016) deep image because its surface brightness is too low to be detected in their high angular resolution – half power beam width (HPBW) = 0.65 0.56 arcsec – images. In the VLBA image by Wang et al. (2017), a single, slightly extended component is present with a flux density of at high angular resolution and with in a low-resolution map. The source flux density in the VLBA data is in the same range as our flux density estimates of the core ( at 1.5 and at 5 GHz), and the inverted spectrum is in agreement with the small VLBA size of the nuclear component.
J0306+1853 is unresolved in the L and C bands. It corresponds to a radio size smaller than 20 kpc; however, the spectral index is 0.87 0.06, suggesting the presence of a sub-arcsecond structure. The lack of an extended jet structure could be a result of the too low brightness due to the high inverse Compton losses.
B2 1025+23 is unresolved in images in the L and C band. It corresponds to a radio size smaller than 2 kpc with a spectral index of 0.48 0.02. This source was observed in VLBI mode with the European VLBI Network (EVN) by Frey et al. (2015). It shows a core-dominated one-sided jet with a few substructures. By comparison with previous observations, Frey et al. (2015) measured a super-luminal proper motion and, using multi-frequency observations, constrained the jet orientation to with respect to the line of sight, with a bulk Lorentz factor of , which is consistent with results based on X-ray data and broadband SED fitting (Sbarrato et al., 2012, 2013b).
2.3 Discussion
The high radio power of the source SDSS J0100+2802 and its radio spectral properties are strong evidence of active galactic nucleus (AGN) activity with a SMBH producing relativistic jets in the source inner region. Moreover, in this source we detected, for the first time, a diffuse emission in the northern direction, whose extension requires the presence of a relativistic jet to transport the radio plasma from the core to this structure. The detection of a nuclear emission with VLBA data (Wang et al., 2017) confirms this scenario and is not in agreement with a radio emission related to star formation activity or strong winds (see panessa19).
The source SDSS J0306+1853 was not observed with a VLBI array, and in JVLA images it shows a point-like image. However, its radio power and the relatively steep spectral index (0.87) suggests that a sub-arcsecond AGN jet structure is also present in this source. The source B2 1023+25 shows a clear relativistic jet from VLBI images.
We can conclude that all sources have an AGN jet morphology, and next we estimate the possible jet orientation and velocity to derive the relativistic Doppler factor and the intrinsic source parameters. Their radio power and properties are the same as those of sources in the unified model scenario.
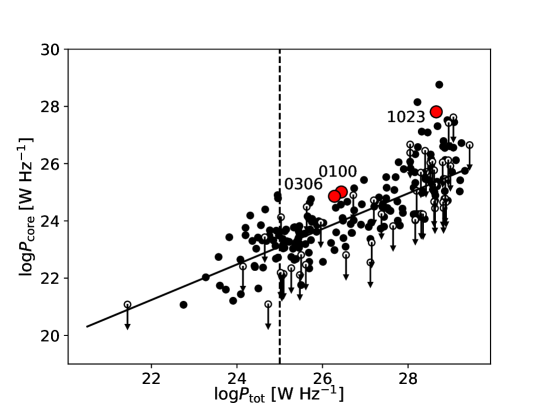
To estimate the source orientation and jet velocity for SDSS J0100+2802 and SDSS J0306+1853, we used the general correlation between the core and total radio power in radio galaxies found by Giovannini et al. (1988, 2001). Since the total radio power was measured at low frequency and is therefore not affected by Doppler boosting, the best-fit correlation returns a reference value for the core emission that, assuming that sources are oriented at random angles, corresponds to an average orientation angle of ; the observed dispersion of the core radio power around the best-fit line then reflects the different orientation angles (see Giovannini, 2004, for a more detailed discussion). We can use this correlation to derive the expected intrinsic core radio power from the total galaxy radio power and, comparing it with the observed core radio power, estimate the source orientation. Figure 2 shows the core radio power at 5 GHz () versus the total radio power at 408 MHz () of all 3C and B2 radio galaxies (see Giovannini et al., 1988, 2001; Giovannini, 2004), along with our three sources. The radio power at 408 MHz for J0100+2802 was derived from the flux density of the diffuse emission at 1.5 GHz and a spectral index of 1.18. For J0306+1853 we extrapolated the 1.5 GHz flux density with a spectral index of 0.87 and for B2 1023+25 with a spectral index of 0.5. Because of the high redshift, K-correction was applied to the low frequency and core radio power in Fig. 2 for a proper comparison.
The continuous line is the best-fit correlation obtained by Giovannini et al. (2001), who also properly accounted for the upper limits of the radio core emission. We also report the average division line between FRI and FRII radio galaxies, namely W Hz-1 at 408 MHz.
We can see that B2 1023+25 is among the most powerful sources of the sample. J0100+2802 and J0306+1853 are among the FRII sources, but they are relatively near the separation line.
All three sources are clearly above the correlation line, and we remember that sources lying above this line are believed to have a strong beaming in their core emission, more intense as the distance from the correlation line increases. In fact, B2 1023+25, being a known blazar, lies about three orders of magnitude above it. Both SDSS J0100+2802 and SDSS J0306+1853 exceed the expected core power of the correlation, hinting towards a beamed jet, but they are not as extreme as B2 1023+25. As a cautionary note, we remark that here we are assuming that the correlation between the total and core radio power found at relatively low redshift is still present in sources at high z (), but source evolution and the dominant IC losses suggest that it could evolve.
SDSS J0100+2802 is core-dominated and, according to the correlation previously discussed (see Giovannini, 2004, for a more detailed discussion), we can estimate that the largest possible orientation angle is if the jet velocity is . The extended emission is one-sided, and the observed asymmetry implies a jet velocity of c with the source oriented at , as expected for a steep spectrum lobe emission. At lower orientation angles, the required jet bulk Lorentz factor strongly decreases; for example, we have at and at .
SDSS J0306+1853 is unresolved in our images, and VLBI data are not available; however, we also applied the core dominance to this source to constrain its orientation angle, albeit with larger uncertainties. The largest possible orientation angle is with . At a smaller orientation angle the required jet bulk Lorentz factor decreases: at and at .
For the source B2 1025+23, we used the jet orientation and velocity estimated by Frey et al. (2015) using VLBI data. We note that we obtained similar results using JVLA data and the core dominance method.
SDSS J0100+2802 and SDSS J0306+1853 have properties similar to low-redshift giant radio galaxies at the centre of rich clusters (cD galaxies). They have a high mass and a radio power in the lower range of FRII sources (see Fig. 2). We note that, according to the bivariate radio luminosity function (see Auriemma et al., 1977; Best et al., 2005), the probability of being radio-loud is correlated to the SMBH and galaxy mass, but no correlation is present with the radio power. The relatively low intrinsic radio power, the moderate jet orientation angle, and the high redshift result in a low brightness emission. We only detected these sources because we have radio images at microJansky levels.
The source B2 1023+25 is a high-power blazar. Its intrinsic radio luminosity is high, in the range of high-power nearby FRII sources. Its jet orientation angle is small, and it appears as a very bright source. A similar source at a slightly larger orientation angle is PSO J0309+27 (Spingola et al., 2020).
3 Accretion
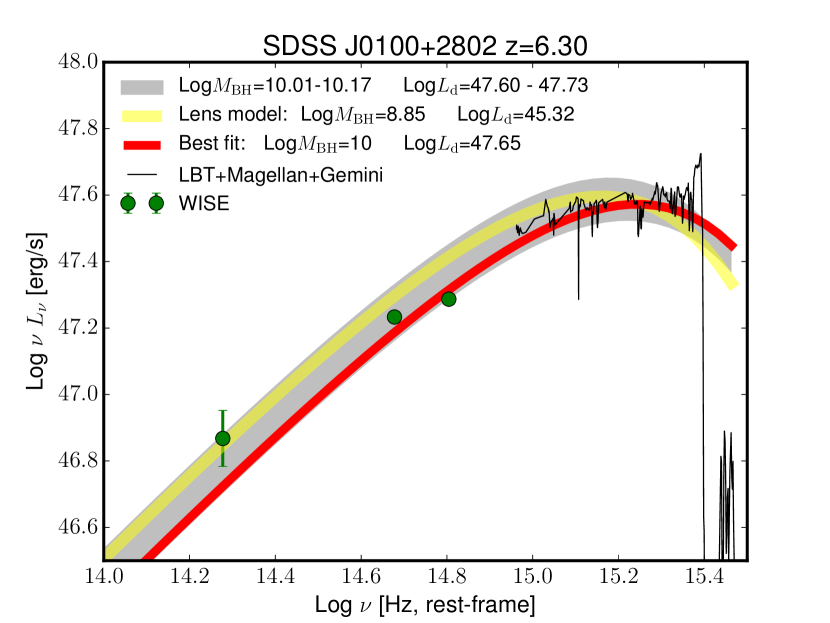
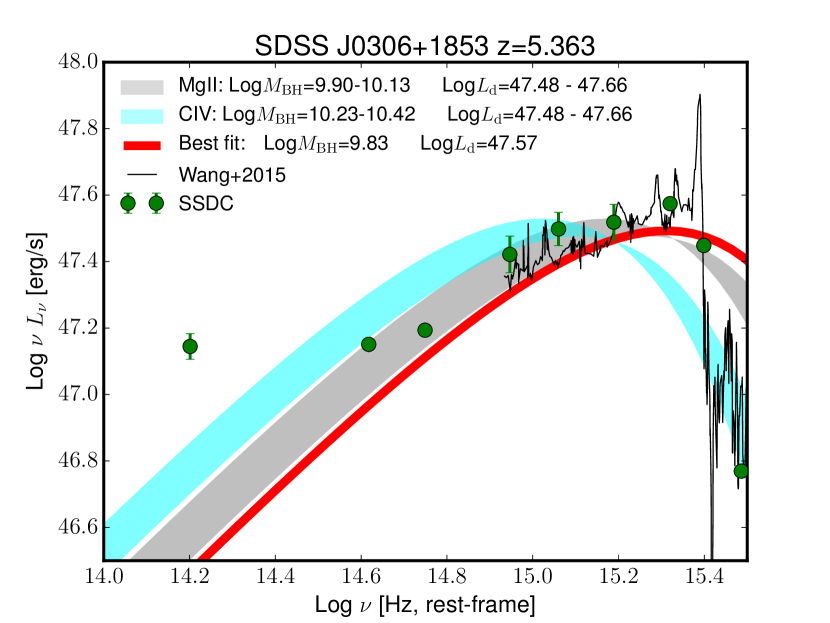
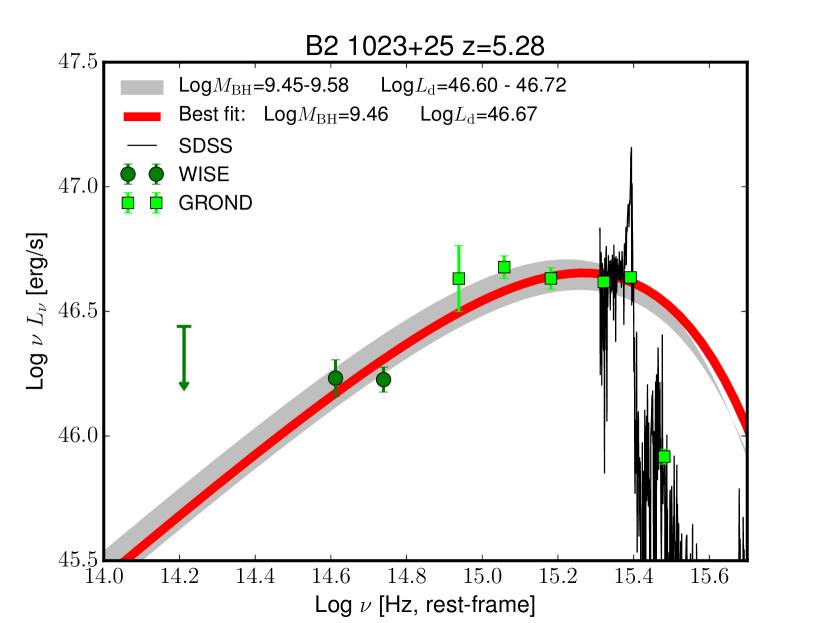
The black hole masses of SDSS J0100+2802 and SDSS J0306+1853, estimated through virial-based methods, are extremely large, considering that the time elapsed from the Big Bang is only 860 million years for SDSS J0100+2802 and 1 billion years for SDSS J0306+1853. On the other hand, the uncertainties associated with the ‘virial methods’ are large, also because there is no high-redshift calibration to extend their application. It would be interesting to exploit alternative methods in order to test these values. To this aim, we studied the accretion regime and features of all three sources by comparing their optical–near-IR continuum emission with two accretion disc models. The comparison is shown in Figs. 3 and 4.
| Log | Log | Log | Method | |
| [M⊙] | [erg/s] | [erg/s] | ||
| SDSS J0100+2802 | ||||
| 10.09 | 48.21 | 48.21 | 1 | MgII, |
| 47.67 | 48.21 | 0.29 | MgII, | |
| 10.00 | 47.65 | 48.11 | 0.34 | KD19 |
| 9.95 | 47.57 | 48.06 | 0.32 | SED Ai+17 |
| SDSS J0306+1853 | ||||
| 10.03 | 48.12 | 48.14 | 0.95 | MgII, |
| 47.58 | 48.14 | 0.28 | MgII, | |
| 10.33 | 48.12 | 48.44 | 0.48 | CIV, |
| 47.58 | 48.44 | 0.14 | CIV, | |
| 9.83 | 47.57 | 47.94 | 0.43 | KD19 |
According to the virial estimates (Wang et al., 2015; Wu et al., 2015), the two sources accrete close to the Eddington limit, defined as (see Table 2). Thus, we first used a modified version of the geometrically thin, optically thick accretion -disc model that better describes the regime close to and even beyond the Eddington limit. This was done through an analytic approximation as described in Kubota & Done (2019). These authors suggest a smooth transition between the standard -disc and an Eddington-limited emission, beginning from the innermost disc region. Close to the Eddington limit, in fact, the photon diffusion time across the disc height can exceed the accretion timescale (Begelman, 1978), leading to photon trapping, that is, photons generated in the disc during the viscous process are advected towards the central engine instead of being radiated away. The change in photon diffusion first starts closer to the central SMBHs due to the higher temperatures reached in those regions. Kubota & Done (2019) follow the assumption that in the photon trapping region the accretion flow at a distance from the black hole manages to radiate up to the local Eddington flux (defined as ), while the rest of the radiation is advected and ultimately accreted onto the black hole. In order to approximate this behaviour, we modified a multi-colour black body by assuming that the temperature is fixed at the equivalent Eddington temperature, ( is the Maxwell-Boltzmann constant), at those radii where the standard Shakura & Sunyaev (1973) temperature would be larger than . This approach allowed us to keep only two free parameters in our modelling: the black hole mass, , and the accretion rate, . In principle, the solution also depends on the viewing angle, but we decided for SDSS J0100+2802 and SDSS J0306+1853 to fix it at the average value, (i.e. an average value between face-on and the expected opening angle of the obscuring torus, ). B2 1023+25, instead, is a well-known blazar, with a jet viewing angle of , which we assume to be valid for the accretion disc as well.
It should be noted that we did not perform a proper fitting procedure: We just compared the accretion model with photometric and spectroscopic data. As is clearly visible from Figs. 3 and 4, data at frequencies higher than the Ly line [Log rest frame] were not considered, since the flux is absorbed due to intervening clouds of matter distributed randomly. We did not assume any absorption model, due to their large uncertainties. Far-IR data are taken in lesser consideration because of the possible contribution from the dusty absorbing structure. Results of the parameter derivation are listed in Table 2: Both SDSS J0306+1853 and SDSS J0100+2802 require black hole masses of , which is consistent with the virial-based masses derived in literature. The B2 1023+25 mass ranges between 2.8 and .
The comparison between data and the Kubota & Done (2019) model is good for all sources, and results are consistent with the virial-based ones found in the literature (see Table 2), but the model relies on the assumption of a non-rotating black hole (Kubota & Done, 2019). This might be in contrast with the new observations we have presented in the radio band. The sources show, in fact, the presence of relativistic jets, which are in general associated with highly spinning black holes. Thus, in order to include the black hole spin, , we considered an analytic approximation of the KERRBB model (Li et al., 2005), initially developed for stellar mass black holes in galactic binaries but extended to SMBHs by Campitiello et al. (2018, 2019).
The data of all three sources show the presence of the peak of an accretion disc emission: This is crucial for the approach we are following with KERRBB. This model is indeed able to reproduce an -disc-like profile with a set of parameters , , , and . The solutions suffer from strong degeneracy: One should constrain at least two of these parameters in order to have a reasonable estimate of the set. We first fixed the viewing angle as in our first approach: for B2 1023+25 at the known , and in the case of SDSS J0100+2802 and SDSS J0306+1853 to an average value of , since the sources clearly show their thermal emission and broad emission lines (i.e. the viewing angle is smaller than the expected torus opening angle, ). As shown in Campitiello et al. (2018), the remaining parameters are degenerate, and the same peak position can be reached by accretion discs with different and values, between and 222 The maximally co- and counter-rotating spin values cannot be reached if capture of radiation by the black hole is considered (Thorne, 1974). . Table 3 shows the results obtained by following Campitiello et al. (2018, 2019) on the peak positions derived with the Kubota & Done (2019) approach, for the notable spin values of . All results point towards extreme black hole mass values and high Eddington ratios that span between and the Eddington limit. Since SDSS J0306+1853 and SDSS J0100+2802 present jet signatures, their central black holes are expected to be maximally spinning and co-rotating with the accretion disc. This favours larger black hole masses and smaller Eddington ratios. We discuss the implications of these expectations in Sect. 5.
| SDSS J0100+2802 | |||||
|---|---|---|---|---|---|
| 0 | 6 | 9.78 | 28.00 | 47.71 | 0.66 |
| 0.998 | 1.24 | 10.24 | 27.48 | 47.94 | 0.39 |
| –0.998 | 9 | 9.62 | 28.16 | 47.69 | 0.90 |
| SDSS J0306+1853 | |||||
| 0 | 6 | 9.64 | 27.92 | 47.63 | 0.75 |
| 0.998 | 1.24 | 10.10 | 27.40 | 47.86 | 0.44 |
| –0.998 | 9 | 9.48 | 28.08 | 47.61 | 1.03 |
| B2 1023+25 | |||||
| 0 | 6 | 9.26 | 27.04 | 46.75 | 0.24 |
| 0.998 | 1.24 | 9.66 | 26.56 | 47.02 | 0.18 |
| –0.998 | 9 | 9.11 | 27.19 | 46.73 | 0.32 |
4 Jet features
All three sources clearly show the presence of jets in their radio emission. B2 1023+25 has already been classified as a blazar because of its radio-loudness, flat radio spectrum, strong and hard X-ray flux and spectrum, and super-luminal motion in VLBI images (Frey et al., 2015).
SDSS J0100+2802 and SDSS J0306+1853, instead, are defined as radio-quiet sources: They are in the FIRST survey footprint, without being detected. SDSS J0306+1853 was never detected in the radio band, leading to a radio-silent classification. At the microJansky level, on the other hand, these sources are well detected, showing that they are indeed powerful in the radio band and host a jet. We calculated their radio-loudnesses, defined as rest frame, in order to compare them with the known quasar population. Even if their radio power is intense (cf. Table 1), their extremely luminous big blue bumps led us to classify them as radio-quiet sources, with for SDSS J0100+2802 and for SDSS J0306+1853.
We note that Padovani (2016) already proposed dividing AGNs not into radio-loud and radio-quiet categories, but into jetted and non-jetted, where ‘jet’ here means a relativistic jet. This is certainly a more physical classification and is even more appropriate when dealing with high-redshift sources that have a very strong accretion disc and whose extended (quasi-isotropic) radio flux could be quenched by the enhanced inverse Compton cooling off the CMB photons.
Their radio features are not very common in such strongly accreting quasars: Locally, one would expect to see strong jets, culminating in extended emission, in sources with such high accretion power (Ghisellini et al., 2014b, 2015). SDSS J0100+2802 and especially SDSS J0306+1853, instead, show rather compact emissions, with no signs of strong extended lobe-like structures. Only SDSS J0100+2802 shows a jetted structure, resolved on VLA scale, which allowed us to discriminate between compact and diffuse emissions. SDSS J0306+1853 instead presents a compact and rather steep radio emission: We cannot exclude that it hosts a young jet, such as those shown in compact steep spectrum (CSS) or gigahertz peaked spectrum (GPS) radio sources (O’Dea, 1998; O’Dea & Saikia, 2021).
In the following we briefly summarize the model we used to fit the jet emission in order to find its main physical properties, including its total power. The latter is the main parameter we need to evaluate the power injected into the extended structure, which can be a hot spot or a lobe. The distinction between hot spot and lobe, when we lack detailed radio maps, is somewhat arbitrary: For simplicity, we call a structure with a size (radius) of less than 3–5 kpc a ‘hot spot’, and above this size a ‘lobe’.
We stress that our model for the extended structure assumes a spherical and homogeneous structure, without any gradient. When more precise data are missing, such as the level of the high energy emission, we try to be as close as possible to the case of equipartition between the magnetic and the relativistic electron energies.
4.1 Modelling the inner jet emission
As mentioned, of our three sources only B2 1023+25 is clearly a blazar, and it has a very powerful jet that points towards us. To model it, we used the model described in detail in Ghisellini & Tavecchio (2009). We recall here only the basic features of the model, following the same notation as the original paper.
The emitting region is assumed to be a sphere of radius at a distance from the black hole, moving with a bulk Lorentz factor at an angle from the observer. The jet is assumed conical with an aperture angle of 0.1 rad. A particle distribution of relativistic electrons of energy is injected throughout the region, for a light crossing time . The injected particle distribution is a smoothly broken power law:
| (1) |
where is the break energy, and are the slopes below and above the break, and is the distribution normalization. The particle density distribution, used to calculate the spectrum, is obtained through the continuity equation that accounts for injection, radiative losses, photon–photon collisions, and pair production. For the radiative losses, we account for synchrotron, self-Compton and inverse Compton scatterings off the disk, broad lines, torus, and CMB radiation (external Compton). We also calculate the jet power, that is, the sum of the power emitted and carried in magnetic fields and particles. All these powers can be expressed as
| (2) |
where the subscript refers to the different forms of energy and is calculated in the co-moving frame. The total power is the sum. In general, the magnetic and particle powers are model-dependent, while the radiative power depends only on the factor since is
| (3) |
where is the luminosity measured by the co-moving observer. When we have and then:
| (4) |
This can be taken as a very robust lower limit to the jet power. For our purposes, the jet power is an important parameter because we can use it to estimate the power that can energize the extended structures, such as hot spots and lobes.
4.2 Modelling the extended structures
For the extended structures we followed the model described in Ghisellini et al. (2014a). We take into account the radiative and adiabatic cooling of the emitting electrons, considering the effect of the external Compton (EC) scattering off the CMB radiation. Its energy density, , scales as , and this implies that the corresponding EC luminosity at high energies becomes dominant over SSC when the magnetic field energy density is smaller than , giving:
| (5) |
At we have G. This has two effects: First, the enhanced EC cooling implies a strong X-ray emission, and, second, the enhanced cooling implies a steepening of the particle distribution at high energies, with a corresponding dimming of the high frequency radio emission. We stress that this can only be found by using the continuity equation, while the assumption of a given, fixed particle distribution would not show the ‘radio quenching’ effect.
The adiabatic cooling rate is:
| (6) |
where is the expansion speed of the lobe or hot spot. As for the injected particle distribution, we used the same function as in Eq. 1, but with different slopes and values. The total power injected, in relativistic electrons, throughout the extended structure is assumed to be a fraction, , of the jet power, namely
| (7) |
where is the source volume, assumed spherical for the sake of simplicity.
We then calculated the total magnetic and particle energy in the extended structure, making use of the particle energy distribution found using the continuity equation and neglecting protons, assumed to be cold:
| (8) |
Equipartition then corresponds to .
| Source | ||||||||||||||
|---|---|---|---|---|---|---|---|---|---|---|---|---|---|---|
| [1] | [2] | [3] | [4] | [5] | [6] | [7] | [8] | [9] | [10] | [11] | [12] | [13] | [14] | [15] |
| 0100+2802 | 6.3 | 7e9 | 364 | 2519 | 1907 | 0.03 | 1 | 13 | 16 | 70 | 3e3 | 1 | 2.6 | 366 |
| 0100+2802 | 6.3 | 7e9 | 364 | 1680 | 1907 | 0.06 | 0.4 | 2 | 30 | 70 | 3e3 | 1 | 2.6 | 9.4 |
| 0306+185 | 5.363 | 1e10 | 300 | 1800 | 1729 | 0.01 | 0.8 | 13 | 13 | 70 | 3e3 | 1.5 | 2.6 | 142 |
| 0306+185 | 5.363 | 1e10 | 300 | 1800 | 1729 | 5e–3 | 1.2 | 2 | 30 | 70 | 3e3 | 1.5 | 2.6 | 1.9 |
| B2 1023+25 | 5.3 | 2.8e9 | 58.2 | 840 | 763 | 0.01 | 2.6 | 13 | 3 | 90 | 4e3 | 0 | 2.6 | 62 |
| Source | Comp. | ||||||||||
|---|---|---|---|---|---|---|---|---|---|---|---|
| [1] | [2] | [3] | [4] | [5] | [6] | [7] | [8] | [9] | [10] | [11] | [12] |
| 0100+2802 | lobe | 70 | 1.1 | 7 | 4e3 | 1e5 | 1 | 2 | 58.1 | 58.9 | 0.2 |
| 0306+185 | lobe | 10 | 2 | 21.7 | 1e3 | 3e5 | 1 | 2.7 | 57.4 | 57.3 | 0.14 |
| B2 1023+25 | hot spot | 3 | 10 | 250 | 1e4 | 1e6 | 1.3 | 2.5 | 57.9 | 57.4 | 0.2 |
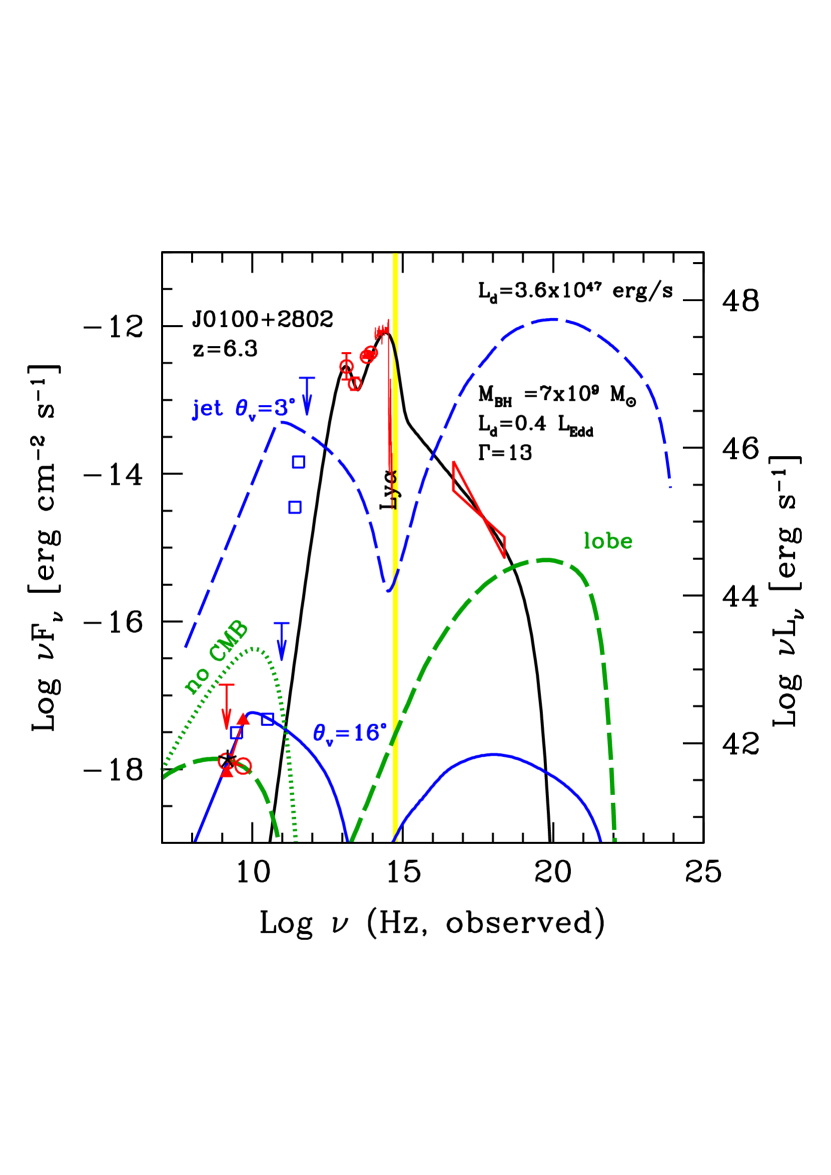
4.3 SDSS J0100+2802: The powerful jet case
Figure 5 shows the SED of SDSS J0100+2802 together with the models of the jet and the extended emission. The data are from the Space Science Data Center archive (SSDC333https://tools.ssdc.asi.it/ ), from Wang et al. (2016) and Ai et al. (2017), while the radio data are from this work. As discussed before, the accretion disc emission is clearly visible, as is the X-ray spectrum, which was already analysed and discussed in Ai et al. (2017) and interpreted as emission from the X-ray corona. From our data, we can see the presence of two radio components, whose fluxes are shown by the empty circles and filled triangles, respectively. The triangles suggest a very flat (or inverted) component, which we interpret as emission from a compact relativistic jet. The other component (circles) is instead steep, and we interpret that as coming from an extended structure, with a size of 70 kpc (projected).
To model the jet of this source we have only the JVLA radio data of the flat component. It is therefore necessary to use some general guidelines in order to find a meaningful solution. We first assumed that the jet of SDSS J0100+2802 is a ‘standard’ jet, namely that, if viewed at a small viewing angle, it should appear as a very powerful blazar jet, with a power comparable to, if not larger than, the disc luminosity. On the other hand, when seen misaligned, it must produce the JVLA flux of the flat component. This is shown in the left panel of Fig. 5: The dashed blue line is the jet emission that a observer would see. In this case we have comparable disc luminosity and the total jet power, as listed in Table 4. The same jet, if observed at , would account for the flat JVLA component, as shown by the solid blue line. This is in contrast with the discussion presented in Sect. 2.2 and implies that the known correlation between the core and total radio power in low-redshift AGNs needs to be revised at high .
For the extended component (dashed green line) we have the constraint of the observed, relatively steep X-ray flux (the extended structure should not overproduce it) and the fact that in the radio map there is no sign of a counter-lobe. This suggests that the entire structure is not stationary but rather has some bulk motion. We find that is enough to make the counter-jet not detectable. The solution shown in Fig. 5 assumes that the injected power, needed to accelerate the electron in the lobe, is 0.3% of the total jet power ( vs. erg s-1). The lobe has .
To show the importance of the CMB cooling, we also show the same model, but setting to zero. The synchrotron flux would be enhanced, at the expense of the X-ray flux, which precipitates below the scale of the figure (at the level of erg s-1 cm-2).
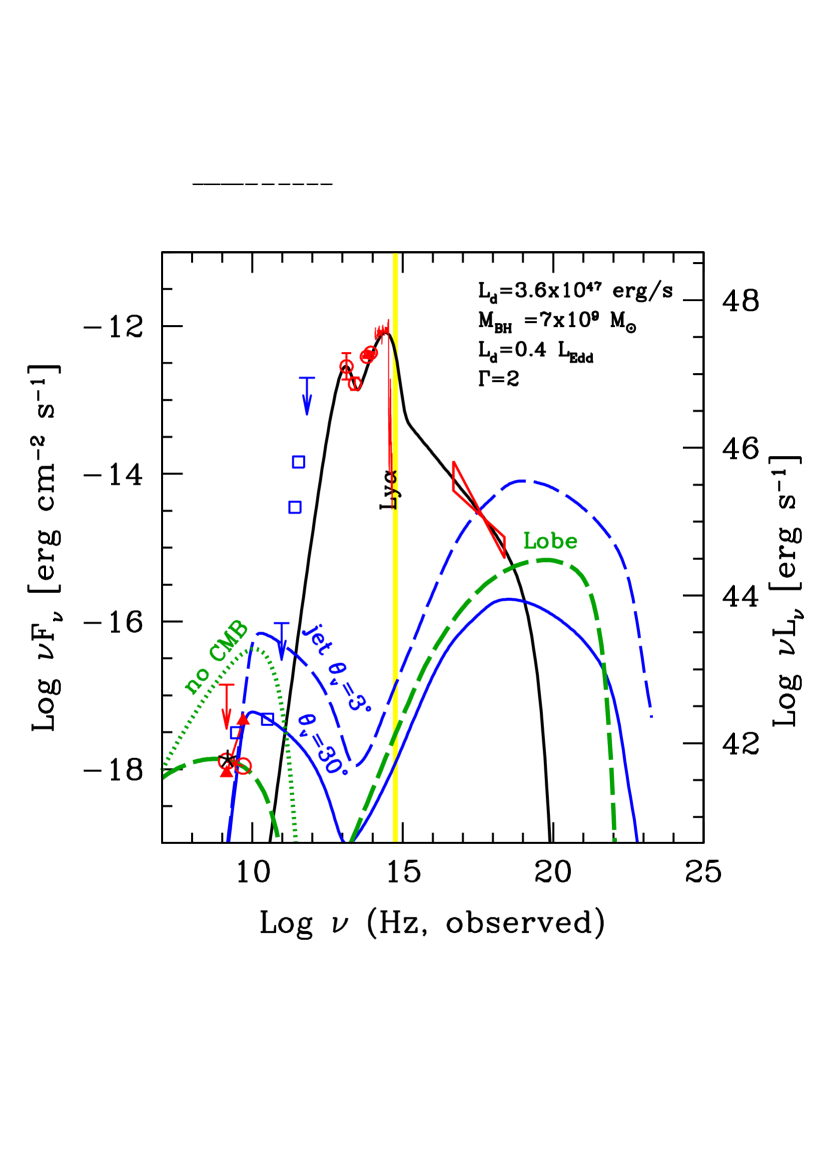
4.4 SDSS J0100+2802: The weak jet case
In this case we assumed that the jet is still mildly relativistic, but with and . The reason for this choice comes from the correlation discussed in Sect. 2.2 between the core and the total flux of radio AGNs, shown in Fig. 2. In this case, the de-beamed flux is much less dependent on the viewing angle, allowing it to be greater. The corresponding model is shown in the right panel of Fig. 5. The figure shows the appearance of the jet flux if (dashed blue line) and at (solid blue line). We have chosen because it is the average angle considering the presence of a molecular absorbing torus with a semi-aperture angle of . At angles larger than the optical flux would be severely absorbed, and the source would not have the chance to be detected by the SDSS survey. The lobe model is the same as in the left panel. From Tables 4 and 5 we see that the extended lobe requires 12% of the total jet power.
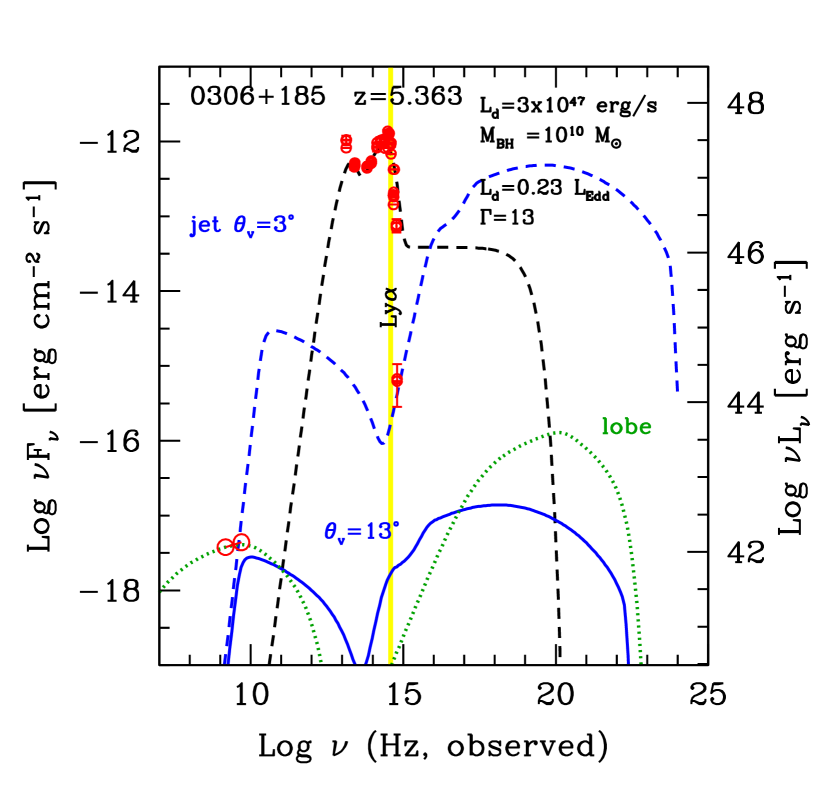
4.5 SDSS J0306+1853: The powerful jet case
The rationale behind the parameter choice for the powerful jet in SDSS J0306+1853 is the same as before: The jet has a total power close to and . The left panel of Fig. 6 shows this case, and the dashed blue line is what a observer would see. The model is weakly constrained by the measured spectral index between 1.5 and 5 GHz, suggesting the contribution of both a flat (core) and a steep (extended) component. The viewing angle for which the jet emission comes close to the JVLA data is , and the corresponding jet model is shown by the solid blue line.
For the extended component, from the JVLA radio map we assumed a lobe size of 10 kpc (de-projected), and the absence of a counter-lobe can be explained by a bulk velocity of the lobe of . The power needed for this structure is erg s-1, to be compared with a total jet power of erg s-1 (i.e. 71 times larger). The lobe would dominate the extended X-ray flux, but a sensitivity larger than erg s-1 cm-2, together with an excellent angular resolution, is required to detect it.
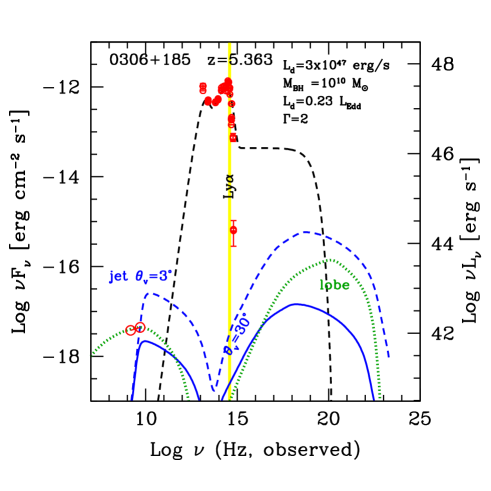
4.6 SDSS J0306+1853: The weak jet case
In complete analogy with the case of SDSS J0100+2802, we again assumed together with a total jet power much lower than the disc luminosity (i.e. 150 times smaller). The resulting model is shown in the right panel of Fig. 6: The dashed blue line corresponds to the observer, and the solid blue line to . The model for the extended structure is the same as in the left panel, but now the power it requires exceeds the total jet power, disfavouring this solution.
4.7 B2 1023+25
For this source there is no ambiguity between a strong and weak jet, since it is a well-known blazar, as discussed in Sbarrato et al. (2012, 2013b). We updated the SED to include the flux estimated by the JVLA data (i.e. 32 mJy at 5 GHz). This is the result of a subtraction of our JVLA flux and the VLBI flux observed by Frey et al. (2015). We then assumed that this flux is produced by a hot spot with a radius of 3 kpc, moving with a bulk motion of . To explain the 32 mJy flux, and to not be far from equipartition, the hot spot requires one-sixth of the total jet power (i.e. vs. erg s-1). We note that the magnetic field of the hot spot (250 G) is larger than for , and therefore the emission is not affected by a strong EC cooling.
4.8 Discussion
For B2 1023+25, there is no ambiguity in the power of its jet. It follows the relation between jet power and accretion disc luminosity put forward by, for example, Ghisellini et al. (2014b), making B2 1023+25 a powerful blazar. The other two sources, on the other hand, definitely have a jet, but its power is uncertain. The total radio luminosity at low frequency makes both of them belong to the FR II radio galaxy class (see Fig. 2). SDSS J0100+2802 has been detected previously in VLBI observations by Wang et al. (2017), but the resolution was not sufficient to clearly see a collimated inner jet, leading the authors to assign this emission to some outflow from the accretion disc or to plasma heated by the AGN X-ray corona. However, our VLA observations clearly show the presence of a jet, implying that powerful jets (of the FR II type) can be present even in radio-quiet objects.
For both sources our modelling corresponds to two extremes: First, we assumed that the jets of all jetted sources are alike, that they have similar bulk Lorentz factors, and that their power is of the same order of their accretion disc luminosities. Second, we instead assumed that their jet is only mildly relativistic. We note that any solution in between these two extremes might be possible, as long as the extended component energized by the power carried by the jet is compatible with the data we observe. We have seen that the power required by the lobe of SDSS J0306+1853 is of the same order of the entire power of the ‘weak’ jet, suggesting that this extreme solution is not tenable. But we cannot exclude a priori that its jet is somewhat less powerful than the ones we see in blazars.
The compactness of the radio structures could suggest that the sources belong to the GPS/CSS population (O’Dea & Saikia, 2021), particularly in the case of SDSS J0306+1853. However, the expected young age of the GPS/CSS population contrasts with the very large black hole masses hosted in our sources (indicating a relatively ‘old’ age), which requires the radio phase to not occur simultaneously with strong accretion phases. We also considered the hypothesis of a strong wind responsible for SDSS J0306+1853 properties, but its radio luminosity is on the higher extreme of the range of radio powers associated with strong wind emitters. We also considered that such strong winds are always accompanied by significant nuclear obscuration (as also described by Hwang et al., 2018), a feature that SDSS J0306+1853 is completely lacking.
Independently of this, our modelling shows that even the ‘weak jet’ solution implies a jet power larger than a few erg s-1. This is larger than the power of many blazars studied in Ghisellini et al. (2014b).
We can thus conclude that the jets in these sources are in any case crucial components of their structure, dynamics, and physics despite the fact that these sources can be formally classified as radio-quiet.
5 Jets in the early Universe
In the previous sections we derived the presence of jets in all three sources, and in particular we explored different options of jet orientation for SDSS J0100+2802 and SDSS J0306+1853. We have concluded that despite the uncertainty on jet features, these two extremely massive sources host relativistic jets even if they are classified as ‘radio-quiet’ according to the standard definition. We selected them for this work only on the basis of their extreme masses: SDSS J0100+2802 and SDSS J0306+1853 are the two most massive quasars at and the only two with at such high redshift. What does finding jets in the most massive quasars at imply for the formation and evolution of the accreting black hole population?
Assuming that jetted quasars are distributed with uniform orientations in the sky and assuming one knows the viewing angle, one can estimate how many quasars with the same intrinsic features (mass, accretion rate, jet, etc.) as SDSS J0306+1853 and SDSS J0100+2802 exist at the same redshift. Specifically, one can infer the population size, , of differently aligned analogues of a source by knowing its viewing angle, assuming that it covers a solid angle, , and that the whole population is uniformly oriented in the sky. Eventually, this must be corrected for the selection sky area of the source. Each detected source is thus representative of a population of other defined as:
| (9) |
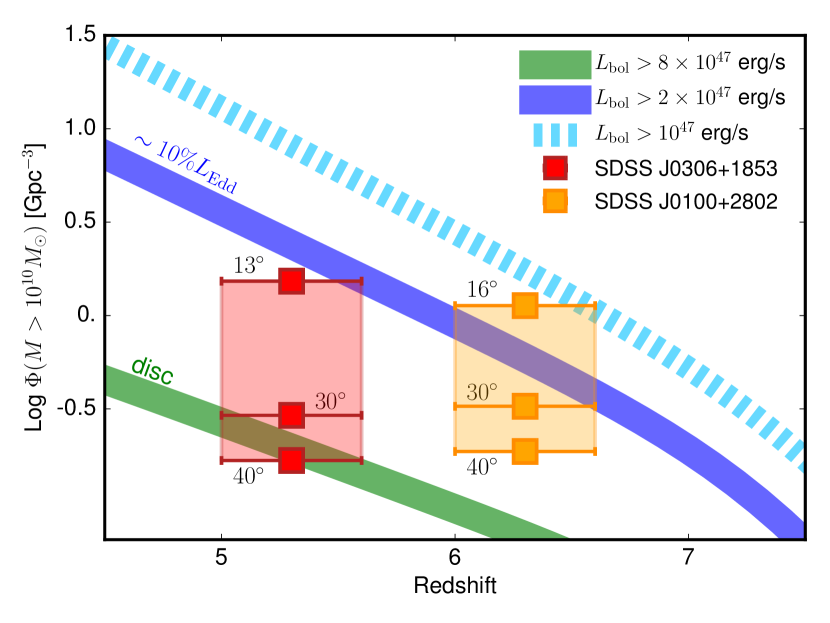
We used this approach to evaluate how SDSS J0306+1853 and SDSS J0100+2802 can trace the population of active black holes at and 6.3, respectively. Figure 8 shows the results for the discussed viewing angles and , along with the aperture angle expected for an obscuring toroidal dust structure, (i.e. the maximum viewing angle expected for a Type 1 quasar), and an average viewing angle for this type of sources, . Specifically, this figure shows the co-moving number densities of active black holes hosted in jetted sources at and , as traced by our two quasars. We compared them with the corresponding curves for the whole AGN population with masses larger than obtained from the luminosity function by Shen et al. (2020). These authors base their study on an observational compilation that includes quasar observations in the rest-frame IR, B band, UV, and soft and hard X-ray performed in the past few decades, without explicit separation between jetted and non-jetted sources. We thus assumed that their bolometric luminosity function describes the whole AGN population, including jetted sources. We chose to compare our results with two different luminosity ranges from the Shen et al. (2020) results: a bolometric luminosity comparable to or higher than that of SDSS J0100+2802 and SDSS J0306+1853, and a bolometric luminosity corresponding to (or higher than) of the Eddington luminosity in the case of . The bolometric luminosities considered by Shen et al. (2020) were obtained through a phenomenological so-called bolometric correction commonly used in the literature to estimate the overall thermal output of the nuclear region of an AGN. Not only does it include the accretion emission from the disc, but it also adds the re-emitted IR luminosity from the dusty obscuring structure and X-ray emitting corona. On average, the bolometric luminosity should be , where is the viewing angle pattern emission.
Figure 8 clearly highlights a problematic feature: The population traced by SDSS J0306+1853 and more dramatically by SDSS J0100+2802 might outnumber what is expected from studying known catalogues thought to be relatively complete. Their co-moving number density is larger than the space density of not only their non-jetted counterparts at same luminosity range, but also of the overall known population, irrespective of the chosen viewing angle. The contrast is less extreme if the population is assumed to be traced by accreting sources (i.e. slower than SDSS J0100+2802 and SDSS J0306+1853). Even in this case, though, the jetted sources appear to be much more numerous in comparison to non-jetted ones than the expected 10% of the population observed at lower redshift, and the jetted ratio appears to increase going towards higher redshift. Jets clearly have a much more prominent presence and perhaps a more prominent role in the early Universe.
Jetted sources that host extremely massive black holes are not easy to reconcile with their extremely high redshift. In fact, the presence of a jet is generally associated with a highly spinning accreting black hole, which corresponds to a higher radiative efficiency in the accretion process. In other words, a larger fraction of the accreting mass energy is radiated away compared to the case of a non-spinning black hole. Thus, less matter would ultimately accrete onto the central black hole, slowing down the accretion process itself. The standard radiative efficiency of is generally associated with a Newtonian approximation of a non-spinning black hole, while a maximally spinning object implies a radiative efficiency of (Thorne, 1974). A slow accretion implies an extremely massive seed black hole, which can become problematic in the view of seed formation theories (Volonteri, 2012).
Assuming a Salpeter timescale (Salpeter, 1964) for a continuous accretion from , we are able to estimate the seed black hole mass from which accretion started, as we show for different accretion and radiative efficiency combinations in Fig. 9. A black hole accreting with an Eddington ratio of (as we derived in Sect. 3) up to needs a seed black hole with if it is maximally spinning.
Even an accretion at the Eddington limit would not allow the presence of a Pop III star origin to be inferred for the seed black hole (): With the same assumptions, the very presence of SDSS J0100+2802 at implies a seed of . A solution that would lead to a smaller seed black hole is that not all the gravitational energy released during the accretion process gets radiated away, only a fraction of it. As an example, we can assume, as in Ghisellini et al. (2013), that a jetted SMBH releases a fraction of the accreting mass energy , but only gets radiated away. For a fixed observed luminosity, more mass is directly accreted onto the central black hole. The resulting would instead be involved in the jet launching. Under this assumption, for the seed black hole needed would be less massive, albeit not drastically so. Nevertheless, the presence of a jet accelerates the accretion process, easing the problematic formation of extremely massive black holes such as the ones we are studying.
More significantly, there was no initial clue that these sources host a jet: no radio emission and/or a very low radio-loudness. The main issue is thus that, at very high redshift, extremely massive sources might not result as jetted according to large surveys, but they might be hiding powerful relativistic jets in plain sight. High-resolution radio observations are definitely needed in order to observe their jets and derive their features. To explore whether this covers all massive sources at , a more extensive search with VLA- or VLBI-dedicated observations is necessary in order to overcome the limitations of microJansky-limited radio surveys.
6 Conclusions
We performed VLA observations of three quasars, SDSS J0100+2802, SDSS J0306+1853, and B2 1023+25, in order to look for jet signatures in their radio emission. The first two sources are radio-quiet quasars, and as such they are expected to not have a jet, while the last is strongly radio-loud and a well-known jetted source. We then studied their broadband emissions in order to derive accretion and jet features and ultimately investigate the presence and details of relativistic jets in the early Universe that coexisted with extremely massive quasars.
B2 1023+25 was already classified as a high-redshift blazar thanks to its X-ray features and existent VLBI observations. Our data are consistent with the previous classifications, showing a compact, bright radio emission that is consistent with a powerful relativistic jet aligned to our line of sight.
Previous observations of SDSS J0100+2802 in the radio band hint towards an AGN emission for its radio flux, but we managed to resolve its VLA emission, which shows a core and a slightly extended emission. SDSS J0306+1853 was previously undetected in the radio band. We observe strong, unresolved radio emission at both 1.4 and 5GHz. Even though their radio-loudness does not describe them as typical jetted sources, their radio power is clearly consistent with that of FRII sources. We thus can conclude that they host relativistic jets, even if their extreme optical brightness makes them radio-quiet. This reinforces the idea suggested by Padovani (2016) that the radio-quiet versus radio-loud dichotomy should not uniquely correspond to non-jetted versus jetted classifications.
The broadband SED fitting of SDSS J0306+1853 and SDSS J0100+2802 is consistent with the presence of a powerful relativistic jet with viewing angles of and , respectively, and a standard bulk Lorentz factor of in both cases. Both SEDs are also consistent with larger viewing angles (), which are associated with a smaller Lorentz factor of 2. We nevertheless prefer the solution with a smaller viewing angle since the injected power in the hypothetic lobe structures should be a substantial fraction (if not almost all) of the total jet power in the case of a slower solution, leaving no room for dispersion.
We note that SDSS J0100+2802 and SDSS J0306+1853 were only selected on the basis of their mass: They were the only two quasars at with masses larger than . We did not have radio-based suggestions that these sources could host jets. Their extreme masses, associated with strong jets, challenge the formation and evolution picture of the first SMBHs: There is not enough time to build them according to standard models. The presence of jets in both of them suggests that they might be playing an interesting role in the fast formation of extremely massive sources: They might even be facilitating extreme events of accretion in the early Universe and be much more present in the massive black hole population at high .
While jets are commonly searched for in radio surveys, we have proven in this work that this standard approach might lead to a substantial underestimate of their presence at high . Slightly misaligned jets in AGNs can only be detected thanks to deep radio observations: microJansky-level surveys such as FIRST are not efficient in detecting them. Moreover, another issue related to their detection is linked to the apparent absence of a strongly emitting radio lobe. Extended radio lobes are known to be quenched by the interaction of electrons with the CMB radiation, which is much more energetically dense at . Even at lower redshift, it can be difficult to observe the extended emission in some cases. The powerful and widely studied blazar 3C 273 had lacked extended lobe radio observation until a few years ago due to the dynamical range of radio interferometric observations (Perley & Meisenheimer, 2017). The eventual observations revealed a somewhat small lobe power, of erg/s.
The detection of extended radio emission and relativistically beamed emission from the core jet of very high-redshift sources might be more difficult than expected, but jets might be much more frequent in the extremely massive quasar population at , suggesting a more prominent role in the early formation of these sources. An extensive search for jets therefore requires high-resolution radio observations.
Acknowledgements.
We thank the referee for their valuable comments and suggestions. The National Radio Astronomy Observatory is a facility of the National Science Foundation operated under cooperative agreement by Associated Universities, Inc.References
- Ai et al. (2017) Ai, Y., Fabian, A. C., Fan, X., et al. 2017, MNRAS, 470, 1587
- Auriemma et al. (1977) Auriemma, C., Perola, G. C., Ekers, R. D., et al. 1977, A&A, 57, 41
- Bassett et al. (2004) Bassett, L. C., Brandt, W. N., Schneider, D. P., et al. 2004, AJ, 128, 523
- Becker et al. (1994) Becker, R. H., White, R. L., & Helfand, D. J. 1994, in Astronomical Society of the Pacific Conference Series, Vol. 61, Astronomical Data Analysis Software and Systems III, ed. D. R. Crabtree, R. J. Hanisch, & J. Barnes, 165
- Begelman (1978) Begelman, M. C. 1978, MNRAS, 184, 53
- Best et al. (2005) Best, P. N., Kauffmann, G., Heckman, T. M., et al. 2005, MNRAS, 362, 25
- Campitiello et al. (2019) Campitiello, S., Celotti, A., Ghisellini, G., & Sbarrato, T. 2019, A&A, 625, A23
- Campitiello et al. (2018) Campitiello, S., Ghisellini, G., Sbarrato, T., & Calderone, G. 2018, A&A, 612, A59
- Cao et al. (2017) Cao, H. M., Frey, S., Gabányi, K. É., et al. 2017, MNRAS, 467, 950
- Condon et al. (1998) Condon, J. J., Cotton, W. D., Greisen, E. W., et al. 1998, AJ, 115, 1693
- Davies et al. (2020) Davies, F. B., Wang, F., Eilers, A.-C., & Hennawi, J. F. 2020, ApJ, 904, L32
- Decarli et al. (2018) Decarli, R., Walter, F., Venemans, B. P., et al. 2018, ApJ, 854, 97
- Fan et al. (2020) Fan, L., Chen, W., An, T., et al. 2020, ApJ, 905, L32
- Fan et al. (1999) Fan, X., Strauss, M. A., Schneider, D. P., et al. 1999, AJ, 118, 1
- Frey et al. (2015) Frey, S., Paragi, Z., Fogasy, J. O., & Gurvits, L. I. 2015, MNRAS, 446, 2921
- Fujimoto et al. (2020) Fujimoto, S., Oguri, M., Nagao, T., Izumi, T., & Ouchi, M. 2020, ApJ, 891, 64
- Ghisellini et al. (2014a) Ghisellini, G., Celotti, A., Tavecchio, F., Haardt, F., & Sbarrato, T. 2014a, MNRAS, 438, 2694
- Ghisellini et al. (2010) Ghisellini, G., Della Ceca, R., Volonteri, M., et al. 2010, MNRAS, 405, 387
- Ghisellini et al. (2015) Ghisellini, G., Haardt, F., Ciardi, B., et al. 2015, MNRAS, 452, 3457
- Ghisellini et al. (2013) Ghisellini, G., Haardt, F., Della Ceca, R., Volonteri, M., & Sbarrato, T. 2013, MNRAS, 432, 2818
- Ghisellini & Sbarrato (2016) Ghisellini, G. & Sbarrato, T. 2016, MNRAS, 461, L21
- Ghisellini & Tavecchio (2009) Ghisellini, G. & Tavecchio, F. 2009, MNRAS, 397, 985
- Ghisellini et al. (2014b) Ghisellini, G., Tavecchio, F., Maraschi, L., Celotti, A., & Sbarrato, T. 2014b, Nature, 515, 376
- Giovannini (2004) Giovannini, G. 2004, Ap&SS, 293, 1
- Giovannini et al. (2001) Giovannini, G., Cotton, W. D., Feretti, L., Lara, L., & Venturi, T. 2001, ApJ, 552, 508
- Giovannini et al. (1988) Giovannini, G., Feretti, L., Gregorini, L., & Parma, P. 1988, A&A, 199, 73
- Hwang et al. (2018) Hwang, H.-C., Zakamska, N. L., Alexandroff, R. M., et al. 2018, MNRAS, 477, 830
- Inayoshi et al. (2020) Inayoshi, K., Visbal, E., & Haiman, Z. 2020, ARA&A, 58, 27
- Jolley & Kuncic (2008) Jolley, E. J. D. & Kuncic, Z. 2008, MNRAS, 386, 989
- Kubota & Done (2019) Kubota, A. & Done, C. 2019, MNRAS, 489, 524
- Li et al. (2005) Li, L.-X., Zimmerman, E. R., Narayan, R., & McClintock, J. E. 2005, ApJS, 157, 335
- Liu et al. (2021) Liu, Y., Wang, R., Momjian, E., et al. 2021, ApJ, 908, 124
- Napier et al. (2020) Napier, K., Foord, A., Gallo, E., et al. 2020, MNRAS, 498, 1550
- Neeleman et al. (2021) Neeleman, M., Novak, M., Venemans, B. P., et al. 2021, ApJ, 911, 141
- Novikov & Thorne (1973) Novikov, I. D. & Thorne, K. S. 1973, in Black Holes (Les Astres Occlus), 343–450
- O’Dea (1998) O’Dea, C. P. 1998, PASP, 110, 493
- O’Dea & Saikia (2021) O’Dea, C. P. & Saikia, D. J. 2021, A&A Rev., 29, 3
- Pacucci & Loeb (2020) Pacucci, F. & Loeb, A. 2020, ApJ, 889, 52
- Padovani (2016) Padovani, P. 2016, A&A Rev., 24, 13
- Perley & Meisenheimer (2017) Perley, R. A. & Meisenheimer, K. 2017, A&A, 601, A35
- Regan et al. (2019) Regan, J. A., Downes, T. P., Volonteri, M., et al. 2019, MNRAS, 486, 3892
- Salpeter (1964) Salpeter, E. E. 1964, ApJ, 140, 796
- Sbarrato (2021) Sbarrato, T. 2021, Galaxies, 9, 23
- Sbarrato et al. (2012) Sbarrato, T., Ghisellini, G., Nardini, M., et al. 2012, MNRAS, 426, L91
- Sbarrato et al. (2013a) Sbarrato, T., Ghisellini, G., Nardini, M., et al. 2013a, MNRAS, 433, 2182
- Sbarrato et al. (2015) Sbarrato, T., Ghisellini, G., Tagliaferri, G., et al. 2015, MNRAS, 446, 2483
- Sbarrato et al. (2013b) Sbarrato, T., Tagliaferri, G., Ghisellini, G., et al. 2013b, ApJ, 777, 147
- Shakura & Sunyaev (1973) Shakura, N. I. & Sunyaev, R. A. 1973, A&A, 500, 33
- Shao et al. (2019) Shao, Y., Wang, R., Carilli, C. L., et al. 2019, ApJ, 876, 99
- Shen et al. (2020) Shen, X., Hopkins, P. F., Faucher-Giguère, C.-A., et al. 2020, MNRAS, 495, 3252
- Skrutskie et al. (2006) Skrutskie, M. F., Cutri, R. M., Stiening, R., et al. 2006, AJ, 131, 1163
- Spingola et al. (2020) Spingola, C., Dallacasa, D., Belladitta, S., et al. 2020, A&A, 643, L12
- Thorne (1974) Thorne, K. S. 1974, ApJ, 191, 507
- Venemans et al. (2016) Venemans, B. P., Walter, F., Zschaechner, L., et al. 2016, ApJ, 816, 37
- Volonteri (2012) Volonteri, M. 2012, Science, 337, 544
- Wang et al. (2015) Wang, F., Wu, X.-B., Fan, X., et al. 2015, ApJ, 807, L9
- Wang et al. (2017) Wang, R., Momjian, E., Carilli, C. L., et al. 2017, ApJ, 835, L20
- Wang et al. (2016) Wang, R., Wu, X.-B., Neri, R., et al. 2016, ApJ, 830, 53
- Wright et al. (2010) Wright, E. L., Eisenhardt, P. R. M., Mainzer, A. K., et al. 2010, AJ, 140, 1868
- Wu et al. (2015) Wu, X.-B., Wang, F., Fan, X., et al. 2015, Nature, 518, 512
- York et al. (2000) York, D. G., Adelman, J., Anderson, John E., J., et al. 2000, AJ, 120, 1579