The BIG X-ray tail
Abstract
Galaxy clusters grow primarily through the continuous accretion of group-scale haloes. Group galaxies experience preprocessing during their journey into clusters. A star-bursting compact group, the Blue Infalling Group (BIG), is plunging into the nearby cluster A1367. Previous optical observations reveal rich tidal features in the BIG members, and a long H trail behind. Here we report the discovery of a projected kpc X-ray tail behind the BIG using Chandra and XMM-Newton observations. The total hot gas mass in the tail is with an X-ray bolometric luminosity of erg s-1. The temperature along the tail is keV, but the apparent metallicity is very low, an indication of the multi- nature of the gas. The X-ray and H surface brightnesses in the front part of the BIG tail follow the tight correlation established from a sample of stripped tails in nearby clusters, which suggests the multiphase gas originates from the mixing of the stripped interstellar medium (ISM) with the hot intracluster medium (ICM). Because thermal conduction and hydrodynamic instabilities are significantly suppressed, the stripped ISM can be long lived and produce ICM clumps. The BIG provides us a rare laboratory to study galaxy transformation and preprocessing.
keywords:
galaxies: clusters: individual: Abell 1367 – galaxies: clusters: intracluster medium – galaxies: groups: general – X-rays: galaxies: clusters1 INTRODUCTION
Galaxies evolve during hierarchical structure formation. The key to galaxy evolution is gas removal, which can be caused by internal and external mechanisms. Internal mechanisms include star formation (SF) and active galactic nucleus (AGN) feedback. External mechanisms include gravitational (e.g. galaxy-galaxy tidal interactions) and hydrodynamic interactions (e.g. ram pressure stripping; RPS). Hybrid processes of gravitational and hydrodynamic interactions acting on galaxies referred to as ‘preprocessing’, happen when galaxy groups fall into clusters (e.g. Boselli & Gavazzi 2006).
An actively star-bursting compact group is infalling into the core of A1367, a dynamically young merging cluster (e.g. Bechtold et al. 1983; Sun & Murray 2002; Cortese et al. 2004). The group was discovered in the H survey of nearby clusters by Sakai et al. (2002). Its presence was also revealed in the H data by Iglesias-Páramo et al. (2002) and Gavazzi et al. (2003) who named it the Blue Infalling Group (BIG). Cortese et al. (2006) presented deep H imaging and multislit spectroscopy of the BIG, and suggested that the BIG experiences preprocessing. They also found that H stream extends kpc to the NW. Yagi et al. (2017) reported that the H extends much further; the BIG+tail are kpc ( kpc for tail only) in projection. Fossati et al. (2019) suggested the BIG is shaped by the mutual influence of gravitational interactions and RPS, based on the VLT/MUSE observations.
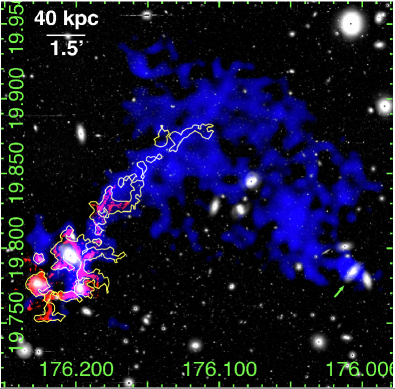
Here, we present the discovery of a kpc X-ray tail behind the BIG based on the Chandra and XMM-Newton observations (Fig. 1). We assume a cosmology with = 70 km s-1 Mpc-1, , and . At the A1367 redshift of , kpc.
2 DATA ANALYSIS
Table 1 lists the relevant Chandra and XMM observations. We reduce the Chandra observations with the Chandra Interactive Analysis of Observation (CIAO; version 4.11) and Calibration Database (CALDB; version 4.8.2), following the procedures in Ge et al. (2018). We process the XMM data using the Extended Source Analysis Software (ESAS), as integrated into the XMM Science Analysis System (SAS; version 17.0.0), following the procedures in Ge et al. (2019a). We use the AtomDB (version 3.0.8) database of atomic data and the Solar abundance tables from Asplund et al. (2009). The Galactic column density, , is taken from the NHtot tool (Willingale et al., 2013).
| Obs-ID | PI | Date | Exposure (ks)a |
|---|---|---|---|
| Chandra | |||
| 514 | Murray | 2000-02-26 | 40.5/38.4 |
| 4189 | Vikhlinin/Sun | 2003-01-24 | 47.5/42.4 |
| 17199 | Forman | 2015-01-30 | 37.9/37.7 |
| 17200 | Forman | 2015-11-05 | 39.6/39.4 |
| 17201 | Forman | 2016-01-31 | 61.3/61.1 |
| 17589 | Forman | 2015-01-31 | 24.8/24.8 |
| 17590 | Forman | 2015-02-01 | 36.6/36.4 |
| 17591 | Forman | 2015-02-03 | 34.9/34.9 |
| 17592 | Forman | 2015-02-08 | 25.7/25.7 |
| 18704 | Forman | 2015-11-08 | 27.0/26.4 |
| 18705 | Forman | 2015-11-14 | 23.8/23.6 |
| 18755 | Forman | 2016-02-03 | 48.4/48.4 |
| XMM | |||
| 0005210101 | Fusco-Femiano | 2001-11-22 | 32.9(28.5)/26.1(14.9) |
| 0061740101 | Forman | 2001-05-26 | 32.6(28.0)/29.1(17.4) |
| 0301900601 | Wolter | 2006-05-27 | 29.6(27.9)/19.6(13.0) |
| 0602200101 | Finoguenov | 2009-05-27 | 24.6(20.7)/22.6(14.0) |
| 0602200201 | Finoguenov | 2009-06-18 | 13.6(9.7)/12.5(7.0) |
| 0602200301 | Finoguenov | 2009-11-25 | 22.1(19.5)/5.7(0.8) |
| 0823200101 | Sun | 2018-06-01 | 71.6(69.8)/66.4(50.4) |
| 0864410101 | Ge | 2020-12-05 | 40(38.1)/32.8(18.2) |
-
•
a: Total/clean exposure time, for XMM, the exposure times are different from MOS and pn (in brackets).
3 RESULTS
3.1 Imaging properties
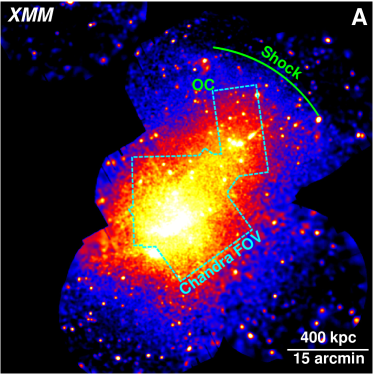
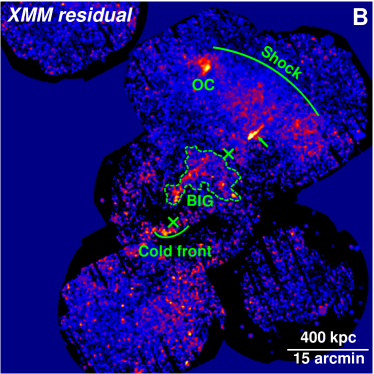
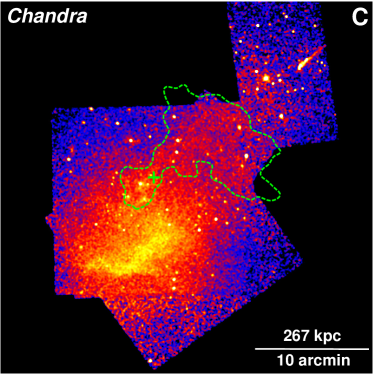
The BIG is projected between the centres of two subclusters of A1367 (Ge et al., 2021). The X-ray emission at its position is dominated by the cluster ICM emission. While the X-ray excess behind the BIG is readily visible from both the Chandra and XMM images (Fig. 2), the average cluster emission was subtracted to enhance the BIG feature. We use two superimposed -models to fit the ICM X-ray emission based on the XMM data as detailed in Ge et al. (2021). The X-ray tail of the BIG is revealed after subtracting the best-fit cluster ICM component from the original XMM image as shown in Fig. 2. After converting the count rates, in different X-ray bands, based on the ICM spectral model and response files from different instruments, the same best-fit ICM models are also subtracted from the Chandra image to derive the residual Chandra image in Fig. 2. Churazov et al. (2012) found, for the Coma cluster, the large-scale fluctuations are model-dependent, while the perturbations smaller than several hundred kpc are model-insensitive. This conclusion can be applied to A1367, as both clusters are at nearly the same distance. To test the above argument, we also try the 2D elliptical -models and patched -models (Zhuravleva et al., 2015) to fit the X-ray emission of A1367, and conclude that the shown residual feature from the BIG is robust.
To increase the signal-to-noise ratio, we further merge the residual diffuse Chandra and XMM images. We firstly downgrade the resolution of the Chandra image to match the XMM image. We then rescale the Chandra image to the XMM image according to a ratio from their mean values within the overlapping field-of-view (FOV) marked as a dashed polygon in Fig. 2(A). Finally, we add the rescaled Chandra image to the XMM image and take an average value within their overlapping FOV. This method enhances the contrast between the real structure and background, because the background fluctuations are smoothed and suppressed. The resultant merged residual image is included in Fig. 1. The X-ray tail extends kpc in projection behind the extragalactic H ii knot K1 (Sakai et al. 2002; Cortese et al. 2006) marked as a plus in Fig. 2(C).
3.2 Spectral properties
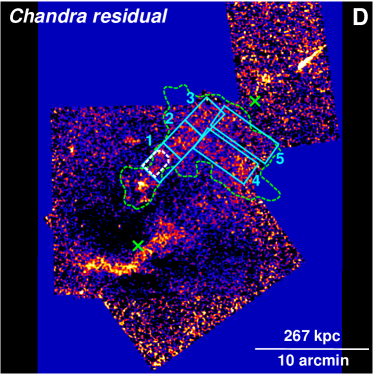
Background modeling is crucial to recover the relatively faint X-ray emission from the BIG tail. We extract on-source BIG tail spectra within the box regions in Fig. 2(D) and off-source local background spectra from the Chandra and XMM data, respectively. We apply the double-background subtraction method to jointly fit the spectra from different instruments (e.g. Ge et al. 2019a). Firstly, the instrumental non X-ray background (NXB) spectra are extracted from the stowed data sets for Chandra, and from the filter-wheel closed data sets for XMM. These rescaled NXB spectra are then loaded into XSPEC as the background spectra. Secondly, the X-ray backgrounds, including the sky and ICM components, are properly modeled in XSPEC. The ICM component is fitted by an absorbed APEC (, ). Because the ICM emission varies across the on-source and off-source regions, their contributions are rescaled by the ratio from the same regions of a mock ICM image based on the above two -model fitting. The sky components are represented by an unabsorbed APEC (, from the local hot bubble), an absorbed APEC (, Galactic background), and an absorbed POWERLAW (, AGN dominated background). The best-fit parameters of the sky components are from a fit to the global spectra with a much larger coverage. The sky contributions of on-source and off-source regions are linked by their sky solid angles. The X-ray emission of the BIG tail in the on-source region is fitted with an additional absorbed APEC model, whose normalization is fixed to zero in the off-source region. The best-fit results are included in Table 2.
The X-ray signal is dominated by the ICM component. X-ray surface brightness fluctuations on scales of kpc are around 5%, estimated from the ratio between the RMS of the residual image and the best-fit ICM model image. As shown in Table 2, we manually vary the ICM normalization by 5%, and find that the BIG tail is still robustly detected. We further split the BIG tail into five sub-regions in Fig. 2(D). Their spectral fits are listed in Table 2. Their overall temperature is around 1 keV, and their metallicity is lower than the typical value in groups (0.2-0.4 Solar; Gastaldello et al. 2021). The apparently low metallicity may suggest the intrinsically multi- gas in the stripped tail and/or non-equilibrium ionization (e.g. Sun et al. 2010).
| Regiona | ()b | C-stat/d.o.f |
| 1-3 | 4834/4609 | |
| 1-3 (ICM 5%) | 4833/4609 | |
| 1-3 (ICM 5%) | 4850/4609 | |
| 1 | 3622/3389 | |
| 2 | 3573/3286 | |
| 3 | 3246/3086 | |
| 4 | 1133/1014 | |
| 5 | 1177/1058 |
-
•
The regions are shown in Fig. 2(D). The main BIG tail is composed of regions 1-3. The BIG tail is robust even if ICM fluctuations (5% level) are taken into account. The best-fit (keV) and metallicity (Solar) of the APEC model.
4 DISCUSSION
4.1 Stripped multiphase gas of the BIG
In Fig. 1, the cometary trails of the stripped hot gas behind the BIG resemble a cone. The BIG galaxies are at the cone tip and there is a certain inclination angle of the cone axis with respect to the plane of the sky. The cone asymmetry may be due to projection effects if the BIG is infalling into A1367 with a non-zero impact parameter resulting in a curved path or tail and has a substantial velocity along the line of sight (e.g. Eckert et al. 2017), which is very likely because the velocity of the BIG is km s-1 higher than A1367 (e.g. Cortese et al. 2004). The innermost tail is relatively narrow and has H emission, which indicates that its gas is freshly stripped from the ISM of the BIG galaxies. While the outermost tail is much wider and diffuse. It may be stripped from the group hot intergalactic medium (hIGM) gas, which has lower thermal pressure and can be stripped first, it has been mixed with the A1367 ICM and becomes wider probably due to turbulent diffusion (e.g. Eckert et al. 2017). We can estimate the average density of hot gas from the APEC normalization (e.g. Ge et al. 2021), assuming a uniform density distribution within a cone volume with an altitude of kpc and a circular base diameter of kpc. The resultant average electron gas density is , the total hot gas mass is , and the total X-ray bolometric luminosity is in the cone. If we focus on the bright main tail behind the BIG within regions 1-3 in Fig. 2(D), we can also assume a uniform density distribution in a cylinder with a height of 220 kpc and a circular base diameter of kpc. The average electron gas density is , the total hot gas mass is , and the total X-ray bolometric luminosity is in the cylinder.
When stripped tails move in the ICM, thermal conduction and hydrodynamic instabilities (e.g. Rayleigh-Taylor and Kelvin-Helmholtz instabilities) can destroy the tails on a relatively short timescale. However, observations suggest that both thermal conduction and hydrodynamic instabilities are highly suppressed, maybe due to magnetic fields (e.g. Markevitch & Vikhlinin 2007). If we assume a tangential velocity in the plane of the sky of 800 km s-1 for the BIG (Yagi et al., 2017), the stripped kpc long tail (in projection) has survived for at least 300 Myr. Therefore, the stripped tails can survive for a long time and produce gas inhomogeneities or clumping in ICM, which is important to cluster cosmology and baryon physics (e.g. Ichinohe et al. 2015; Ge et al. 2021).
The warm gas tail behind the BIG, traced by H emission, extends 184 kpc 45 kpc with a mass of for a volume filling factor of 1 (Yagi et al., 2017). The cold gas tail traced by H i has a mass of (BIG-NW region of Cortese et al. 2006). Both the H (Fossati et al., 2019) and H i (Cortese et al., 2006) tails experience a progressive velocity decrease from the BIG. This suggests that the multiphase gas is decelerated relative to the BIG due to the friction with the ICM after stripping.
We compare the X-ray and H surface brightness of the diffuse gas in the front part of the BIG tail as shown in Fig. 2(D), where the robust H flux from MUSE is available (Fossati et al., 2019). The X-ray-to-H emission ratio is 4.01.4, which is consistent with the average ratio of 3.5 established from a sample of stripped tails in nearby galaxy clusters (Sun et al., 2021). The correlation suggests the multiphase gas in tails originates from the mixing of the stripped ISM with the hot ICM. Further X-ray/H comparison requires deeper H data with good flux calibration throughout the BIG X-ray tail. The role of magnetic fields in the stretched tail could also be important (e.g. Churazov et al., 2013).
4.2 Nature of the BIG
The generally conical RPS tail behind the BIG resembles other subcluster mergers in clusters like A2142 (Eckert et al., 2017), A85 (Ichinohe et al., 2015), and Coma cluster (Churazov et al., 2021). However, these infall subclusters are not star-bursting and have no report of H tails. By contrast, the BIG is a spiral-rich group with the highest density of star formation activity (total SFR ) in local clusters (Cortese et al., 2006). Moreover, very few hIGM haloes have been observed in spiral-rich groups, and their origins are still under debate (e.g. O’Sullivan et al. 2014). Interestingly, the NGC 4839 group is infalling into the Coma cluster along the direction of the Coma-A1367 filament, while the BIG is infalling into the A1367 along a filament connecting A1367 with the Virgo cluster (e.g. West & Blakeslee 2000).
We can estimate the total mass of the BIG based on the virial theorem: , where and km s-1 is the radial velocity dispersion of group members (Cortese et al., 2006); kpc is the size of BIG. Alternatively, we can also infer the mass from the X-ray properties. The relation (e.g. Leauthaud et al. 2010) indicates , which may be underestimated as some gas has been stripped. The relation (e.g. Sun et al. 2009) indicates . The mass from X-ray properties is a few , which is one order of magnitude larger than from the virial theorem. However, is probably underestimated because it is from only a few BIG members in a very compact region. If increases by a factor of to km s-1 and , the mass discrepancy from different methods can be alleviated. In fact, such a high is suggested by the kinematics of ionized gas (Fossati et al., 2019), though the gas is disturbed by tidal interactions and RPS. The mass of A1367 is from a mean keV (Sun et al., 2009). The merger mass ratio between A1367 and the BIG is , which is a minor merger.
The perturbed stellar morphology/kinematics, tidal dwarfs, and a complex of ionized gas filaments suggest that the BIG members are suffering from gravitational interactions (Cortese et al. 2006; Fossati et al. 2019). The ISM stripped by tidal forces is further stripped by RPS when the BIG enters A1367. Multiphase gas including cold (Cortese et al., 2006), warm (Fossati et al., 2019), and hot gas has been observed between BIG members (tidal origin) and behind the BIG (RPS origin). Fig. 1 shows a clear positional correlation between warm and hot gas, especially between the BIG members and in the main tail. The winding feature of H tails in Fig. 1 imprints the gas motion being tidally stripped out of galaxies (Yagi et al., 2017). Besides the BIG, CGCG 097-093 also has hybrid features of tidal interaction and RPS (e.g. Yagi et al. 2017). As shown in the lower-right corner of Fig. 1, its stripped X-ray and H (Yagi et al., 2017) tails extend towards the NE with a length around 30 kpc.
5 SUMMARY
The BIG was discovered in previous H surveys of nearby clusters. Its galaxies are undergoing preprocessing via tidal interactions and RPS. In particular, a long H tail of stripped gas is found behind the BIG. Based on the X-ray-H correlation in stripped tails (Sun et al., 2021), we may expect a long X-ray tail behind the BIG. However, the BIG is projected near the core of A1367, where the X-ray emission is dominated by the ICM. Nevertheless, using Chandra and XMM data, after subtracting the ICM component of A1367, we discover a projected kpc X-ray tail behind the BIG. The stripped tail has survived for at least 300 Myr, and may contribute to ICM inhomogeneities or clumping.
The continual accretion of infalling groups is one of the main mechanisms to feed the growth of clusters. Compared with relatively rare major cluster mergers, minor mergers between clusters and groups are more prevalent. Combining future wide-field H and X-ray surveys, more cases of infalling groups will be revealed to study the details of structure formation, ICM clumping, and galaxy preprocessing.
ACKNOWLEDGEMENTS
Support for this work was provided by the NASA grants 80NSSC19K0953 and 80NSSC19K1257 and the NSF grant 1714764. M.F. has received funding from the European Research Council (ERC) under the European Union’s Horizon 2020 research and innovation programme (grant agreement No 757535). W.F. and C.J. acknowledge support from the Smithsonian Institution and the Chandra High Resolution Camera Project through NASA contract NAS8-03060. This research is based in part on data collected at Subaru Telescope, which is operated by the National Astronomical Observatory of Japan. We are honored and grateful for the opportunity of observing the Universe from Maunakea, which has the cultural, historical and natural significance in Hawaii.
DATA AVAILABILITY
The Chandra and XMM raw data used in this paper are available to download at the HEASARC Data Archive website (https://heasarc.gsfc.nasa.gov/docs/archive.html). The reduced data underlying this paper will be shared on reasonable requests to the corresponding authors.
References
- Asplund et al. (2009) Asplund M., Grevesse N., Sauval A. J., Scott P., 2009, ARA&A, 47, 481
- Bechtold et al. (1983) Bechtold J., Forman W., Giacconi R., Jones C., Schwarz J., Tucker W., van Speybroeck L., 1983, ApJ, 265, 26
- Boselli & Gavazzi (2006) Boselli A., Gavazzi G., 2006, PASP, 118, 517
- Churazov et al. (2012) Churazov E., et al., 2012, MNRAS, 421, 1123
- Churazov et al. (2013) Churazov E., Ruszkowski M., Schekochihin A., 2013, MNRAS, 436, 526
- Churazov et al. (2021) Churazov E., Khabibullin I., Lyskova N., Sunyaev R., Bykov A. M., 2021, A&A, 651, A41
- Cortese et al. (2004) Cortese L., Gavazzi G., Boselli A., Iglesias-Paramo J., Carrasco L., 2004, A&A, 425, 429
- Cortese et al. (2006) Cortese L., Gavazzi G., Boselli A., Franzetti P., Kennicutt R. C., O’Neil K., Sakai S., 2006, A&A, 453, 847
- Eckert et al. (2017) Eckert D., et al., 2017, A&A, 605, A25
- Fossati et al. (2019) Fossati M., Fumagalli M., Gavazzi G., Consolandi G., Boselli A., Yagi M., Sun M., Wilman D. J., 2019, MNRAS, 484, 2212
- Gastaldello et al. (2021) Gastaldello F., Simionescu A., Mernier F., Biffi V., Gaspari M., Sato K., Matsushita K., 2021, Universe, 7, 208
- Gavazzi et al. (2003) Gavazzi G., Cortese L., Boselli A., Iglesias-Paramo J., Vílchez J. M., Carrasco L., 2003, ApJ, 597, 210
- Ge et al. (2018) Ge C., Wang Q. D., Burchett J. N., Tripp T. M., Sun M., Li Z., Gu Q., Ji L., 2018, MNRAS, 481, 4111
- Ge et al. (2019a) Ge C., Sun M., Rozo E., Sehgal N., Vikhlinin A., Forman W., Jones C., Nagai D., 2019a, MNRAS, 484, 1946
- Ge et al. (2019b) Ge C., et al., 2019b, MNRAS, 486, L36
- Ge et al. (2021) Ge C., et al., 2021, MNRAS, 505, 4702
- Ichinohe et al. (2015) Ichinohe Y., Werner N., Simionescu A., Allen S. W., Canning R. E. A., Ehlert S., Mernier F., Takahashi T., 2015, MNRAS, 448, 2971
- Iglesias-Páramo et al. (2002) Iglesias-Páramo J., Boselli A., Cortese L., Vílchez J. M., Gavazzi G., 2002, A&A, 384, 383
- Leauthaud et al. (2010) Leauthaud A., et al., 2010, ApJ, 709, 97
- Markevitch & Vikhlinin (2007) Markevitch M., Vikhlinin A., 2007, Phys. Rep., 443, 1
- O’Sullivan et al. (2014) O’Sullivan E., et al., 2014, ApJ, 793, 74
- Sakai et al. (2002) Sakai S., Kennicutt Robert C. J., van der Hulst J. M., Moss C., 2002, ApJ, 578, 842
- Sun & Murray (2002) Sun M., Murray S. S., 2002, ApJ, 576, 708
- Sun et al. (2009) Sun M., Voit G. M., Donahue M., Jones C., Forman W., Vikhlinin A., 2009, ApJ, 693, 1142
- Sun et al. (2010) Sun M., Donahue M., Roediger E., Nulsen P. E. J., Voit G. M., Sarazin C., Forman W., Jones C., 2010, ApJ, 708, 946
- Sun et al. (2021) Sun M., et al., 2021, arXiv e-prints, p. arXiv:2103.09205
- West & Blakeslee (2000) West M. J., Blakeslee J. P., 2000, ApJ, 543, L27
- Willingale et al. (2013) Willingale R., Starling R. L. C., Beardmore A. P., Tanvir N. R., O’Brien P. T., 2013, MNRAS, 431, 394
- Yagi et al. (2017) Yagi M., Yoshida M., Gavazzi G., Komiyama Y., Kashikawa N., Okamura S., 2017, ApJ, 839, 65
- Zhuravleva et al. (2015) Zhuravleva I., et al., 2015, MNRAS, 450, 4184