Molecules with ALMA at Planet-forming Scales (MAPS). VII. Sub-stellar O/H and C/H and super-stellar C/O in planet feeding gas
Abstract
The elemental composition of the gas and dust in a protoplanetary disk influences the compositions of the planets that form in it. We use the Molecules with ALMA at Planet-forming Scales (MAPS) data to constrain the elemental composition of the gas at the locations of potentially forming planets. The elemental abundances are inferred by comparing source-specific gas-grain thermochemical models, with variable C/O ratios and small-grain abundances, from the DALI code with CO and \ceC2H column densities derived from the high-resolution observations of the disks of AS 209, HD 163296, and MWC 480. Elevated C/O ratios (), even within the CO ice line, are necessary to match the inferred \ceC2H column densities, over most of the pebble disk. Combined with constraints on the CO abundances in these systems, this implies that both the O/H and C/H ratios in the gas are substellar by a factor of 4–10, with the O/H depleted by a factor of 20–50, resulting in the high C/O ratios. This necessitates that even within the CO ice line, most of the volatile carbon and oxygen is still trapped on grains in the midplane. Planets accreting gas in the gaps of the AS 209, HD 163296, and MWC 480 disks will thus acquire very little carbon and oxygen after reaching the pebble isolation mass. In the absence of atmosphere-enriching events, these planets would thus have a strongly substellar O/H and C/H and superstellar C/O atmospheric composition. This paper is part of the MAPS special issue of the Astrophysical Journal Supplement.
1 Introduction
More than 10% of stars are thought to host a Jupiter-sized planet (Johnson et al., 2010; Winn & Fabrycky, 2015). Current observational campaigns are probing the atmospheric composition of these gas giants, with future instruments promising better characterization of more gas giants (e.g. Madhusudhan et al., 2014; Sing et al., 2016; Greene et al., 2016). These composition measurements place constraints on the process of planet formation and evolution by comparison of the composition of protoplanetary disks and the planets that formed within them (e.g. Madhusudhan et al., 2016). Achieving that goal will require measurements of the elemental composition of disks, particularly around substructures (e.g., gaps) in the millimeter disk, that are likely opened by young planets (e.g. Paardekooper & Mellema, 2006; Rosotti et al., 2016; Zhang et al., 2018).
The composition of a planet is predicted to depend on the location of formation (e.g. Öberg et al., 2011; Cridland et al., 2017; Öberg & Bergin, 2020), particularly relative to the ice/gas transitions (ice lines) of major volatile carriers such as \ceCO, \ceCO2, \ceH2O, \ceN2, and \ceNH3. Further studies have shown that the transport of ices via sedimentation and inward drift of pebbles also has a significant impact on the composition of the gas and ice that can be accreted by planets (Ciesla & Cuzzi, 2006; Piso et al., 2015; Booth et al., 2017; Booth & Ilee, 2019; Krijt et al., 2020). All of these studies assume that the disk material has a volatile interstellar-medium (ISM) elemental composition with various additional assumptions regarding chemistry and disk dynamics. The model-to-model variations create significant uncertainties for predicting planetary composition (e.g. Eistrup et al., 2016; Booth et al., 2017).
A more direct link between the composition and formation location of a giant planet could be made by comparing the elemental composition of the material at the specific radial locations or sites of planet formation with present-day gas giant exoplanet atmospheric composition. On top of this, a measurement of the elemental composition of the disk during planet formation can act as an intermediary calibration point to improve the accuracy of population synthesis models (e.g., Mordasini et al., 2009).
Accurately measuring the elemental composition of the disk requires an observational data set that covers many different molecular species, as well as a physical understanding of the regions being probed by the observations (e.g. Bergin et al., 2016; Trapman et al., 2017; Cleeves et al., 2018; Bosman et al., 2019). This limits the derivation of elemental composition to disks with a broad range of observations and with a good physical model available. With the Molecules with ALMA at Planet-forming Scales (MAPS) data and ancillary modeling efforts (Oberg et al., 2021; Zhang et al., 2021)111http://www.alma-maps.info, the disks in the MAPS sample are perfect objects for an elemental composition study, especially as the high-resolution of the data allows for a radially resolved measurement of the elemental composition.
In this paper, we will focus on the carbon and oxygen abundances, which are derived by comparison of models directly to the high-resolution MAPS data that resolve putative sites of incipient giant planet formation. The carbon and oxygen abundances in the disk will be derived using constraints on the CO column from Zhang et al. (2021) and the \ceC2H column from Guzmán et al. (2021). CO is used to constrain the available total C or O column (e.g., C/H and O/H), and we use the known dependency of \ceC2H on the carbon-to-oxygen (C/O) ratio to determine the C/O ratio in the disk gas (e.g. Bergin et al., 2016; Miotello et al., 2019; Bosman et al., 2021a). A focus on the C/O ratio in the disk gas is well matched to the available volatile abundance measurements of exoplanetary atmospheres (Madhusudhan et al., 2014; Greene et al., 2016; Madhusudhan, 2019).222We note that nitrogen abundance can also be indicative of a planet’s origin (Cridland et al., 2017), and that it is possible to constrain the nitrogen abundance within protoplanetary disks (Cleeves et al., 2018), which will be the subject of future work.
2 Methods
2.1 Source selection
We will focus on three of the five disks targeted by MAPS: the disks around AS 209, HD 163296, and MWC 480. All three of these disks have deep gaps in the millimeter emission indicative of ongoing planet formation (see Fig. 1; Andrews et al., 2018; Huang et al., 2018; Zhang et al., 2018; Guzmán et al., 2018; Long et al., 2018; Liu et al., 2019), as well as gas velocity structures thought to be perturbations induced by unseen planets in these gaps (Pinte et al., 2018; Teague et al., 2018, 2019, 2021). We leave out the disks around IM Lup and GM Aur. The composition of the IM Lup disk has already been discussed in detail in Cleeves et al. (2018). The GM Aur disk is accreting new material, influencing the chemical composition of the disk (Huang et al., 2021; Schwarz et al., 2021), complicating modeling of the disk.
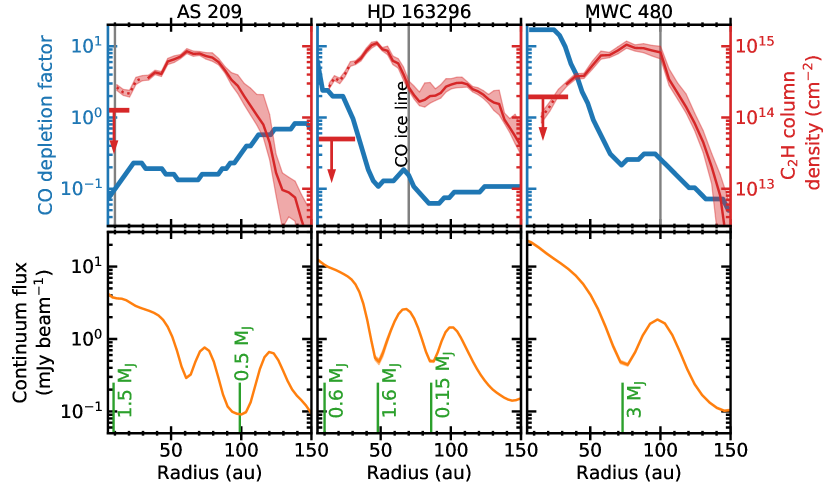
Furthermore, in these disks, we will focus on the gas on the scale of the millimeter disk, that is, the size of the disk in the millimeter continuum, using these large grains as a signpost of active planet formation. Fig. 1 shows millimeter continuum radial profiles, rich in structure, for the three disks that are studied together with the planet masses that are inferred to cause these structures (Zhang et al., 2018; Liu et al., 2019; Sierra et al., 2021)333All planet masses assume a viscous (Shakura & Sunyaev, 1973) of 10-3. All three disks show potentially planet-induced dust structure that is clearly seen at with the resolution of the MAPS continuum data (01 01 Sierra et al., 2021). The MAPS data are thus able to distinguish the gap region from the surrounding disk material.
Our focus is understanding the chemical composition of localized regions associated with incipient planet formation. In the AS 209 disk, the structures of interest are the gaps at 61 and 105 au, straddling a bright ring at 74 au (Guzmán et al., 2018). These are all well outside of the CO ice line, which is located around 15 au (Zhang et al., 2021; Alarcón et al., 2021). In the HD 163296 disk, we will focus on the dust gaps at 48 and 86 au, with one gap inside and one gap outside the ice line at 70 au (Isella et al., 2018; Zhang et al., 2020a, 2021; Calahan et al., 2021). Finally, for the MWC 480 disk we focus on the 74 au gap, which is inside the CO ice line at 100 au (Liu et al., 2019; Zhang et al., 2021). We disregard the inner 10 au, as an accurate \ceCO column density has not been derived for this region (Zhang et al., 2021).
To constrain the oxygen and carbon elemental abundances in the three selected disks we base ourselves on results and models developed within the MAPS ALMA large program (Oberg et al., 2021). For \ceC2H the column density derived in Guzmán et al. (2021) is used. These column densities are derived from the imagecube by fitting the different \ceC2H hyperfine components. The \ceC2H column density derived from the images is uncertain within 30 au. As such we derive a separate constraint on the \ceC2H column within 30 au using the kinematic information in the line profile. This is discussed in Appendix A. The shown upper limits in Fig. 1 assume a column of \ceC2H that is constant in the inner 20 (AS 209) or 30 (HD 163296 and MWC 480) au.
We adopt the CO depletion factor Zhang et al. (2021) derived from the observed CO isotopologues radial profiles (Law et al., 2021a). Zhang et al. (2021) build disk-specific models based on high-resolution continuum and CO isotopologue (13CO and C18O) line data. A total gas-to-dust mass ratio of 100 is assumed, with the gas disk size set by the extent of CO isotopologue emission. Gas and small dust (0.005 m - 1m) are well coupled and have the standard tapered-power law surface density distribution and a vertical Gaussian density distribution (see Zhang et al., 2021, for the disk parameters). The large dust is settled, at 0.2 times the gas scale height and is structured to match the observed millimeter structure (see, Zhang et al., 2021, Tables 1 and 2 and Fig. 5). The CO abundance in the disk is then varied until the model CO isotopologue line emission matches the observed line emission for \ce^13CO and \ceC^18O for both the 2-1 and 1-0 transitions. The ratio between the abundance necessary to reproduce that data and the ISM CO abundance is called the CO depletion factor. The model CO columns are consistent with the CO column derived from the hyperfine lines of \ceC^17O in the regions the latter is detected. Both the \ceC2H column and the CO depletion factor are shown in Fig. 1.
2.2 \ceC2H chemistry
The chemistry of \ceC2H and its use as a tracer of the elemental C/O ratio in protoplanetary disks has been discussed for a variety of sources and conditions (e.g. Jansen et al., 1995; Nagy et al., 2015; Bergin et al., 2016; Cleeves et al., 2018; Bosman et al., 2021a). As a radical it is most abundant in regions with an active photo-chemistry, where it is continuously produced and destroyed. The chemistry of \ceC2H is tightly linked to that of \ceCH4 and \ceC2H2, which is the main reservoir of carbon that is not locked in CO. \ceC2H can be directly formed by photo-dissociation of \ceC2H2 or it is formed by dissociative recombination of the \ceC2H2+ and \ceC2H3+ ions, which are part of a gas-phase hydrocarbon radical and ion cycle (see, for example, Fig. 1 of Bosman et al., 2021a).
The \ceC2H abundance is very dependent on the C/O ratio in the gas, with reactions as \ceC2H + O -¿ CO + CH and \ceCH + O -¿ CO + H, directly driving down the \ceC2H abundance as well as removing carbon from the hydrocarbon reservoir. Reactions generally result in the formation of CO, which is stable against photo-dissociation (van Dishoeck & Black, 1988). As such this carbon is no longer available for hydrocarbon chemistry. Depending on the physical structure of the disk and the stellar radiation field, the \ceC2H column density in a disk model can vary by four orders of magnitude, just by variations of the C/O ratio between 0.5 and 2.0 (Bergin et al., 2016; Cleeves et al., 2018). This makes \ceC2H a very good tracer of the C/O ratio.
As a radical \ceC2H traces the photo-dissociation region (PDR) layers of the disk. At low C/O ratios, all carbon for \ceC2H comes from the dissociation of \ceCO, which happens only in the top layer of the disk PDR, where CO self-shielding is not yet active. The mass in this thin layer is relatively constant in a disk, as well as disk-to-disk as it depends on a fundamental property of the CO molecule, which starts to self-shield at a column of cm-2 (van Dishoeck & Black, 1988). At C/O ratios above 1 the carbon for the formation of \ceC2H can be extracted from hydrocarbons as \ceCH4 and \ceC2H2. The thickness of the layer in which these hydrocarbons can be dissociated depends on UV attenuation by dust. The small dust content of the disk atmosphere thus has an effect on the measured \ceC2H column. Initial calculations in Bosman et al. (2021a) predict that the small dust content will impact the \ceC2H abundance, but is relatively weak. An order of magnitude drop in small dust abundance should only lead to an increase in the \ceC2H abundance by a factor two.
2.3 Modeling setup
In our modeling we start with the model structure and CO depletion factor as derived by Zhang et al. (2021). We vary the C/O ratio and the amount of small dust in the surface layers as these parameters have the most impact of the \ceC2H abundance. The small dust content of the disks is varied by multiplying the small dust abundances by a constant factor of 0.001, 0.01, 0.1 or 1 from the base models of Zhang et al. (2021). The last of these are the fiducial dust structures and are identical to those used in Zhang et al. (2021).444For models with lower small-grain abundances the model SED no longer fits the observational SED. Each model has a constant C/O ratio of either 0.47, 1.0, or 2.0. These correspond to the volatile ISM level (0.47), CO dominated gas (1.0) and a high C/O value (2.0). Increasing the C/O ratio above 2.0 no longer has an impact of the \ceC2H abundance (e.g., Cleeves et al., 2018). Combining the four different small dust abundances and 3 different C/O ratios this results in twelve models per disk studied.
The model calculation is done in two steps. In the first step the dust and gas temperatures are calculated. We start from the best fit structure and CO depletion factors from Zhang et al. (2021). The structures are here modified to vary the small dust content. The abundances of \ceH2O and \ceCH4 in initial conditions of the chemical network are also modified at this point so the gas temperature calculation includes the changes in composition driven by the different C/O ratios. The dust and gas temperatures are then calculated using DALI with the standard reduced chemical network, which correctly calculates the abundances of the major gas coolants. (Bruderer et al., 2012; Bruderer, 2013). In the second step, a full gas-grain network was used to calculate the 2D-chemical composition based on the physical conditions determined in the first step.
This two step approach was chosen to balance consistency with feasibility. To calculate the gas temperature, the chemical solver has to run multiple times per cell, which is prohibitively expensive to do with the gas-grain chemical network. As mentioned, this approach does capture the effects of the C/O ratio on the gas temperature, and the effect of these changes on the resulting chemistry, while being computationally tractable.
2.4 Gas-grain chemical network
The gas-grain chemical network used for the second step of our calculations is based on the network of Walsh et al. (2015), which is a combination of the UMIST12555http://udfa.ajmarkwick.net/ (McElroy et al., 2013) for the gas-phase reactions and the Ohio State University (OSU) network (Garrod et al., 2008) for the grain surface reactions. Molecular binding energies are from McElroy et al. (2013) and Penteado et al. (2017), with small adjustments for \ceNH_x and \ceCH_x radicals (Bosman et al., 2018). These binding energies are tabulated in Bosman et al. (2018), Table B.2. The freeze-out of \ceH2 is also treated as in Bosman et al. (2018), using the higher (430 K) binding energy for \ceH2 when there are less than two layers of \ceH2 ice, but lowering the binding energy to 100 K when \ceH2 covers the ice completely.
Photo-desorption yields are taken from experiments where available (Öberg et al., 2009a, b, c), and assumed to be otherwise. All photodesorption is assumed to yield intact molecules in the gas-phase.666Many molecules are expected to fragment on absorption of a UV photon, with some of the fragments released from the ice, instead of photo-desorbing intact as assumed. Fragmentation has been shown for methanol (Bertin et al., 2016) and is expected for other, larger molecules. This is not expected to impact the chemistry of the species studied here. The grain surface chemistry assumes a diffusion-to-binding energy ratio of 0.3 and a tunneling barrier of 1 Å (as in Bosman et al., 2018). For photo-dissociation, the wavelength dependent cross-sections of Heays et al. (2017) are used in combination with the wavelength dependent UV field that DALI calculates. For the few cases in which Heays et al. (2017) do not have a compilation the wavelength dependent cross sections, the rate parameterization of McElroy et al. (2013) is used. Self-shielding and mutual shielding is included for \ceC, \ceCO, \ceN2 and \ceH2 (Draine & Bertoldi, 1996; Kamp & Bertoldi, 2000; Visser et al., 2009, 2018).
The initial abundances used in the models with different C/O ratios are tabulated in Table 1. Any molecule, atom, or ion not listed in the table has zero abundance at the beginning of the chemical calculation. The abundances of \ceH2O, \ceCO, and \ceCH4, that is, the initial carbon and oxygen carriers, are scaled with the CO depletion factors derived in Zhang et al. (2021) (see Fig. 1). Further the elemental abundances have been choses such that the maximum amount of CO that can be form, that is the lowest of the carbon and oxygen elemental abundances, is the same for all three of the C/O ratio. \ceCH4 was chosen as the carrier for the excess carbon (instead of elemental C) in the models. The exact initial abundances do not matter greatly for this calculation, as abundances in the \ceC2H layer will be set by photon-dominated steady-state chemistry (Bosman et al., 2021a). The only exceptions to this rule are the large (more than seven carbon atoms) carbon chains, which act as refractories in the intermediate PDR layers. These large carbon chains are only formed in the models when a significant fraction (10%) of the carbon is in elemental or ionized form. To prevent this, elemental or ionized form should not be chosen for the initial carbon carrier. In other cases, the exact carrier of the excess carbon does not substantially alter the resulting \ceC2H abundance (Bosman et al., 2021a).
A low cosmic-ray ionization rate of s-1 is used for the chemical models, similar to the models in Zhang et al. (2021) (see, e.g. Cleeves et al., 2013, for a discussion of cosmic ray propagation in disks.). A higher cosmic-ray ionization rate, coupled with the already low CO abundances currently assumed, would quickly convert the remaining CO into other species like \ceCH4, \ceCO2 and \ceCH3OH (e.g. Furuya & Aikawa, 2014; Schwarz et al., 2016; Bosman et al., 2018) in the 1 Myr chemical timescale that is assumed. This would create a disagreement between the CO column in the models and the intended, observationally motivated CO column density. This cosmic-ray ionization rate is thus not the rate necessary to lower the CO abundance from the ISM level to the observed levels, but it is the cosmic-ray ionization rate that has to be used to prevent the CO abundance from dropping further. We note that the cosmic-ray ionization rate used does not impact the \ceC2H abundance in chemical models (Cleeves et al., 2018) and that the cosmic-ray ionization rate used here is consistent with modeling of MAPS sources by Aikawa et al. (2021).
Appendix B shows the CO columns for difference C/O ratios for the three disks compared to the CO columns derived from the data. The difference C/O ratios do not impact the CO column in the model. Furthermore, the agreement between our model CO columns and the results from (Zhang et al., 2021) indicates that the amount of volatiles in the surface layer is representative for the disks studied.
| Species | C/O = 0.47 | C/O = 1.0 | C/O = 2.0 |
|---|---|---|---|
| \ceH2 | 0.495 | 0.495 | 0.495 |
| \ceH | 0.01 | 0.01 | 0.01 |
| \ceH2O∗ | |||
| \ceCO∗ | |||
| \ceCH4∗ | |||
| \ceN2 | |||
| \ceS | |||
| \ceSi | |||
| \ceFe | |||
| \ceMg |
3 Composition of the disk gas
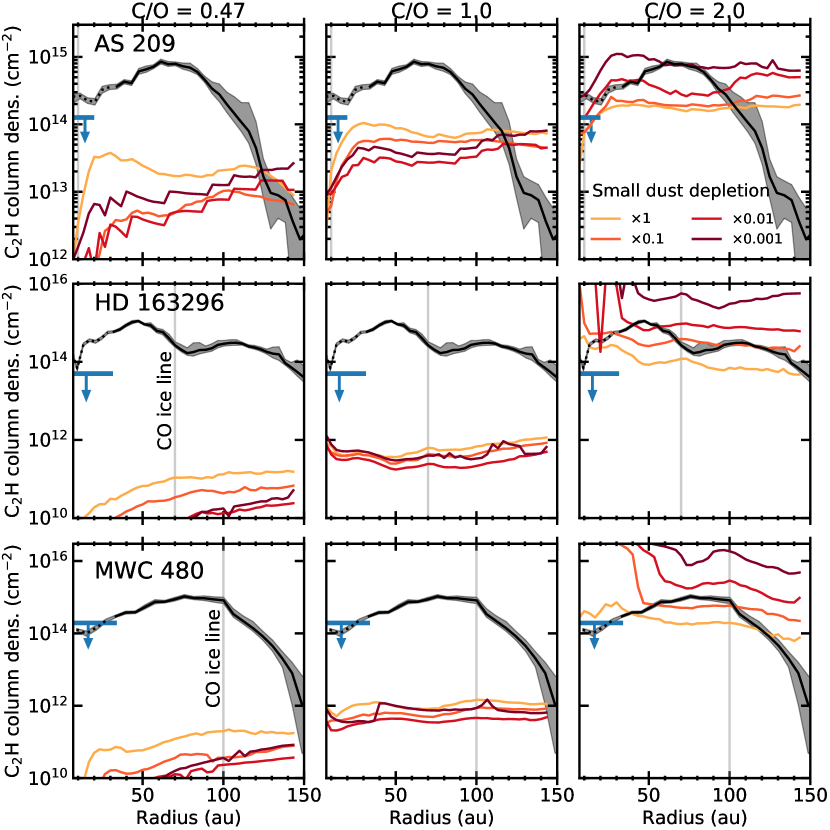
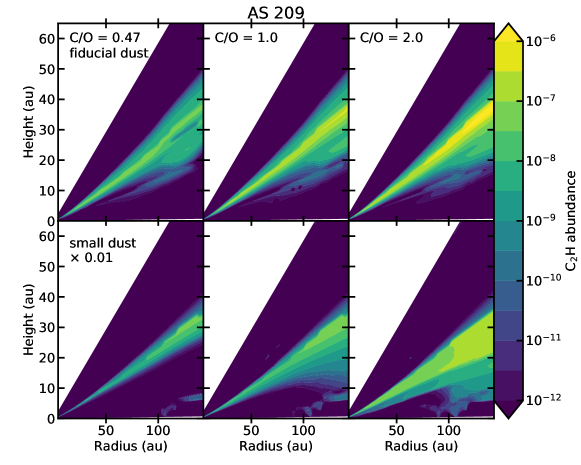
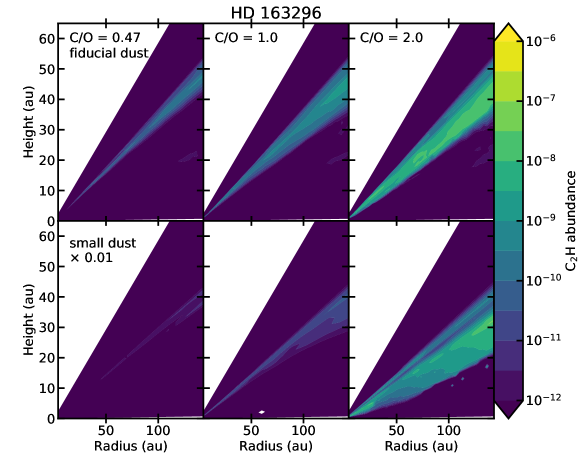
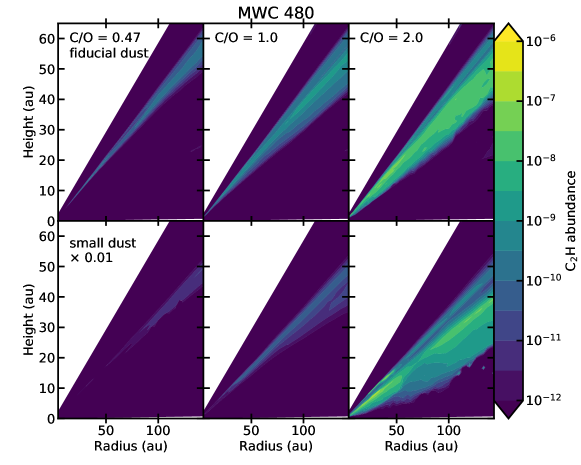
Figure 2 shows the model and observed \ceC2H column densities for the AS 209, HD 163296, and MWC 480 disks for C/O ratios of 0.47, 1.0, and 2.0, and the different depletion factors for the small dust grains. Two dimensional \ceC2H abundances structures can be found in Appendix C, together with a discussion on the chemical behavior of the \ceC2H. As expected, the C/O ratio has a large effect on the \ceC2H column density, especially the jump from C/O = 1.0 to C/O = 2.0.
Figure 2 clearly shows that C/O ratios 2.0 are necessary to match the high, cm-2, \ceC2H column densities observed in the inner 100–150 au of the AS 209, MWC 480 and HD 163296 disks. In all sources, the peak in the \ceC2H column density distribution require the signficant small-grain depletion, with the AS 209 model requiring a depletion in small-grains of 1000 over our baseline model to reproduce the \ceC2H column density. Maxima in the derived \ceC2H column have some co-locality with the first deep gap in the millimeter disk and region of low CO abundance (Fig. 1 Law et al., 2021a; Zhang et al., 2021; Guzmán et al., 2021). However, peaks in \ceC2H emission (and column) are much broader than the gaps seen in the millimeter disk. Interestingly the secondary peak around 110 au in the HD 163296 \ceC2H abundance structure does not line up with the second strong dust gap around au. This is further explored in Sec. 4.2.
The \ceC2H column density drops sharply towards large radii ( au, au and au for AS 209, HD 163296 and MWC 480, respectively). A constant C/O ratio model does not share this abundance drop at this radius, implying that the C/O ratio drops around these radii in these disks.
All three disks show a decrease in the \ceC2H column density inwards of 50 au. The AS 209 disk models show a dip in \ceC2H column in this region, driven by the decreasing CO, and thus available carbon abundance in the models. In HD 163296 and MWC 480, the \ceC2H column density decreases in the region where the \ceCO abundance and thus available carbon content increases. This implies a drop in C/O ratio in the inner regions of these disks. While this drop is expected to happen at the CO ice line, it appears to happen at a smaller radius for both the HD 163296 and MWC 480 disks. This is discussed in more detail in Sec. 4.3.
In summary, a high C/O ratio, together with a strong depletion of small dust is necessary to match maxima in the derived \ceC2H column. A model with a constant C/O ratio and small-grain depletion is not able to match the full behavior of the \ceC2H column density radial profiles. A radial variation in C/O ratio and small dust content of the disk atmosphere are necessary to reproduce this behavior. Implications of this inference are discussed in Sec. 4.2 and 4.3 and for the AS 209 disk, this is studied in more detail in Alarcón et al. (2021).
4 Discussion
4.1 C/O ratios from \ceC2H in the literature
The inferred C/O ratio associated with C2H emission locations in these disks are 2.0 or higher above most of the milli-meter disk. This is higher than previously derived for other disks. Miotello et al. (2019) found that a global C/O ratio of 1.5 reproduced the flux for the sample of Lupus disks studied, significantly lower than the C/O ratios found for these disks. This discrepancy is caused by the fact that the MAPS data resolve the disk emission and reveal existing emission structure. In the gas with strong C2H emission, a C/O ratio is necessary. However, the \ceC2H column density is not elevated ( cm-2) over the entire disk. Thus in models using disk-integrated flux a lower, global C/O ratio, will be estimated. This would be especially prominent for the three disks studied here as the \ceC2H column densities drop below cm-2 around 150 au (see, Guzmán et al., 2021), which imply C/O ratios for the majority of the disk area.
In the IM Lup disk, the C/O ratio was determined by Cleeves et al. (2018) to be around 0.8, even lower than the C/O ratios found for most of the disk in Miotello et al. (2019). When comparing the \ceC2H radial profiles in Law et al. (2021a) and \ceC2H column densities in Guzmán et al. (2021) between the IM Lup disk and the AS 209, MWC 480 and HD 163296 disks, it is clear that the IM Lup disk has less \ceC2H than the other disks by more than an order of magnitude. The observationally derived \ceC2H column density for the IM Lup disk is cm-2 between 70 and 230 au, which is of the same order as the AS 209 disk model column densities for a C/O of 0.47 and 1.0. The elemental composition of the IM Lup disk is thus clearly different from the three disks studied here.
The difference between the composition of the IM Lup disk and the other disks studied here could be due to the young age of the IM Lup disk (Mawet et al., 2012). The process responsible for turning the volatile rich and oxygen dominated ISM composition gas into the volatile poor and carbon rich gas seen in many other disks could then still be underway (Zhang et al., 2020b; Bergner et al., 2020). This composition transition can either be the result more efficient trapping of oxygen carrying species, e.g. water, CO, and CO2, as ices coating mm-sized dust particles that are confined to the mid-plane (Krijt et al., 2020), or the release of carbon from a refractory source in a uniformly depleted surface layer (Bosman et al., 2021a). Alternatively, the IM Lup disk has less pronounced substructures in the millimeter disk. This could simply be a result from the young age, but it can also imply that these substructures are, at least partly, responsible for the high C/O ratios (Bergin et al., 2016; Bosman et al., 2021a).
4.2 Structure in the \ceC2H column density
While it is clear that to match the high ( cm-2) column densities of \ceC2H in the AS 209, MWC 480, and HD 163296 disks a C/O is necessary, it is not obvious what causes the radial structures in the \ceC2H column density. These can be caused by either a variation of C/O ratio when the C/O ratio is below 2.0, a variation in small dust content when the C/O ratio is larger than unity or a combination of both. The effect on the \ceC2H column density due to changes in the C/O ratio are generally larger than those due to changes in the small dust content (Fig. 2).
The regions in which a depletion of small-grains must be invoked to match the \ceC2H column density is wider than the millimeter dust gaps seen in these three disks. As the chemical timescales are short, 1000 yr (Bosman et al., 2021a), diffusive spreading of \ceC2H from the millimeter gap, which happens on time-scales yr, can be ruled out. This is thus suggestive of a wider small-grain gap, around the millimeter dust gap, possibly due to the millimeter dust rings acting as a small-grain sink in a manner similar to that predicted from the midplane (Krijt & Ciesla, 2016).
In the HD 163296 disk, the \ceC2H column density outside 70 au is consistent with an elevated C/O ratio of 2.0 and factor of small dust depletion. At 50 au, the radius of a prominent gap in the millimeter continuum, the \ceC2H column density is more comparable to the model with a factor 100 depletion is small-grains. This indicates that the UV penetrates deeper into the disk around the millimeter dust gap. This is not seen in the second dust gap at 90 au, where there is a local minimum in the \ceC2H abundance. A possible explanation for the difference in \ceC2H column density can be found in the scattered light image. There is a bright ring in scattered light associated with the 66 au sub-millimeter dust ring (e.g. Garufi et al., 2014; Monnier et al., 2017; Muro-Arena et al., 2018). This ring of abundant small dust could shadow the region of the second dust gap lowering the available UV flux in the gap and thus lowering the \ceC2H column density.
The \ceC2H column density in the MWC 480 disk peaks around 70 au, the location of the millimeter continuum dust gap (Long et al., 2019; Liu et al., 2019; Law et al., 2021a). Similar to the gap at 50 au in the HD 163296 disk, high UV penetration at the gap location – again suggestive of small-grain depletion – is necessary.
The need for additional small dust depletion on top of the fiducial dust models that already have a degree of dust depletion in the surface layers implies gas-to-dust ratios in the surface layers of at least 10000 and up to at the location of the \ceC2H emission peak in AS 209 (Zhang et al., 2021). It is thus possible that other processes are increasing the \ceC2H abundance above the levels, predicted by the chemical models. One intriguing possibility is that strong vertical or radial mixing is operating, which could cycle \ceC2H2 and other larger carbon species from more shielded regions into the 25-75 au region. This would lead to an out of equilibrium chemistry with a higher \ceC2H abundance. This could be consistent with a large scale meridional flow into the gaps and would be an interesting subject of further study.
4.3 A link between CO abundance and C/O
It has been suggested that a low CO abundance and a high C/O ratio have a common dynamical or chemical origin, which should cause a correlation between CO abundance and C/O ratio (Bergin et al., 2016). However, a relation between \ceC2H flux and CO abundances, as traced by \ce^13CO over millimeter dust flux has not been found (Miotello et al., 2019). The relation has not been studied as a function of radius in a disk, where, for example, the release of CO at the CO ice line is expected to have a strong impact on the gas-phase C/O ratio (Öberg et al., 2011).
For the MWC 480 and HD 163296 disks, the regions within and outside of the \ceCO ice line are resolved by the observations. The emission maps of C18O (and the derived CO column) do not exhibit a strong response at the CO ice line location predicted by the detailed disk physical models. Most directly, the CO abundance at the CO ice line does not return to the ISM level (e.g. 10-4 relative to H2; Zhang et al., 2021, Fig. 1). This is consistent with a lack of the expected \ceC2H column density drop at the \ceCO ice line. Without the return of CO, the C/O ratio does not drop towards unity, but stays high. Closer to the star, there is an increase in the CO abundance, the CO abundance reaching greater than ISM levels at 50 au in MWC 480 and at 30 au in HD 163296.
The increase in CO abundance at these radii is accompanied by a drop \ceC2H column density see Fig. 1, consistent with a drop in C/O ratio (Fig. 2) due to the return of the oxygen carried by CO into the gas. As mentioned the location that the CO abundance rises is not where the CO ice line is expected, based on the thermal structure in the models (Zhang et al., 2021; Calahan et al., 2021). Temperatures in the region where the CO abundance rises are between 25 and 30 K in the standard MAPS models (Zhang et al., 2021). These temperatures are in line with modeling by Calahan et al. (2021) for HD 163296 and empirical temperature measurements from the CO isotopologue emission (Law et al., 2021b). Furthermore the location where the \ceC2H column drops below the C/O=2 models is at smaller radii than the rise in CO abundance. This implies that when the CO abundance rises to close to the ISM value, then the C/O ratio drops.
If the rise of CO abundance is due to CO coming off the grains, this would imply a higher binding energy than the 850 K ( 22 K iceline temperature, e.g. Harsono et al., 2015) assumed in the models, or be due to a different physical effect such as large grains drifting, and only fully releasing their icy CO mantle further in. Exact effects are going to be very disk dependent. A higher CO desorption temperature was also inferred for CO in TW Hya (Zhang et al., 2017). This could be indicative for CO as desorbed on \ceH2O or \ceCO2 mixture (Noble et al., 2012; He & Vidali, 2014). In the case of HD 163296 and MWC 480, in which the CO content of the grains is expected to be high, this would indicate that the vast majority of the 100 monolayers of CO are all in high binding energy sites. To move the ice line by 40 au due to fast radial drift grains between 1 and 10 cm are necessary to reach the right drift speeds and desorption speed (Piso et al., 2015). This is larger than the 3 mm grains that Sierra et al. (2021) need at these radii to fit multiband continuum data.
Similar relation between CO and C2H abundance is seen in the outer disk of AS 209, where outside 100 au the CO abundance increases, and the \ceC2H column density drops, again implying a low C/O ratio when the CO abundance is high. HD 163296 and MWC 480 also show a drop in \ceC2H column density and inferred C/O ratio outside 120 and 150 au respectively. This is not paired with an increase in CO abundance, however. This implies that a high C/O ratio happens only in the regions with low CO abundance. However, something in addition to low CO abundance is needed to explain a high C/O ratio. This could be related to the presence of an additional carbon source, such as the photo-ablation of carbonaceous grains (Bosman et al., 2021a).
4.4 Composition of planet building material
To properly predict the composition of a planet forming at a certain location, it is necessary to know the elemental composition of the building materials. For any planet forming outside of 30 au in the AS 209, HD 163296, and MWC 480 disks, such as those inferred in the various gaps in these systems, it is now possible to make some inferences on the composition of the gas and solids that will go into these putative planets. For this discussion we will assume that the bulk of the gas mass is accreted late in the disk lifetime such that the composition of the disk gas inferred here is representative of the gas accreted onto the planet. If planets accrete their gas mass early in the disk lifetime, when accretion onto the disk still delivers significant pristine material, planetary composition would be very similar to that of the host star.
The \ceC2H emission in these three disks is strong, but an emission surface height cannot be derived unambiguously over the entire disk (Law et al., 2021b). This either implies that the line is optically thin, and thus too weak to measure a height or that it comes from below the \ce^13CO surface, which results in a measured height that is consistent with the disk midplane. The hyperfine ratios, from which the \ceC2H column densities have been derived, show that the lines are optically thick. This means that the \ceC2H lines come from deeper than the \ce^13CO emission. This is consistent with the disk regions where the \ceC2H height can be derived (Law et al., 2021b) and is in agreement with the models, that have most of the column density between 1 and 2 scale-heights (see Appendix C, the scale-heights in these disks at 10-200 au vary between z/r of 0.06 and 0.1 depending on the disk, Zhang et al., 2021). At this height, mixing with the midplane is efficient and happens on 10 kyr time-scales for turbulent viscosity coefficients of (Ciesla, 2010). As such, it is unlikely that strong vertical elemental abundance gradients exist, so the high C/O abundances and low O/H abundances necessary to explain the \ceC2H emission likely hold for the disk midplane as well. Furthermore, if accretion onto a planet happens through meridional flows, the gas accretion onto the planet will actually sample the vertical height from where the \ceC2H emission originates (Tanigawa et al., 2012; Morbidelli et al., 2014); such flows have been observed in the higher layers of the disk with \ce^12CO in the HD 163296 disk by Teague et al. (2019). As these are the flows that feed the planet, gas from the \ceC2H layer emitting layer is expected to contribute significantly to the planetary accretion after gap opening (Morbidelli et al., 2014; Cridland et al., 2020).
The amount of small-grains in the disk atmosphere, that can accrete with the gas onto the planet, is strongly reduced from the ISM level of 1% of the total mass. This happens both globally in the disk surface due to grain growth and settling, and locally, as the inferred \ceC2H column densities necessitate more UV penetration in certain disk locations. The combined low CO abundance, and depleted small dust thus imply that most of the ISM carbon and oxygen, both volatile and refractory, is not present in gas accreting onto planets that have reached pebble isolation mass.
Gas giants that accrete most of their atmospheres after reaching the pebble isolation mass thus obtain envelopes, with substellar C/H and O/H, and high () C/O ratio compositions, unless efficient release of volatiles from the core or late enrichment by planetesimals takes place. These potential planets are formed at large radii, where CO can be depleted efficiently ( 50 au radii for HD 163296 and MWC 480). If these planets do not migrate from their formation location, they are prime targets for composition analysis by direct imaging with the James Webb Space Telescope, the most notable example being the planets in the HR 8799 system. Substellar carbon and oxygen abundances and a high C/O composition would distinguish planets formed through pebble or core accretion from planets formed as a result of a gravitational instability. The latter are expected to have a stellar or superstellar C/H and O/H ratios with a stellar or substellar C/O ratio (e.g. Ilee et al., 2017).
Compositions of planets at large radii so far do not show the signature predicted from the disk observations. Pic b has a low derived C/O ratio, which is expected to be close or below the stellar C/O ratio (Gravity Collaboration et al., 2020). This rules out a formation scenario in which one of the au putative planets in the disks studied here migrates inward to 9 au (Lagrange et al., 2020), unless this planet accreted 40 M⊕ of oxygen-rich ice, or mixed a similar amount of ice from the core into the atmosphere (Gravity Collaboration et al., 2020). Three other large radii ( au) planets have their water abundance measured ( And b, HR8799 b and HR8799 c Todorov et al., 2016; Lavie et al., 2017; Madhusudhan, 2019). The water abundances are higher than the disk atmosphere gas, ice and refractory oxygen abundances combined, by a factor 2 to 100, for the three disks studied here. If these planets are the successors of the putative planets in these disks, a significant amount of disk water ice needs to make it into the atmosphere, at least 30 for And b and HR 8799 b, and around 100 for HR 8799 c (Madhusudhan, 2019). This would imply very massive cores (60 - 200 ) and very efficient core mixing, 6-20 Myr-1 planetesimal accretion rates for a 10 Myr disk age, or a gravitational instability origin from moderately (factor 1-3) water ice enhanced core. The low water abundance measured for many transiting exoplanets is comparable to the low total oxygen abundance in the gas at large ( au) radii in the AS 209, HD 163296 and MWC 480 disks (Madhusudhan, 2019; Welbanks et al., 2019). This could point at an outer disk origin for these hot Jupiters, however without constraints on the C/O ratio this remains speculation. A high C/O would strengthen the case for an outer disk origin for hot Jupiters.
5 Conclusions
We have studied the behavior of the \ceC2H column densities above the millimeter pebble disks orbiting AS 209, MWC 480, and HD 163296, and compared these to \ceC2H column densities to source specific thermochemical models calculated using DALI (Bruderer et al., 2012; Bruderer, 2013) with an extended gas-grain chemical network. We find that high () C/O ratios are necessary to explain the strong \ceC2H emission. The high column densities ( cm-2) imply that there is an additional effect at play. One option is more efficient UV penetration, leading to even higher \ceC2H column densities. The high, but localized, \ceC2H column densities explain why these resolved observations need locally higher C/O ratios than global models, like those from Miotello et al. (2019).
Furthermore, a relation between the C/O ratio and CO abundance appears to exist, with a higher CO abundance leading to a lower C/O ratio. This is especially the case when looking at the inner 100 au of the HD 163296 and MWC 480 disks. The transition to an enhanced CO abundance and diminished C/O ratios seems not to happen at the CO ice line, but further in.
The C/O ratio and the gas-to-dust ratio are elevated above stellar and ISM-levels (respectively) along the radial extent of the pebbled disk, except in the regions where the CO abundance is high (inner 30 au for HD 163296 and MWC 480). This includes the regions that most of the dust gaps are located. The gas accreting onto the possibly forming planets is thus strongly depleted of volatile and refractory carbon and oxygen, with a strongly super-stellar C/O ratio. In the absence of core-envelope mixing and envelope enrichment by planetesimal collisions, this would lead to a high C/O but generally volatile depleted giant planets. Comparing this prediction to the composition of gas giants at large orbits, such as will be inferred by the James Webb Space Telescope, will be able to point at the origin of these large orbit planets.
References
- Aikawa et al. (2021) Aikawa, Y., Cataldi, G., Yamato, Y., et al. 2021, arXiv e-prints, arXiv:2109.06419. https://arxiv.org/abs/2109.06419
- Alarcón et al. (2021) Alarcón, F., Bosman, A., Bergin, E., et al. 2021, arXiv e-prints, arXiv:2109.06263. https://arxiv.org/abs/2109.06263
- Andrews et al. (2018) Andrews, S. M., Huang, J., Pérez, L. M., et al. 2018, ApJ, 869, L41, doi: 10.3847/2041-8213/aaf741
- Bergin et al. (2016) Bergin, E. A., Du, F., Cleeves, L. I., et al. 2016, ApJ, 831, 101, doi: 10.3847/0004-637X/831/1/101
- Bergner et al. (2020) Bergner, J. B., Öberg, K. I., Bergin, E. A., et al. 2020, ApJ, 898, 97, doi: 10.3847/1538-4357/ab9e71
- Bergner et al. (2021) Bergner, J. B., Oberg, K. I., Guzman, V. V., et al. 2021, arXiv e-prints, arXiv:2109.06694. https://arxiv.org/abs/2109.06694
- Bertin et al. (2016) Bertin, M., Romanzin, C., Doronin, M., et al. 2016, ApJ, 817, L12, doi: 10.3847/2041-8205/817/2/L12
- Booth et al. (2017) Booth, R. A., Clarke, C. J., Madhusudhan, N., & Ilee, J. D. 2017, MNRAS, 469, 3994, doi: 10.1093/mnras/stx1103
- Booth & Ilee (2019) Booth, R. A., & Ilee, J. D. 2019, MNRAS, 487, 3998, doi: 10.1093/mnras/stz1488
- Bosman et al. (2021a) Bosman, A. D., Alarcón, F., Zhang, K., & Bergin, E. A. 2021a, ApJ, 910, 3, doi: 10.3847/1538-4357/abe127
- Bosman et al. (2019) Bosman, A. D., Banzatti, A., Bruderer, S., et al. 2019, A&A, 631, A133, doi: 10.1051/0004-6361/201935910
- Bosman et al. (2018) Bosman, A. D., Walsh, C., & van Dishoeck, E. F. 2018, A&A, 618, A182, doi: 10.1051/0004-6361/201833497
- Bosman et al. (2021b) Bosman, A. D., Bergin, E. A., Loomis, R. A., et al. 2021b, arXiv e-prints, arXiv:2109.06223. https://arxiv.org/abs/2109.06223
- Bruderer (2013) Bruderer, S. 2013, A&A, 559, A46, doi: 10.1051/0004-6361/201321171
- Bruderer et al. (2012) Bruderer, S., van Dishoeck, E. F., Doty, S. D., & Herczeg, G. J. 2012, A&A, 541, A91, doi: 10.1051/0004-6361/201118218
- Calahan et al. (2021) Calahan, J. K., Bergin, E. A., Zhang, K., et al. 2021, arXiv e-prints, arXiv:2109.06202. https://arxiv.org/abs/2109.06202
- Ciesla (2010) Ciesla, F. J. 2010, ApJ, 723, 514, doi: 10.1088/0004-637X/723/1/514
- Ciesla & Cuzzi (2006) Ciesla, F. J., & Cuzzi, J. N. 2006, Icarus, 181, 178, doi: 10.1016/j.icarus.2005.11.009
- Cleeves et al. (2013) Cleeves, L. I., Adams, F. C., & Bergin, E. A. 2013, ApJ, 772, 5, doi: 10.1088/0004-637X/772/1/5
- Cleeves et al. (2018) Cleeves, L. I., Öberg, K. I., Wilner, D. J., et al. 2018, ApJ, 865, 155, doi: 10.3847/1538-4357/aade96
- Cridland et al. (2020) Cridland, A. J., Bosman, A. D., & van Dishoeck, E. F. 2020, A&A, 635, A68, doi: 10.1051/0004-6361/201936858
- Cridland et al. (2017) Cridland, A. J., Pudritz, R. E., Birnstiel, T., Cleeves, L. I., & Bergin, E. A. 2017, MNRAS, 469, 3910, doi: 10.1093/mnras/stx1069
- Draine & Bertoldi (1996) Draine, B. T., & Bertoldi, F. 1996, ApJ, 468, 269, doi: 10.1086/177689
- Du & Bergin (2014) Du, F., & Bergin, E. A. 2014, ApJ, 792, 2, doi: 10.1088/0004-637X/792/1/2
- Eistrup et al. (2016) Eistrup, C., Walsh, C., & van Dishoeck, E. F. 2016, A&A, 595, A83, doi: 10.1051/0004-6361/201628509
- Furuya & Aikawa (2014) Furuya, K., & Aikawa, Y. 2014, ApJ, 790, 97, doi: 10.1088/0004-637X/790/2/97
- Garrod et al. (2008) Garrod, R. T., Widicus Weaver, S. L., & Herbst, E. 2008, ApJ, 682, 283, doi: 10.1086/588035
- Garufi et al. (2014) Garufi, A., Quanz, S. P., Schmid, H. M., et al. 2014, A&A, 568, A40, doi: 10.1051/0004-6361/201424262
- Gravity Collaboration et al. (2020) Gravity Collaboration, Nowak, M., Lacour, S., et al. 2020, A&A, 633, A110, doi: 10.1051/0004-6361/201936898
- Greene et al. (2016) Greene, T. P., Line, M. R., Montero, C., et al. 2016, ApJ, 817, 17, doi: 10.3847/0004-637X/817/1/17
- Guzmán et al. (2018) Guzmán, V. V., Huang, J., Andrews, S. M., et al. 2018, ApJ, 869, L48, doi: 10.3847/2041-8213/aaedae
- Guzmán et al. (2021) Guzmán, V. V., Bergner, J. B., Law, C. J., et al. 2021, arXiv e-prints, arXiv:2109.06391. https://arxiv.org/abs/2109.06391
- Harsono et al. (2015) Harsono, D., Bruderer, S., & van Dishoeck, E. F. 2015, A&A, 582, A41, doi: 10.1051/0004-6361/201525966
- He & Vidali (2014) He, J., & Vidali, G. 2014, ApJ, 788, 50, doi: 10.1088/0004-637X/788/1/50
- Heays et al. (2017) Heays, A. N., Bosman, A. D., & van Dishoeck, E. F. 2017, A&A, 602, A105, doi: 10.1051/0004-6361/201628742
- Huang et al. (2018) Huang, J., Andrews, S. M., Dullemond, C. P., et al. 2018, ApJ, 869, L42, doi: 10.3847/2041-8213/aaf740
- Huang et al. (2021) Huang, J., Bergin, E. A., Öberg, K. I., et al. 2021, arXiv e-prints, arXiv:2109.06224. https://arxiv.org/abs/2109.06224
- Hunter (2007) Hunter, J. D. 2007, Computing in Science & Engineering, 9, 90, doi: 10.1109/MCSE.2007.55
- Ilee et al. (2017) Ilee, J. D., Forgan, D. H., Evans, M. G., et al. 2017, MNRAS, 472, 189, doi: 10.1093/mnras/stx1966
- Isella et al. (2018) Isella, A., Huang, J., Andrews, S. M., et al. 2018, ApJ, 869, L49, doi: 10.3847/2041-8213/aaf747
- Jansen et al. (1995) Jansen, D. J., Spaans, M., Hogerheijde, M. R., & van Dishoeck, E. F. 1995, A&A, 303, 541
- Johnson et al. (2010) Johnson, J. A., Aller, K. M., Howard, A. W., & Crepp, J. R. 2010, PASP, 122, 905, doi: 10.1086/655775
- Kamp & Bertoldi (2000) Kamp, I., & Bertoldi, F. 2000, A&A, 353, 276
- Krijt et al. (2020) Krijt, S., Bosman, A. D., Zhang, K., et al. 2020, ApJ, 899, 134, doi: 10.3847/1538-4357/aba75d
- Krijt & Ciesla (2016) Krijt, S., & Ciesla, F. J. 2016, ApJ, 822, 111, doi: 10.3847/0004-637X/822/2/111
- Lagrange et al. (2020) Lagrange, A. M., Rubini, P., Nowak, M., et al. 2020, A&A, 642, A18, doi: 10.1051/0004-6361/202038823
- Lavie et al. (2017) Lavie, B., Mendonça, J. M., Mordasini, C., et al. 2017, AJ, 154, 91, doi: 10.3847/1538-3881/aa7ed8
- Law et al. (2021a) Law, C. J., Loomis, R. A., Teague, R., et al. 2021a, arXiv e-prints, arXiv:2109.06210. https://arxiv.org/abs/2109.06210
- Law et al. (2021b) Law, C. J., Teague, R., Loomis, R. A., et al. 2021b, arXiv e-prints, arXiv:2109.06217. https://arxiv.org/abs/2109.06217
- Liu et al. (2019) Liu, Y., Dipierro, G., Ragusa, E., et al. 2019, A&A, 622, A75, doi: 10.1051/0004-6361/201834157
- Long et al. (2018) Long, F., Pinilla, P., Herczeg, G. J., et al. 2018, ApJ, 869, 17, doi: 10.3847/1538-4357/aae8e1
- Long et al. (2019) Long, F., Herczeg, G. J., Harsono, D., et al. 2019, ApJ, 882, 49, doi: 10.3847/1538-4357/ab2d2d
- Madhusudhan (2019) Madhusudhan, N. 2019, ARA&A, 57, 617, doi: 10.1146/annurev-astro-081817-051846
- Madhusudhan et al. (2016) Madhusudhan, N., Bitsch, B., Johansen, A., & Eriksson, L. 2016, ArXiv e-prints. https://arxiv.org/abs/1611.03083
- Madhusudhan et al. (2014) Madhusudhan, N., Knutson, H., Fortney, J. J., & Barman, T. 2014, in Protostars and Planets VI, ed. H. Beuther, R. Klessen, C. Dullemond, & T. Henning (University of Arizona Press, Tucson), 739–762, doi: 10.2458/azu_uapress_9780816531240-ch032
- Mawet et al. (2012) Mawet, D., Absil, O., Montagnier, G., et al. 2012, A&A, 544, A131, doi: 10.1051/0004-6361/201219662
- McElroy et al. (2013) McElroy, D., Walsh, C., Markwick, A. J., et al. 2013, A&A, 550, A36, doi: 10.1051/0004-6361/201220465
- Miotello et al. (2019) Miotello, A., Facchini, S., van Dishoeck, E. F., et al. 2019, A&A, 631, A69, doi: 10.1051/0004-6361/201935441
- Monnier et al. (2017) Monnier, J. D., Harries, T. J., Aarnio, A., et al. 2017, ApJ, 838, 20, doi: 10.3847/1538-4357/aa6248
- Morbidelli et al. (2014) Morbidelli, A., Szulágyi, J., Crida, A., et al. 2014, Icarus, 232, 266, doi: 10.1016/j.icarus.2014.01.010
- Mordasini et al. (2009) Mordasini, C., Alibert, Y., & Benz, W. 2009, A&A, 501, 1139, doi: 10.1051/0004-6361/200810301
- Muro-Arena et al. (2018) Muro-Arena, G. A., Dominik, C., Waters, L. B. F. M., et al. 2018, A&A, 614, A24, doi: 10.1051/0004-6361/201732299
- Nagy et al. (2015) Nagy, Z., Ossenkopf, V., Van der Tak, F. F. S., et al. 2015, A&A, 578, A124, doi: 10.1051/0004-6361/201424220
- Noble et al. (2012) Noble, J. A., Congiu, E., Dulieu, F., & Fraser, H. J. 2012, MNRAS, 421, 768, doi: 10.1111/j.1365-2966.2011.20351.x
- Öberg & Bergin (2020) Öberg, K. I., & Bergin, E. A. 2020, Physics Reports, in press. https://arxiv.org/abs/2010.03529
- Öberg et al. (2011) Öberg, K. I., Boogert, A. C. A., Pontoppidan, K. M., et al. 2011, ApJ, 740, 109, doi: 10.1088/0004-637X/740/2/109
- Öberg et al. (2009a) Öberg, K. I., Garrod, R. T., van Dishoeck, E. F., & Linnartz, H. 2009a, A&A, 504, 891, doi: 10.1051/0004-6361/200912559
- Öberg et al. (2009b) Öberg, K. I., Linnartz, H., Visser, R., & van Dishoeck, E. F. 2009b, ApJ, 693, 1209, doi: 10.1088/0004-637X/693/2/1209
- Öberg et al. (2009c) Öberg, K. I., van Dishoeck, E. F., & Linnartz, H. 2009c, A&A, 496, 281, doi: 10.1051/0004-6361/200810207
- Oberg et al. (2021) Oberg, K. I., Guzman, V. V., Walsh, C., et al. 2021, arXiv e-prints, arXiv:2109.06268. https://arxiv.org/abs/2109.06268
- Paardekooper & Mellema (2006) Paardekooper, S. J., & Mellema, G. 2006, A&A, 453, 1129, doi: 10.1051/0004-6361:20054449
- Penteado et al. (2017) Penteado, E. M., Walsh, C., & Cuppen, H. M. 2017, ApJ, 844, 71, doi: 10.3847/1538-4357/aa78f9
- Pinte et al. (2018) Pinte, C., Ménard, F., Duchêne, G., et al. 2018, A&A, 609, A47, doi: 10.1051/0004-6361/201731377
- Piso et al. (2015) Piso, A.-M. A., Öberg, K. I., Birnstiel, T., & Murray-Clay, R. A. 2015, ApJ, 815, 109, doi: 10.1088/0004-637X/815/2/109
- Rosotti et al. (2016) Rosotti, G. P., Juhasz, A., Booth, R. A., & Clarke, C. J. 2016, MNRAS, 459, 2790, doi: 10.1093/mnras/stw691
- Schwarz et al. (2016) Schwarz, K. R., Bergin, E. A., Cleeves, L. I., et al. 2016, ApJ, 823, 91, doi: 10.3847/0004-637X/823/2/91
- Schwarz et al. (2021) Schwarz, K. R., Calahan, J. K., Zhang, K., et al. 2021, arXiv e-prints, arXiv:2109.06228. https://arxiv.org/abs/2109.06228
- Shakura & Sunyaev (1973) Shakura, N. I., & Sunyaev, R. A. 1973, A&A, 24, 337
- Sierra et al. (2021) Sierra, A., Pérez, L. M., Zhang, K., et al. 2021, arXiv e-prints, arXiv:2109.06433. https://arxiv.org/abs/2109.06433
- Sing et al. (2016) Sing, D. K., Fortney, J. J., Nikolov, N., et al. 2016, Nature, 529, 59, doi: 10.1038/nature16068
- Tanigawa et al. (2012) Tanigawa, T., Ohtsuki, K., & Machida, M. N. 2012, ApJ, 747, 47, doi: 10.1088/0004-637X/747/1/47
- Teague et al. (2019) Teague, R., Bae, J., & Bergin, E. A. 2019, Nature, 574, 378, doi: 10.1038/s41586-019-1642-0
- Teague et al. (2018) Teague, R., Bae, J., Bergin, E. A., Birnstiel, T., & Foreman-Mackey, D. 2018, ApJ, 860, L12, doi: 10.3847/2041-8213/aac6d7
- Teague et al. (2021) Teague, R., Bae, J., Aikawa, Y., et al. 2021, arXiv e-prints, arXiv:2109.06218. https://arxiv.org/abs/2109.06218
- Todorov et al. (2016) Todorov, K. O., Line, M. R., Pineda, J. E., et al. 2016, ApJ, 823, 14, doi: 10.3847/0004-637X/823/1/14
- Trapman et al. (2017) Trapman, L., Miotello, A., Kama, M., van Dishoeck, E. F., & Bruderer, S. 2017, A&A, 605, A69, doi: 10.1051/0004-6361/201630308
- Van Der Walt et al. (2011) Van Der Walt, S., Colbert, S. C., & Varoquaux, G. 2011, Computing in Science & Engineering, 13, 22
- van Dishoeck & Black (1988) van Dishoeck, E. F., & Black, J. H. 1988, ApJ, 334, 771, doi: 10.1086/166877
- Virtanen et al. (2020) Virtanen, P., Gommers, R., Oliphant, T. E., et al. 2020, Nature Methods, 17, 261, doi: https://doi.org/10.1038/s41592-019-0686-2
- Visser et al. (2018) Visser, R., Bruderer, S., Cazzoletti, P., et al. 2018, A&A, 615, A75, doi: 10.1051/0004-6361/201731898
- Visser et al. (2009) Visser, R., van Dishoeck, E. F., & Black, J. H. 2009, A&A, 503, 323, doi: 10.1051/0004-6361/200912129
- Walsh et al. (2015) Walsh, C., Nomura, H., & van Dishoeck, E. 2015, A&A, 582, A88, doi: 10.1051/0004-6361/201526751
- Welbanks et al. (2019) Welbanks, L., Madhusudhan, N., Allard, N. F., et al. 2019, ApJ, 887, L20, doi: 10.3847/2041-8213/ab5a89
- Winn & Fabrycky (2015) Winn, J. N., & Fabrycky, D. C. 2015, ARA&A, 53, 409, doi: 10.1146/annurev-astro-082214-122246
- Zhang et al. (2017) Zhang, K., Bergin, E. A., Blake, G. A., Cleeves, L. I., & Schwarz, K. R. 2017, Nature Astronomy, 1, 0130, doi: 10.1038/s41550-017-0130
- Zhang et al. (2020a) Zhang, K., Bosman, A. D., & Bergin, E. A. 2020a, ApJ, 891, L16, doi: 10.3847/2041-8213/ab77ca
- Zhang et al. (2020b) Zhang, K., Schwarz, K. R., & Bergin, E. A. 2020b, ApJ, 891, L17, doi: 10.3847/2041-8213/ab7823
- Zhang et al. (2021) Zhang, K., Booth, A. S., Law, C. J., et al. 2021, arXiv e-prints, arXiv:2109.06233. https://arxiv.org/abs/2109.06233
- Zhang et al. (2018) Zhang, S., Zhu, Z., Huang, J., et al. 2018, ApJ, 869, L47, doi: 10.3847/2041-8213/aaf744
Appendix A \ceC2H column in the inner 30 au
To set limits on the \ceC2H column from the inner regions of the disk, we use the kinematic information in the \ceC2H line profile to determine the flux that is actually coming from the inner disk. First we filter out flux that seems to be emitted from small radii in the image, but is instead flux from larger radii, smeared to the inner regions by the beam. To accomplish this we use the method outlined in Bosman et al. (2021b) to extract spectra from the image cube and then transform these inner disk spectra into radial profiles using the kinematical information assuming the disk is in Keplerian rotation. Instead of using both the red and blue-shifted line wings as done for CO, we only use the uncontaminated line wing for \ceC2H. Radial profiles are created for the four strong components of the \ceC2H =3–2 transition (=7/2–5/2, =4–3; =7/2–5/2, =3–2; =5/2–3/2, =3–2 and =5/2–3/2, =2–1). The weaker =3–2, =5/2–3/2, =2–2 line does not contaminate the spectrum of the nearest strong line. Figure 3 shows the redshifted wing of the =3–2; 7/2-5/2, 4–3 transition together with the extracted radial profile and inner region upper limit for AS 209.
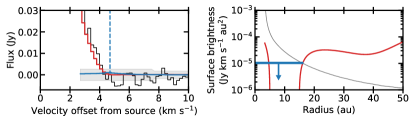
Redshifted line wing of the \ceC2H =3–2; 7/2-5/2, 4–3 transition in AS 209 (black). The red line shows a model fit to the flux at 2.6 km s-1 from source velocity, corresponding to 55 au for AS 209 and the blue line shows the profile of the flux upper limit in the inner region. Right: The fitted radial profile (red) and flux upper limit (blue) derived from the data. The grey line shows relation between the extend of an emitting area and the minimal, constant flux that would be detectable from that area given the noise in the data. This is our sensitivity limit estimate. The point where the fitted radial profile dips under this sensitivity limits is where we set the flux upper limit for the inner most region.
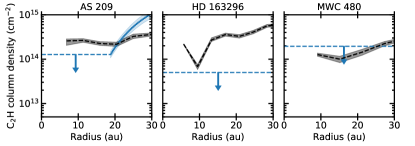
To account for the loss of sensitivity by only having one line-wing per fit, we increase the radial grid spacing in the radial profile fitting to 10 au. The emission is weak and within 30 au we are mostly constrained to estimating upper limits. Only for the AS 209 disk can some flux be ascribed to the 20-30 au region. The radial extend as well as the flux upper limit derived are taken from the radial profiles and these are converted into a column upper limit for the inner disk. To convert flux into column densities we follow Bergner et al. (2021) taking the quantum values for \ceC2H from the JPL database (see Guzmán et al. (2021)). To convert flux to column, gas temperature and continuum emission temperature are necessary. For the gas temperature we assume the temperature from Law et al. (2021b) for \ce^12CO = 2–1 at 30 au and for the continuum we take the brightness temperature at 30 au from Sierra et al. (2021), using disk center values changes derived columns less than a factor 2. Values are given in Table. 2. We also assume LTE and that the line width is fully thermal. Fig. 4 compares the derived limits from the line profiles to the columns derived from the images.
| Source | Gas temperature (K) | Dust emission temperature (K) |
|---|---|---|
| AS 209 | 30.2 | 12.4 |
| HD 163296 | 53.8 | 22.7 |
| MWC 480 | 69.1 | 25.5 |
Appendix B Tracing the gaseous volatile content with CO
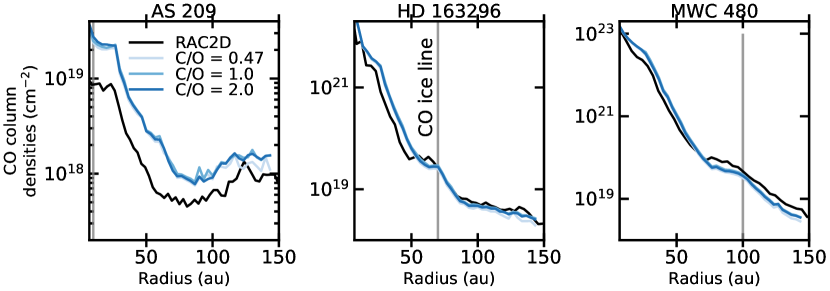
Figure 5 compares the CO column densities derived by Zhang et al. (2021) and the CO column densities extracted from the gas-grain network for the three different C/O ratios tested here for the thermochemical models with undepleted small dust. The CO column densities in the DALI models match well for models of the MWC 480 and HD 163296 disks, but the AS 209 DALI models produce higher CO column densities than in the AS 209 RAC2D model.
The AS 209 RAC2D model has a significant amount of carbon in \ceCO2 ice, while in the DALI models \ceCO2 is barely formed, leaving more carbon in gas-phase CO near the midplane. This is due to the more simplified implementation of the grain surface chemistry in RAC2D (Du & Bergin, 2014). This difference is only seen in the AS 209 model due to the larger X-ray luminosity and lower UV luminosity in the AS 209 model compared to the HD 163296 and MWC 480 models. In the latter two models, the low X-ray flux and higher UV flux suppresses the formation of \ceCO2 in the RAC2D models, putting them in line with the DALI models.
Lowering the carbon and oxygen abundances in the DALI AS 209 models by a factor of 2-3 within 120 au would lead to a better match of the DALI CO column to the CO column that is used to reproduce the observed emission in the RAC2D models. This drop in carbon and oxygen abundance would only very slightly lower the \ceC2H abundance and would not impact our conclusions on the C/O ratios of these disks. Therefore we will continue to use the CO depletion factors as derived for AS 209 in Zhang et al. (2021).
The small variation between the DALI models with different C/O ratios showcases the chemical stability of CO. In both oxygen and carbon-rich environments CO incorporates either the vast majority of the carbon, or of the oxygen, whatever is in short supply. CO remains the most abundant observable molecular carrier of elemental C and O. The CO column is thus a good tracer for the gaseous volatile content at a large range of C/O ratios.
Appendix C \ceC2H abundance structures
Figures 6, 7 and 8 show the \ceC2H abundance structures for some of the AS 209, HD 163296 and MWC 480 models that feed into the column densities shown in Fig. 2. There is a clear difference between the AS 209 disk and the MWC 480 and HD 163296 disks at low C/O ratios, with a higher \ceC2H abundance in the AS 209 disk. This is driven by different levels of UV and X-ray flux in these sources. The high X-ray flux of AS 209 allows for more efficient destruction of CO, followed by \ceCH4 and \ceH2O formation. The lower gas-to-small-dust ratio in the surface layer produces less UV penetration, so \ceCH4 and \ceH2O are not quickly reverted back to \ceCO: this allows for higher \ceC2H abundances at low C/O ratios. This also explains why the \ceC2H column density strongly drops in AS 209 for a C/O ratio of 0.47 when the small dust is depleted, the deeper penetrating UV destroys the \ceCH4 and \ceH2O created by X-rays, increasing the amount of atomic oxygen in the gas and lowering the amount of carbon not in CO. The low X-ray flux and larger gas-to-dust ratios in the fiducial HD 163296 and MWC 480 disk models more efficiently force the carbon into CO. Only when carbon is more abundant than oxygen, does the \ceC2H production take off.
Changes in the predicted \ceC2H column densities due to modifications of the small dust distribution are smaller than the effect of varying the C/O ratio in all three disk models. For C/O 1.0, the \ceC2H column density is not strongly dependent on the small-grain column and no uniform change with a varying small-grain content is seen. At C/O = 2, the models with different small-grain abundances in the surface layers clearly follow the small-grain abundance.
This nonlinear interplay between the small dust abundance and C/O ratios is linked to the carbon source for the \ceC2H. At C/O 1.0, the carbon for \ceC2H needs to be released from CO. As CO efficiently self-shields, the amount of CO that is dissociated does not strongly depend on the continuum UV penetration, and is thus not strongly dependent on the small-grain abundance. At high C/O, the carbon comes from \ceCH4 and other hydrocarbons deeper into the disk. Increasing UV penetration will make it easier to extract carbon from these species, and thus increases the \ceC2H abundance (see Bosman et al., 2021a, for a more complete discussion).