Supplementary Material for: Bayesian Optimization of Stimulation Parameters in Brain-Computer Interfaces under Time Constraints and Extreme Noise
Appendix A Full results for part 1 (SOA optimization)
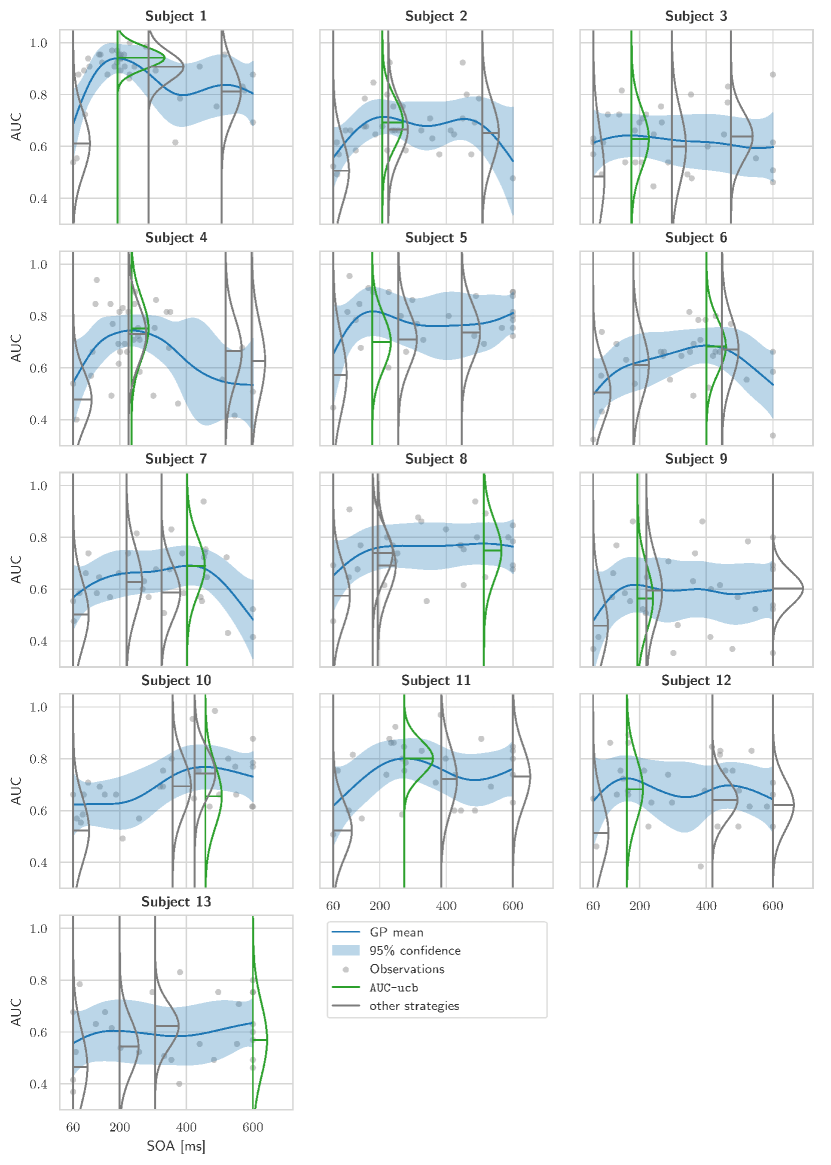
Figure 1 is generated using the data in part_1_optimization_auc_ucb_data.csv and part_2_validation_data.csv and shows the final Gaussian processes of the AUC-ucb strategy, as well as the distribution of the AUCs obtained in part 2 of the experiment. The recorded data (subject number, trial number, evaluated SOA, AUC) in part_1_optimization_auc_ucb_data.csv relates to the AUC-ucb strategy.
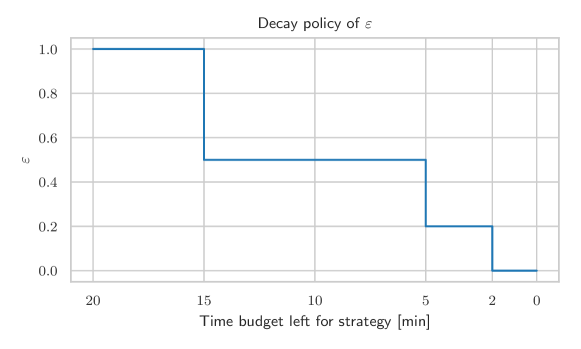
Appendix B Decay policy for epsilon
The used decay policy for the parameter is shown in Figure 2.
Appendix C Full results for part 2 (SOA validation)
The complete results can be found in the attached part_2_validation_data.csv. Note that the strategies in this csv-file are identified by a number as shown in Table 1:
| AUC-ucb | AUC-rand | P300-ucb | P300-rand | fixed60 | manual |
| 1 | 2 | 3 | 4 | 5 | 6 |
In Table 4 of the main paper, the contents of this csv file are shown averaged for each subject/strategy combination. An SOA according to the strategy manual was only chosen, when more than one SOA was dropped due to similarity. The resulting trials and mean AUC values were only used for ERP analysis and not in the context of any analysis in this paper, except for visualization purposes in Figure 2 of the main paper.