Nanoscale self-organisation and metastable non-thermal metallicity in Mott insulators
Abstract
Mott transitions in real materials are first order and almost always associated with lattice distortions, both features promoting the emergence of nanotextured phases. This nanoscale self-organization creates spatially inhomogeneous regions, which can host and protect transient non-thermal electronic and lattice states triggered by light excitation.
Here, we combine time-resolved X-ray microscopy with a Landau-Ginzburg functional approach for calculating the strain and electronic real-space configurations. We investigate V2O3, the archetypal Mott insulator in which nanoscale self-organization already exists in the low-temperature monoclinic phase and strongly affects the transition towards the high-temperature corundum metallic phase. Our joint experimental-theoretical approach uncovers a remarkable out-of-equilibrium phenomenon: the photo-induced stabilisation of the long sought monoclinic metal phase, which is absent at equilibrium and in homogeneous materials, but emerges as a metastable state solely when light excitation is combined with the underlying nanotexture of the monoclinic lattice.
Department of Physics, Università Cattolica del Sacro Cuore, Brescia I-25121, Italy
Department of Physics and Astronomy, KU Leuven, Celestijnenlaan 200D, 3001 Leuven, Belgium
ILAMP (Interdisciplinary Laboratories for Advanced Materials Physics), Università Cattolica del Sacro Cuore, Brescia I-25121, Italy
Scuola Internazionale Superiore di Studi Avanzati (SISSA), Via Bonomea 265, 34136 Trieste, Italy
Diamond Light Source, Didcot, Oxfordshire, OX11 0DE, UK
FemtoNanoOptics group, Université de Lyon, CNRS, Université Claude Bernard Lyon 1, Institut Lumière Matière, F-69622 Villeurbanne, France
IMDEA Nanociencia, Cantoblanco, 28049, Madrid Spain
present address: Pirelli Tyre S.p.A, viale Piero e Alberto Pirelli 25, Milano 20126, Italy
present address: CNR-INO (National Institute of Optics), via Branze 45, 25123 Brescia, Italy
andrea.ronchi@pirelli.com
fabrizio@sissa.it
claudio.giannetti@unicatt.it
Introduction
Since its original proposal back in 1949 [1], the Mott metal-insulator transition keeps attracting interest. For long, experimentalists and theorists have put lot of effort to understand the microscopic bases of such transition in real materials and model Hamiltonians. However, it has recently become urgent to extend that effort towards understanding the dynamics of the Mott transition on multiple timescales and at length scales much longer than the inter-atomic distances [2], which are most relevant for potential applications. Indeed, Mott transitions in real materials have a first order character, often very pronounced, so that driving across such transitions requires one phase, formerly metastable, to nucleate, grow, and finally prevail over the other, formerly stable. In addition, real Mott transitions are nearly all the times accompanied by a lattice distortion, which, besides enhancing the first order character of the transition, also constrains the nucleation and growth dynamics, fostering the emergence of nanotextures within the insulator-metal coexistence region [3, 4]. Moreover, it may happen that also the lower symmetry crystal structure, usually the insulating phase, is inhomogeneous because of coexisting twins [5]. This is often the case when the elastic strain is directly involved in the structural transition.
Such circumstances might, at first sight, be regarded just as unwanted side effects that make the Mott transition more complex. In Mott materials, the onset of high-temperature metallicity is accompanied by the melting of the low-temperature lattice configuration, which is a slow process and implies a complex real-space rearrangement of domains at the nanoscale. This slow dynamics constitutes the bottleneck for the realization of electronic volatile switches operating at frequencies as high as several THz [6], which often discouraged potential applications of insulator-to-metal transitions (IMT) in real materials either driven by temperature changes or by non-equilibrium protocols such as light excitation. In this framework, specific efforts have been recently devoted to investigate possible transient non-thermal states in vanadium oxides, which undergo temperature-driven IMT of great interest for resistive switching and neuromorphic computing applications [7, 8, 9, 10, 11, 12, 13, 14, 15, 16, 17, 18, 19, 20, 6, 21]. Much activity has focused on developing strategies to decouple the electronic and structural changes, with the ultimate goal of achieving all-electronic switching for ultrafast Mottronics. The recent claim of a photo-induced metallic phase of monoclinic VO2 [22, 23] has triggered a huge effort to address to what extent the photo-induced transition is similar to the thermally driven one and whether the electronic and lattice degrees of freedom remain coupled at the nanoscale during and after the light excitation [24, 3, 25, 20, 26].
The goal of this work is to finally clarify the role of spatial nanotexture in controlling the Mott transition dynamics and in favouring the decoupling of the electronic and lattice transformations when the system is driven out-of-equilibrium by light pulses. We focus on the archetypal Mott insulator V2O3 [27, 28, 29, 30], which indeed realises all at once the full complex phenomenology we previously outlined, and thus is the privileged playground to attempt such an effort. A nanotextured metal-insulator coexistence across the equilibrium first order transition in thin films has in fact been observed by near-field infrared microscopy in Ref. 3. Specifically, the metal-insulator coexistence is characterised by a rather regular array of striped metallic and insulating domains oriented along two of the three possible hexagonal axes of the high temperature rhombohedral structure, the missing twin possibly being a consequence of the R-plane orientation of the film [31]. Later, it has been observed, still on thin films but now with a -plane orientation and using X-ray Photoemission Electron Microscopy (PEEM) [32], that the monoclinic insulator is itself nanotextured. In particular, such phase looks like a patchwork of the three equivalent monoclinic twins oriented along the three hexagonal axes of the parent rhombohedral phase. Upon raising the temperature of the monoclinic insulator, metallic domains start nucleating along the interfaces between the monoclinic twins [32], thus forming stripes coexisting with insulating ones, all of them again oriented along the hexagonal axes, in agreement with the experiment in Ref. 3. The origin of this complex nanoscale self-organization, which was tentatively attributed to the long-range Coulomb repulsion[3], still remains unexplained.
In this work we develop a coarse-grained approach that is able to capture the real-space lattice and electron dynamics of the IMT in V2O3. Our model demonstrates that the intrinsic nanotexture is driven by the elastic strain associated to the monoclinic lattice distortion. The full understanding of the transition dynamics also discloses the possibility of stabilizing a non-thermal metallic electronic state, which retains the insulating monoclinic lattice structure. This state is unfavorable at equilibrium and in homogeneous materials, but it can be photo-induced when the electronic population within the vanadium 3 bands is modified by ultrafast light pulses. The intrinsic nanotexture is key to create the strain conditions at the boundaries of the monoclinic twins, which protect and stabilize the non-thermal monoclinic metallic phase. We experimentally demonstrate the existence of such a metastable phase by performing novel synchrotron-based time-resolved X-ray PEEM (tr-PEEM) experiments with 30 nm and 80 ps spatial and temporal resolution. The excitation of V2O3 thin films with intense infrared (1.5 eV) ultrashort light pulses turns the material into a metal with the same shear strain nanotexture of the insulating phase. Even though all experimental and theoretical results we are going to present refer to vanadium sesquioxide, they reveal an unexpected richness that may as well emerge in other Mott insulating materials. The role played by the spontaneous nanoscale lattice architectures characterizing first-order IMT provides a new parameter to achieve full control of the electronic phase transformation in Mott materials.
The work is organized as follows. Firstly, we provide an overview of the lattice and electronic transformations which characterize the phase diagram of V2O3, as well as characterization of the spontaneous nanotexture of the monoclinic insulating phase. This information is crucial since it provides the microscopic bases of the multiscale model of the lattice and electronic transition. Secondly, we introduce the model, based on proper Landau-Ginzburg functionals, and we show how it captures the nanotexture formation as well as the dynamics of the temperature induced phase transition. Finally, we present the central non-equilibrium results. The multiscale model is extended to treat the non-equilibrium case. The model shows that the nanotexture can favour and stabilize a non-thermal electronic metallic phase which retains the monoclinic shear strain of the low-temperature lattice. We experimentally demonstrate this phenomenon by performing tr-PEEM measurements on V2O3 thin films disclosing the ultrafast dynamics with spatial resolution. Finally, we also show the possibility of controlling the non-thermal transition dynamics by interface strain engineering.
0.1 The V2O3 phase diagram and lattice transformation
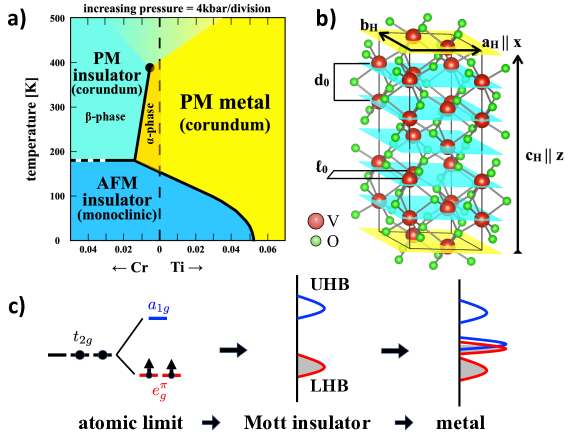
The phase diagram of (V1-xMx)2O3, M=Cr,Ti, is shown in Fig. 1(a). It includes rhombohedral paramagnetic insulator and metal phases with corundum structure, and a low temperature dome where the system is a monoclinic antiferromagnetic Mott insulator. The effect of pressure is, as expected, to favour the metal phase, alike that of Ti doping, although, above 32.5 GPa, such metal appears to be also monoclinic at room temperature [33, 34]. The low-pressure transition from the high temperature corundum structure to the low temperature monoclinic one has a first order nature that weakens with Cr doping , and maybe turns continuous above . For pure V2O3, the case of interest here, dashed vertical line in Fig. 1(a), the electronic, magnetic and structural transition that occurs at in bulk crystals has a very pronounced first order character: the jump in resistivity covers almost six orders of magnitude [28], and the strain-driven rhombohedral-monoclinic martensitic transformation [35] can be rather destructive if the sample is not dealt with care.
In the rhombohedral phase above , V2O3 crystallises in a corundum structure, space group No. 167. The non-primitive hexagonal unit cell contains six formula units, and has the lattice vectors shown in Fig. 1(b), where [36, 28, 37]
| (1) |
and, by convention, we choose and . The vanadium atoms form honeycomb planes with ABC stacking, see also the Supplementary Note 2 [38]. It follows that each Vanadium has only one nearest neighbour along the hexagonal -axis. We hereafter denote such vertical pairs as dimers. Moreover, the two inequivalent V atoms within each honeycomb plane do not lie on such plane, see Fig. 1(b): the atoms that form dimers with the plane above/below are shifted down/up. The dimer bond length is slightly shorter than the distance between nearest neighbour V atoms within the hexagonal planes, specifically
| (2) |
Such difference reflects a trigonal distortion of the oxygen octahedra surrounding each vanadium, which is responsible of the V- orbital splitting into a lower
doublet and an upper singlet, and is believed to play a crucial role in the Mott metal-insulator transition [39]. In Fig. 1(c) we draw
an oversimplified picture of the Mott transition to emphasise the role of the trigonal
crystal field splitting.
The magnetic insulator below has a monoclinic crystal structure, space group , No. 15. The structural distortion breaks the rotation symmetry around the -axis, and can be viewed [36] as a rotation of the atoms in a plane perpendicular to one of three hexagonal axes, , and . The three choices correspond to equivalent monoclinic structures, which are distinguishable only in reference to the parent corundum state. We shall here choose for simplicity the rotation axis, which becomes the monoclinic primitive lattice vector , so that the rotation occurs in the plane, where the monoclinic lattice vectors and lie. Concerning magnetism, each plane is ferromagnetic, while adjacent planes are coupled to each other antiferromagnetically, see Figs. 2(a)-(b). In other words, the dimers, which do lie in the plane, are ferromagnetic. Similarly, of the three nearest neighbour bonds in the hexagonal plane, the one lying in the plane of length is therefore ferromagnetic, while the other two, of length and , are antiferromagnetic, see Fig. 2(a).
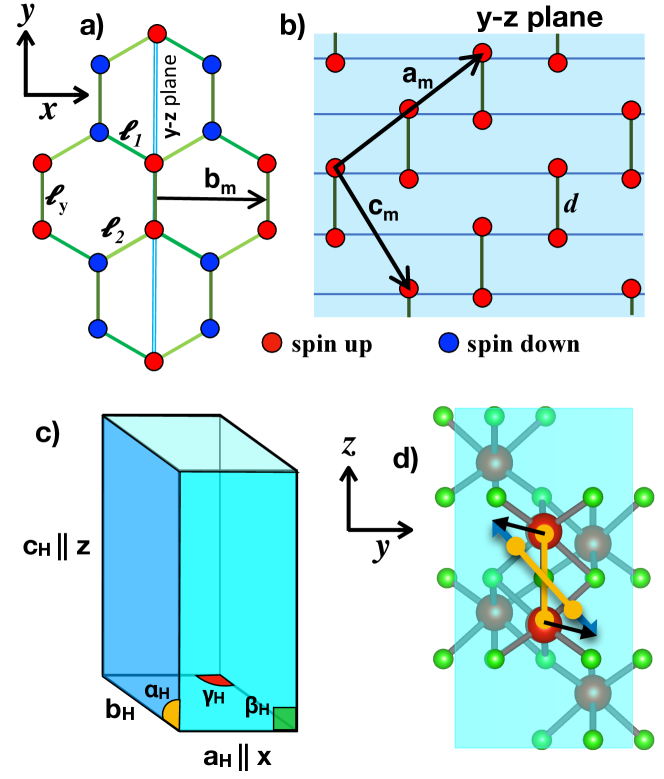
Given our choice of the monoclinic twinning, the relation between monoclinic and hexagonal lattice vectors [28, 36] are graphically shown in Figs. 2(a)-(b). However, for later convenience, we hereafter prefer to use a non-primitive pseudo-hexagonal unit cell, see Fig. 2(c). With such choice the monoclinic phase corresponds to
| (3) | ||||||||
as opposed to the corundum parameters in Eq. (1), with
and . The corundum-to-monoclinic transition is therefore accompanied by a volume expansion of 1.4% [28], as expected across a metal-insulator transition.
Considering the nearest neighbour V-V distances in the hexagonal plane,
, , and , and the dimer length , see Fig. 2,
in the monoclinic phase as compared to the rhombohedral one (), see Eq. (2), grows by , by , while
and are almost unchanged, one is shorter and the other longer.
In other words, in accordance with the Goodenough-Kanamori-Anderson rules, all
ferromagnetic bonds lengthen, the planar one quite a bit more than the dimer.
Results and Discussion
0.2 Spontaneous nanotexture of the monoclinic insulating phase
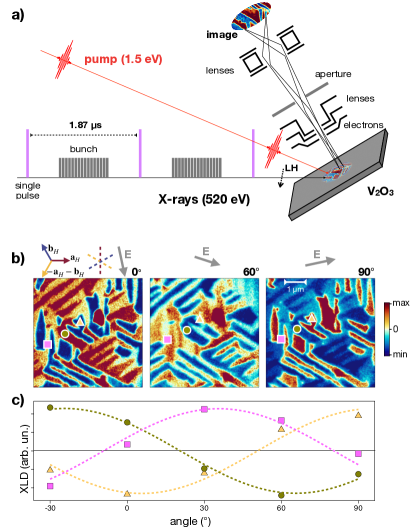
As described in Ref. 32, equilibrium Photo-Emission Electron Microscopy (PEEM), exploiting X-ray Linear Dichroism (XLD)[40] as the contrast mechanism, can be used to investigate the dynamics of the rhombohedral to monoclinic transition in real space. As shown schematically in Fig. 3a, Linear Horizontal (LH) -polarized X-ray pulses in resonance with the V -edge (520 eV) impinge with 75∘ incident angle on a V2O3 film epitaxially grown on a (0001)-Al2O3 substrate, therefore with the -axis oriented perpendicular to the surface of the film [41]. In order to optimize the signal and remove possible backgrounds and artifacts, each reported image is the difference between images taken with X-ray pulses at 520 eV, for which the contrast between signals from different possible monoclinic distortions is maximum, and 518 eV, for which the contrast is minimum [42, 32]. In Fig. 3b we report typical spatially-resolved XLD-PEEM images taken at =100 K, i.e., fully in the monoclinic insulating phase of V2O3. For each direction of the X-rays polarization (see the grey arrows on top of the images) three different striped insulating nano-domains, indicated with red, blue and yellow colours, are clearly visible. The stripe-like domains evidently follow the hexagonal symmetry of the undistorted rhombohedral phase, with characteristic dimensions of a few micrometers in length and 200-300 nm in width. The observed spontaneous nanotexture of the monoclinic phase demonstrates that the minimization of the total elastic energy drives the formation of domains in which the monoclinic distortion takes place along one of the three equivalent directions. As extensively discussed in Ref. 32, when the system is heated up and the coexistence region is entered, rhombohedral metallic droplets start nucleating at the domain boundaries. Upon further heating up, the domains grow until the insulator-to-metal percolative transition takes place at a metallic filling fraction of the order of 0.45. We mentioned that each monoclinic domain is uniquely identified by the monoclinic , which can be any of the primitive hexagonal vectors, , or , and thus define three axes at from each other. That is revealed by rotating the X-ray polarization and plotting the XLD signal integrated over specific regions (pink square, green circle and yellow triangle in Fig. 3b) corresponding to the three different domains. As shown in Fig. 3c, the XLD signal of the three different domains is indeed phase-shifted by 60∘ and has a 180∘ periodicity.
To interpret these observations, in Supplementary Note 3 [38] we calculate the polarization dependence of the XLD contrast within the monoclinic phase. In brief, the singlet and the doublet transform, respectively, as the one dimensional, , and two dimensional, , irreducible representations of . The monoclinic distortion generates a mixing between and the combination of the that lies on the monoclinic plane, i.e., perpendicular to . Such combination evidently changes among the three equivalent monoclinic twins, and, because of its directionality, it does contribute to the XLD signal, which we predict is minimum (maximum) for in-plane components of the field parallel (perpendicular) to the axis. Since the latter can be any of the three hexagonal axes, that immediately explains the observation in Fig. 3 and allows inferring the direction of primitive hexagonal vectors, which are shown in the figure. In addition, the data reported in Fig. 3 make us conclude that the interface between two monoclinic twins forms along the direction perpendicular to the axis of the third one.
0.3 Multiscale modelling
The self-organization of the monoclinic insulating phase on length scales of the order of hundreds nanometers calls for a multiscale theory effort which builds on the microscopic parameters governing the transition but goes beyond by describing the formation of domains at length scales much larger than the lattice unit cell. Already Denier and Marezio [36] emphasised that the main change that occurs across the rhombohedral to monoclinic transition is actually the displacement of the V atoms of a dimer towards "the adjacent octahedral voids", see Fig. 2(d) and also the Supplementary Note 2 [38]. Such displacement results in a anticlockwise rotation of the dimers around the axis, thus the value of and the axis compression in Eq. (3). In addition, the dimer elongates by . More specifically, the Vanadium displacement, with our choice of monoclinic axis , has non negligible components along both and , the former leading to the dimer tilting, and the latter mostly responsible of the stretching of the bond. We remark that the tilting alone accounts not only for the variations of and , but also for the increase in , which is the most significant change crossing the structural transition, as well as for the dilation along the hexagonal , cf. Eq. (1) with (3). Therefore, the deformation of the unit cell across the transition is primarily a consequence of the dimer tilting, namely of the Vanadium displacements along .
Hereafter, we thus make the assumption that the and components of the vanadium displacement, or, equivalently, the dimer tilting and its elongation, correspond to different degrees of freedom,
by all means coupled to each other [43], but each playing its distinctive role.
The tilting is ultimately responsible of breaking the threefold rotation symmetry around , and thus of the rhombohedral to monoclinic transition,
which may not necessarily go along with a metal-insulator transition.
DFT-GGA electronic structure calculations, which are supposedly valid at weak-coupling, predict [44]
that the Fermi surface of the corundum metal is unstable towards a monoclinic distortion. However, that same instability is also found in the opposite strong-coupling limit. Indeed, assuming a Mott insulating state in which each Vanadium acts like a spin-1, see Fig. 1(c), it was shown [44] that V2O3 realises on each honeycomb plane a highly frustrated Heisenberg model, with comparable nearest and next-nearest neighbour antiferromagnetic exchange constants [45, 46, 47].
Such frustration is efficiently resolved by the monoclinic distortion stabilising the stripe phase shown in
Fig. 2(a). This prediction has got further support by recent inelastic neutron scattering data combined with DFT calculations [48]. All the above
results suggest that the corundum phase of pure V2O3 is intrinsically unstable, and destined to turn into a monoclinic phase at low temperature. The fact that such transition happens to coincide with a metal to an antiferromagnetic insulator transition indicates just a strong positive interplay between the lattice instability and the electronic
correlations [43, 44, 48].
However, nothing would prevent the
structural and the metal-insulator transitions to occur separately. Indeed, chromium doping, see Fig. 1, does drive a metal-insulator transition without an intervening monoclinic distortion. The opposite case of a monoclinic transition not accompanied by a metal-insulator one is still highly debated. Evidences of a monoclinic metal phase have been observed in V2O3 at high pressure [33, 34]. On the contrary, at ambient pressure the possible existence of a monoclinic metal phase remains so far
controversial [49, 50, 51, 3, 52, 32, 53, 54, 26].
The vanadium displacement along preserves the space group but
lengthens the dimers, thus weakening their bonding strength and
increasing the trigonal field splitting between lower and upper . Both those effects are believed [39]
to drive V2O3 towards a Mott insulating state irrespective of the monoclinic distortion, even though how they precisely affect the low-energy single-particle spectrum approaching the transition is still under debate [39, 55].
However, the existence of a strong connection between the -displacement of vanadium and the Mott transition is undeniable. That connection can be more neatly inferred
comparing, see Fig. 1, the rhombohedral paramagnetic Cr-doped insulator, so-called -phase, with the rhombohedral paramagnetic metal phase of pure V2O3, or of the weakly Cr-doped metallic -phase.
Indeed, the most noticeable structural change that occurs at room temperature in the
insulating -phase as opposed to the metallic phases is the % increase [56, 57] of the parameter that identifies the Wyckoff position of V in the space group. Physically, determines the dimer length , see Supplementary Note 2 [38],
which significantly increases in the
-phase [56, 57]. This observation suggests that , or, equivalently, the dimer length, must be intimately correlated to the metal versus insulator character of Cr-doped with respect to pure V2O3, otherwise it is not comprehensible why increases despite decreases [56, 57]. Moreover, larger values of presumably correspond
to larger orbital polarisation [58], consistent with the evidence
that grows across the metal-to-insulator transition [42, 59]. The only exception is the pressure driven transition from the -insulator to the -metal, across which does not show appreciable changes [59]. In that case, however, the behaviour of the dimer length across the transition is not known, and the homogeneity of the -metal not guaranteed [60, 61].
We shall here give up any attempt to describe microscopically the
rhombohedral-to-monoclinic and metal-to-insulator transitions
in V2O3, and instead resort to a more macroscopic approach based on a Landau-Ginzburg theory for the order parameters that characterise, respectively, the two transitions. As we discussed, the
order parameter associated with the metal-insulator transition
can be legitimately identified with the dimer length . We emphasise that such identification by no means implies that alone drives the transition, which is
mainly of electronic origin, but just that the behaviour of mimics
faithfully that of resistivity, and thus, in the spirit of a Landau-Ginzburg approach,
that can be rightfully promoted to the order parameter of that transition.
The tilting of the dimer is instead directly linked to the shear elements
and of the strain tensor, which behave like the components of a planar vector
| (4) |
see Supplementary Note 2 [38]. We can therefore associate with the two-component order parameter of the rhombohedral to monoclinic transition. Specifically, using the structural data of the corundum and monoclinic structures across the transition [36, 28, 37], and in our reference frame, the shear strain order parameter just after the transition has magnitude , and three possible orientations, i.e., monoclinic twins, defined by the phases, see Eq. (4),
| (5) |
In other words, is directed along .
The Landau-Ginzburg functional that we are going to present and study is therefore just the Born-Oppenheimer effective potential of the shear strain and dimer length . As such, that potential is substantially contributed by the electrons, though the latter do not appear explicitly. As earlier mentioned, we do not attempt to derive the Born-Oppenheimer potential by directly tracing out the microscopic electronic degrees of freedom [62, 63, 64]. On the contrary, we build the Landau-Ginzburg functional by rather general arguments, mainly based on symmetry
as well as on the phase diagram, Fig. 1, and physical properties of
V2O3. In addition, we infer the
behaviour, in temperature and Cr-doping, of all parameters that characterise the Born-Oppenheimer potential through experiments, which are fortunately abundant for this compound.
0.4 Landau-Ginzburg theory of the structural transition
A Landau-Ginzburg free energy
functional for the space dependent order parameter
is rather cumbersome to derive, since all other components of the strain, beside the order parameter, are involved, and need to be integrated out to obtain a functional of
only. This is further complicated by the constraints due to the Saint-Venant compatibility equations, which avoid gaps and overlaps of different strained regions and play a crucial role in stabilising domains below the martensitic transformation [65, 66, 67]. Therefore, not to weigh down the text,
we present the detailed derivation of the Landau-Ginzburg
functional in the Supplementary Note 4 [38], and here just discuss the final result in the -plane oriented film geometry of the experiments.
We find that the shear strain two-component order parameter is controlled by the energy functional [38]
| (6) | ||||
where is the two dimensional coordinate of the film, is the strain stiffness, the strength of the standard anharmonic quartic term that makes bounded from below, a positive parameter that depends on the elastic constants and [38], while is directly proportional to the elastic constant [38]. The quadratic coupling constant encodes the electronic effects that, as earlier mentioned, make the corundum structure unstable at low temperature towards a monoclinic distortion, and thus drives the transition. Therefore, is positive in the high-temperature corundum phase and negative in the low-temperature monoclinic one. We emphasise that the above elastic constants refer to the space group, so that, e.g., simply means that the rhombohedral phase has become unstable. The last term in (6) derives from the Saint-Venant compatibility equations [38]. Specifically,
| (7) |
where the long-range kernels have the explicit expressions:
| (8) | ||||
and favour the existence of domains in the distorted structure [65, 66, 67]. The orientation of the interfaces between those domains is instead determined by the additional constraint we must impose [38] to fulfil the Saint-Venant equations, namely the curl free condition
| (9) |
If , the energy (6) is minimum at the angles defined in Eq. (5) when
. The constraint (9) implies that a sharp interface between two domains, identified by two of the three possible directions of , is oriented along the third one,
namely along a mirror plane of the space group . This is exactly what is found experimentally,
as we earlier discussed.
We also note that the minima of the energy functional (6) depend on the values and signs of and . Physically, implies that an anticlockwise/clockwise rotation of the
dimers in the plane drives an expansion/compression of the axis, and vice versa for
.
The corundum phase, ,
is a local minimum for , being the rhombohedral spinodal point. Similarly, a monoclinic phase is a local minimum for , where
the monoclinic spinodal point . Phase coexistence thus occurs when , and also the structural transition
must take place at within that same interval.
At ambient temperature and pressure, ,
which must be
greater than since the stable phase is corundum,
and [68, 69, 70], so that is negative, too.
Well below the structural transition at ambient pressure, must be smaller
than . Moreover, since the observed monoclinic distortion corresponds to an anticlockwise rotation
of the dimers and an expansion of , the low-temperature value of has to be positive. Therefore,
upon lowering temperature , must decrease, while
must increase and cross zero. There are actually
evidences, specifically in chromium doped compounds [69], that does change sign approaching the transition from the corundum phase.
We are not aware of any experimental measurement of in pure V2O3 below room temperature. Therefore, here we can only conjecture what may happen.
One possibility is that crosses zero right at the structural transition,
. In such circumstance, the transition
may become continuous [71], which is likely the case of Cr doping with
[72].
The alternative compatible with the
ambient pressure phase diagram in Fig. 1 for pure or weakly Ti/Cr doped V2O3 is that becomes positive at temperatures higher than , thus the observed first order transition from the corundum phase, , to the monoclinic one, .
There is still a third possibility that crosses at high temperature,
when is still negative. In that case, the monoclinic phase
that establishes for corresponds to a shear strain different from that observed in V2O3 at ambient pressure, specifically to a dimer tilting in
the clockwise direction or, equivalently, to opposite vectors. This is presumably what happens in the monoclinic metal
phase observed above 32.5 GPa at 300 K [33].
Here, we shall not consider such extreme conditions, and therefore take for granted that, at ambient pressure and for high temperatures such that is negative, remains greater than , so that the stable phase is always rhombohedral. Moreover, since we are just interested in pure V2O3, we shall assume that becomes positive well above the structural transition, around which we shall therefore consider constant, and , with a parameter playing the role of a reduced temperature.
0.5 Contribution from the dimer stretching
The energy functional (6) controls only the shear strain ,
namely the dimer tilting. We still need to include the contribution of the
dimer length , which is assumed to play the role of the metal-insulator transition order parameter. For that, it is
more convenient to start with the isostructural paramagnetic metal and paramagnetic insulator phases, and , respectively, of Cr-doped V2O3, and only after include the coupling to the shear strain order parameter . We note from Fig. 1 that the transition from the phase to the one
is first order, across which suddenly rises, occurs at a temperature that depends on the Cr-doping , and terminates at a second order critical point; a phenomenology reminiscent of a liquid-gas transition, as predicted [73, 74] and experimentally confirmed [75].
In view of that analogy, we can reasonably assume that feels a double-well potential, the well centred at the
smaller representing the metal and the other at the insulator, in presence of a symmetry breaking term that lowers either of the wells and depends on and .
When the dimers rotate, the vanadiums at the endpoints tend to move towards the octahedral voids, and thus increases,
see Fig. 2(d). This suggests that a finite shear strain acts as a further symmetry breaking term, which lowers the potential well at larger , in this way favouring the insulating phase.
We mention that the positive interplay between the dimer tilting and its lengthening has been convincingly demonstrated by Tanaka in Ref. 43.
Therefore, if we replace
with the dimensionless space-dependent field
| (10) |
so that when and at , we can assume described by the energy functional
| (11) |
with both and positive, where the potential well at corresponds to smaller values, thus to the metal phase,
while the well at to the larger- insulator, and both may coexist. The parameter
plays the role of the above mentioned symmetry breaking term: () lowers the well centred at (), thus stabilises the metal (insulator). A finite shear strain contributes to
favouring the insulating well at , thus the term in Eq. (11).
Comparing with the phase diagram of (CrxV1-x)2O3 in Fig. 1 above the rhombohedral-monoclinic transition temperature, thus when , we must conclude that
is positive in the -phase and negative in the one, and thus decreases with increasing both and , crossing zero at the first order metal-insulator transition line .
Alternatively, can be regarded as the threshold strain above which
an insulating phase becomes stable in a monoclinic phase with .
0.6 Total energy functional
Adding the shear strain energy in Eq. (6) to the dimer stretching contribution in Eq. (11), we obtain the total energy functional
| (12) |
which can describe rhombohedral and monoclinic phases, either metallic or insulating.
For instance, assuming from high to low temperatures
in Eq. (11),
the energy functional (12) predicts a transition from a rhombohedral insulator to a monoclinic
one upon lowering , i.e., the reduced temperature ,
as indeed observed above 1% of Cr doping, see Fig. 1.
Pure V2O3 corresponds instead to assuming from high to low temperatures.
In this case, the stable rhombohedral phase, with , is metallic. Upon crossing the
first order structural transition at , jumps directly to a finite value, , which
grows upon further lowering .
If we assume, in agreement with the most recent experimental claims [54], that at equilibrium there is no monoclinic metal phase in between the rhombohedral metal and monoclinic insulator, we must conclude that just after
the transition to the monoclinic phase , so that the global
monoclinic minimum is always insulating.
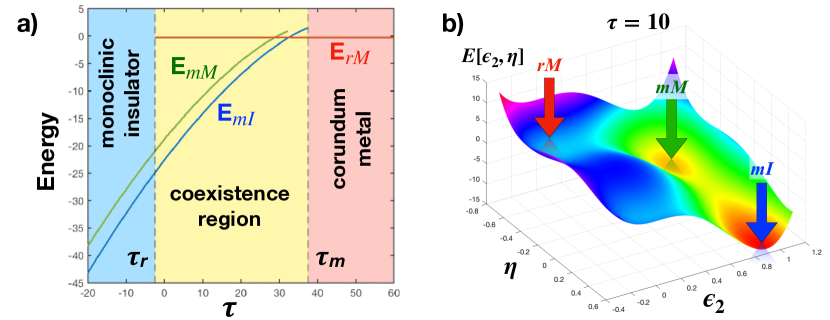
Consequently, we fixed the parameters of the energy functional so that,
assuming homogeneous phases, i.e., neglecting the Ginzburg term and the long
range potential, in Eq. (6), the phase diagram,
see Fig. 4(a),
shows a direct first order transition from a corundum metal to a monoclinic insulator,
with a coexistence region of width consistent with experiments. We emphasise that the absence of a stable monoclinic metal does not exclude
its presence as a metastable phase that is allowed by the energy functional (12),
and which we indeed find, see Fig. 4(b).
0.7 Domains at equilibrium
We mentioned that the long range elastic potential in (6) favours [65] the existence of domains in the lower symmetry monoclinic phase, which seem to persist also within the insulator-metal coexistence region across the first order transition [3, 53, 54, 32]. Since the configurational entropy in presence of different domains plays an important role at finite temperature, we cannot simply search for the minima of the classical energy functional Eq. (12) varying the reduced temperature , as in Fig. 4, but we need to calculate actual thermodynamic averages. For that, we take inspiration from the mean field theory developed in Refs. 76, 67, which was originally developed for ferroelastic transitions, and we extend it to treat the lattice and electronic insulator-to-metal nanotextured dynamics in a Mott material. We discuss thoroughly such mean-field scheme in the Supplementary Note 4 [38], while here we just present the results.
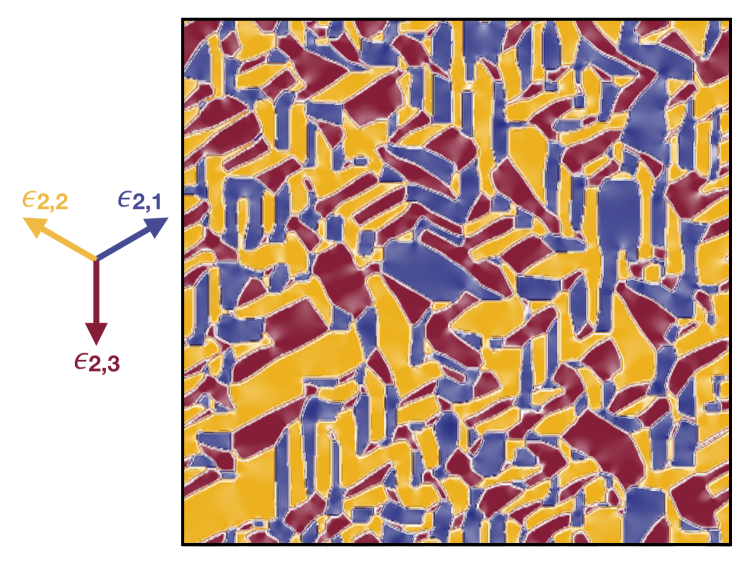
In Fig. 5 we show the calculated real space distribution of the shear strain at low temperature, i.e., deep inside the monoclinic insulator. As expected, the distribution is not homogeneous, but shows coexistence of equivalent monoclinic twins, each characterised by a colour that corresponds to one of the three equivalent shear strain vectors , , see Eq. (5), which are shown on the left in Fig. 5. We note that the interface between two domains, i.e., two strain vectors and , , is directed along the third vector, , , in accordance with the curl-free condition (9), and with the experimental data presented in Sec. 0.2. In addition, the strain along the interfaces is strongly suppressed as compared to the interior of each domain, as indicated by the lighter regions in Fig. 5. The inherent suppression of the strain amplitude at the domain boundaries will turn out to play a fundamental role in seeding and stabilizing the photo-induced non-thermal metallic phase.
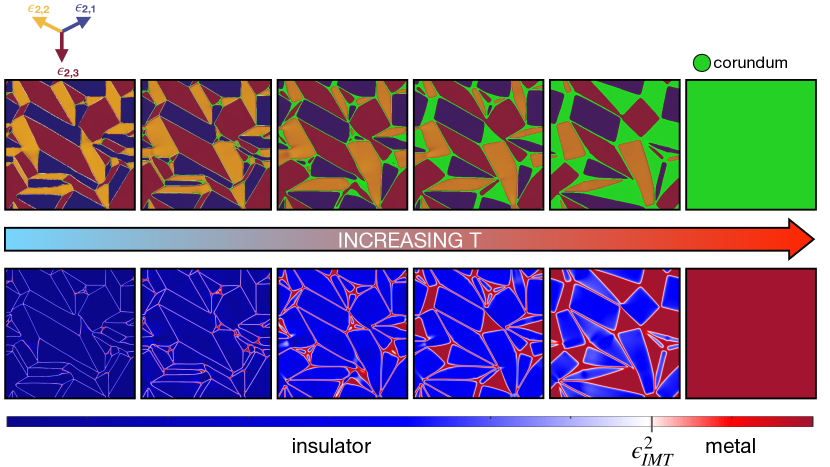
In the top panel of Fig. 6 we show the calculated real space distribution of
within the monoclinic-rhombohedral coexistence region across the temperature driven first-order transition, where the green colour indicates
the rhombohedral domains. The bottom panel of Fig. 6 instead shows
the real space distribution of ,
which is finite in any monoclinic domain, and zero in rhombohedral ones.
We mentioned that the insulator is locally stable if the shear-strain amplitude
square , otherwise the locally stable phase is metallic.
For that reason, we use in the bottom panel of Fig. 6 a blue colorscale for
all regions where , and a red colorscale for , the two colours thus distinguishing between insulating and metallic domains. We note that, as raises, metallic domains start to nucleate first with
a residual monoclinic strain, light red, that soon disappears, dark red. This gives
evidence that the metastable monoclinic metal does appear across the
monoclinic-rhombohedral phase transition, even though it gives in to the rhombohedral metal before a percolating metal cluster first sets in, in accordance with
experiments [54].
We also observe that rhombohedral domains, dark red, have triangular shapes, as
dictated by the curl-free condition (9) at the interfaces between
monoclinic and rhombohedral domains. This pattern does not resemble the observed
experimental one [3]. This difference is due to the -plane
orientation that we use, in contrast to the A-plane one in the
experiment [3].
0.8 Space-dependent non-equilibrium model
We note that the above theoretical modelling may also account for the experimental evidences [20, 32, 10] of a photo-induced metal phase in V2O3. As discussed in Refs. 20, 32, the main effect of the 1.5 eV laser pulse is to transfer electrons from the to the derived bands, see Fig. 1(c). The increase in population at the expense of the one is supposed to yield a transient reduction of the actual trigonal field splitting between and orbitals. Indeed, an effect of Coulomb repulsion, captured already by mean-field approximation, is to make occupied and empty state repel each other, thus increasing their energy separation. This is the reason why the trigonal field splitting between lower and upper is renormalised upward by Coulomb interaction. Evidently, also the reverse holds true: if electrons are transferred from the more occupied state to the less occupied one, the energy separation between them diminishes, which amounts to a net reduction of the effective trigonal field splitting. Such effect of the laser pump can be easily included in the double-well potential (11) that describes the dimer stretching, i.e., the trigonal splitting, by adding a laser fluence, , dependent term linear in , namely
| (13) |
with , being zero at and growing with it, thus favouring the metal state with . This term is actually equivalent to a fluence dependent threshold strain
| (14) |
that increases with . Looking at the bottom panel of Fig. 6, such upward shift of implies not only that formerly insulating regions with may turn metallic, but also the possibility that a laser pulse with a fluence exceeding a threshold value stabilises the formerly metastable monoclinic metal. Indeed, we earlier mentioned that we fix smaller than the shear strain amplitude just after the rhombohedral to monoclinic first order transition, which ensures the absence of a stable monoclinic metal at equilibrium. After laser irradiation, may well surpass the shear strain amplitude, in turn reduced by heating effects, when exceeds a threshold fluence, thus stabilising the monoclinic metal, metastable at equilibrium.
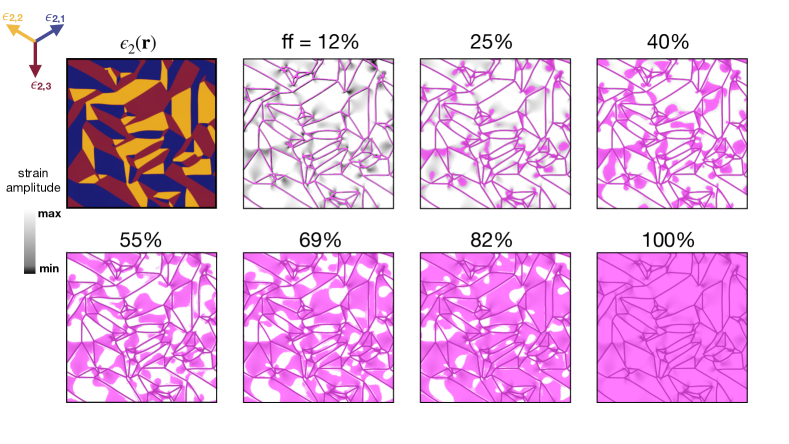
In order to simulate the spatial dynamics of the laser-induced metalization, we start from the calculated shear strain map, reported in Fig. 5. As the pump excitation fluence rises, the concurrent increase of leads to the possible nucleation of non-thermal metal regions with finite monoclinic shear strain, whenever the condition is met. In Fig. 7 we report the spatial configuration of such domains (purple areas), which are metallic and yet characterized by the same in-plane monoclinic nanotexture of the insulating phase (see Supplementary Note 4 [38] for the parameters). We note that the non-thermal metal starts nucleating at the boundaries between different monoclinic twins, where, as previously discussed, the strain is constrained to smaller values than in the interior of each domain. As increases, the filling fraction of the non-thermal metal phase grows progressively up to the point of occupying the entire region.
0.9 Time-resolved PEEM experiments
To demonstrate that such intriguing scenario indeed realises in photoexcited V2O3, we developed a novel time-resolved X-ray PEEM experiment (see Fig. 3a) with 30 nm and 80 ps spatial and temporal resolution (see Methods and Supplementary Note 1 [38] for the experimental details). With this imaging method we studied the temporal response of the monoclinic domains triggered by a properly synchronized pulsed laser excitation (1.5 eV photon energy; 50 fs pulse duration) capable of impulsively changing the and band population and possibly inducing the non-thermal metallic monoclinic state. At this photon energy, the light penetration depth is 300 nm, as extracted from the refractive index reported in Ref. 77. Considering that the escape depth of electrons in the total yield configuration used for acquiring the PEEM images is of the order of 3-5 nm [78, 79], the pump excitation can be assumed as homogeneous within the probed volume.
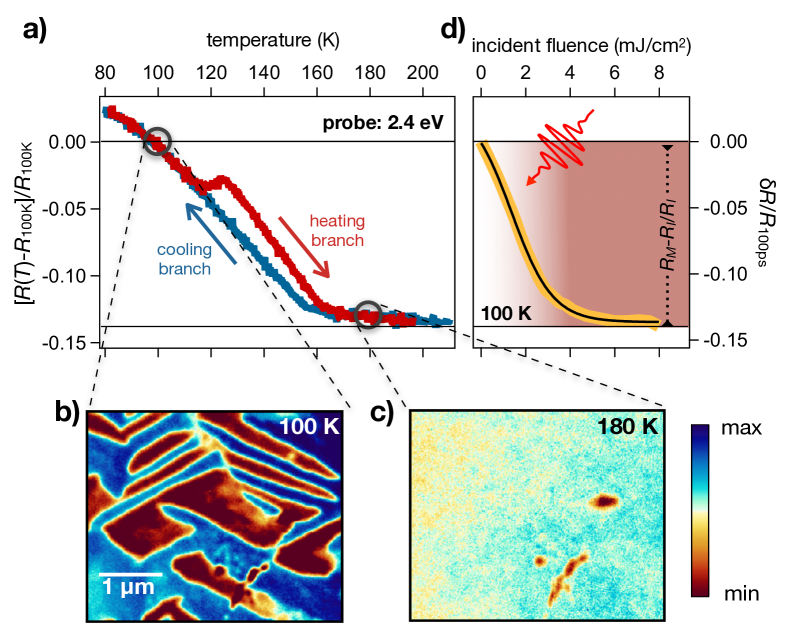
The time-resolved experiments were performed on a 50 nm V2O3 crystalline film deposited by oxygen-assisted molecular beam epitaxy on a sapphire substrate, with -axis perpendicular to the surface [41]. In order to characterize the IMT, we first measured the temperature-dependent optical properties at a selected probe photon energy (2.4 eV) during the heating and cooling cycles. The curve reported in Fig. 8a shows the typical hysteresis of the insulator to metal transition with mid-point at 140 K, slightly smaller than that observed in bulk crystals as a consequence of the film residual strain [41]. The reflectivity at 2.4 eV drops by 14% when the temperature is increased from 100 K (insulating phase) to 180 K (metallic phase), while the film resistivity drops by approximately 3 orders of magnitude (see Supplementary Figure 5 [38]). Figs. 8b and 8c show equilibrium XLD-PEEM images of the sample taken at =100 K and 180 K, respectively. As discussed at length in Sec. 0.2 the XLD-PEEM images clearly evidence in the low temperature monoclinic phase the formation of stripe-like domains corresponding to different monoclinic twins [32]. When the temperature is increased well above , the monoclinic nanotexture is replaced by a homogeneous corundum phase with almost absent XLD contrast.
As extensively discussed in the literature[80, 24, 25, 20, 52, 32], the electronic IMT can be also photo-induced by using ultrashort infrared pulses as the external control parameter. When the excitation is intense enough, the insulating phase collapses on a timescale of 30-50 ps transforming into a new phase with the same optical properties as the metallic one, both in the THz[24, 25] and in the infrared/visible[32] frequency range. We monitored such transformation in our sample by recording the relative reflectivity variation after 100 ps between the optical pump and probe, i.e. when the time-resolved signal already reached a plateau (see Figure S6). In Fig. 8d we show the relative reflectivity variation at 2.4 eV probe photon energy as a function of the impinging pump fluence. Above , the measured reflectivity drop perfectly matches the equilibrium reflectivity difference between the insulating and metallic phases, thus demonstrating that the whole of the pumped volume is turned into the electronic metallic phase.
In order to investigate the dynamics of the monoclinic domains during the photo-induced insulator-to-metal transition, we performed a XLD-PEEM experiment exploiting the inherent pulse structure of the synchrotron X-ray radiation and the synchronization with a femtosecond laser source, which allows turning the XLD-PEEM experiment into a time-resolved microscopy tool with 80 ps time-resolution (see Methods and Supplementary Note 1 [38]). The experiment was carried out on the same sample, and in the same experimental conditions as the optical pump-probe results reported in Fig. 8d, in order to avoid possible artefacts related to different average heating in the two experiments [26]. We underline that after heating and cooling the system, the topology of the domains remains unchanged. The repeatability and stability of the domain formation, discussed in Ref. 32, is the prerequisite for performing the time-resolved experiment, which consists into an average over many different pulses. The pump-probe spatial and temporal overlap, as well as the pump spot size, were carefully checked by exploiting the non-linear photoemission from surface impurities, as explained in detail in the Supplementary Note 1 [38], and by imaging the pump beam at the sample position.
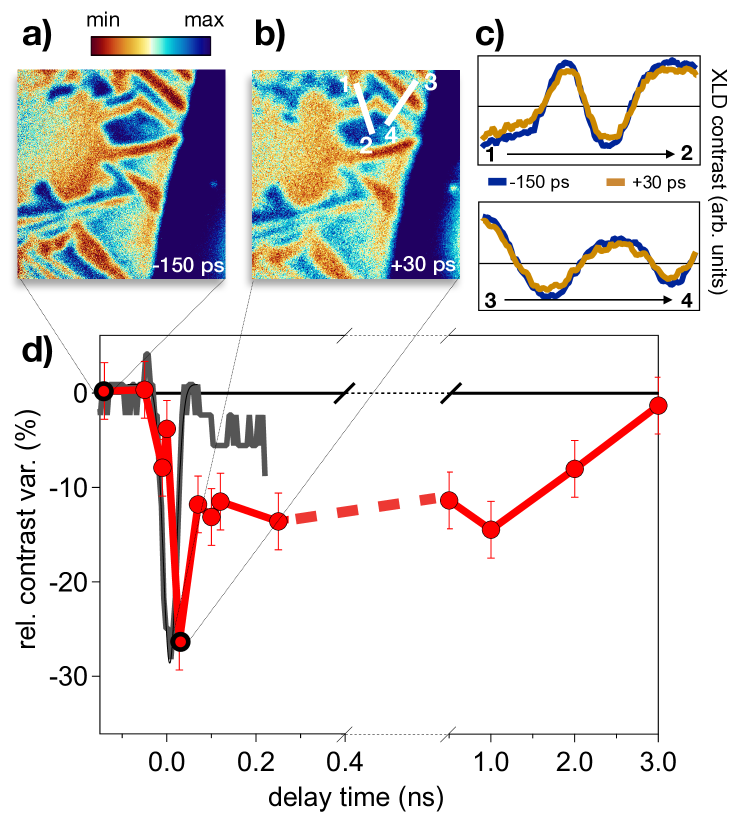
Fig. 9 displays a typical image of the monoclinic domains 150 ps before (panel a) and 30 ps after (panel b) the excitation with laser pulses at 224 mJ/cm2 fluence, which exceeds by far the threshold necessary to photoinduce the complete transformation into the electronic metallic phase. Although the low signal-to-noise and the large background signals accumulated during the long acquisition times make a detailed analysis of the space-dependent dynamics very difficult, it is clear that the topology of the monoclinic domains remains almost unchanged after the excitation. It is however instructive to compare local photo-induced changes of the XLD-PEEM signal along specific lines. In Fig. 9c we report the signal profiles along two selected lines, which perpendicularly cut some of the monoclinic stripe-like domains. The comparison between the profiles at negative and positive delays demonstrates a weak and almost uniform suppression of the contrast between the signal originating from different domains corresponding to monoclinic distortion along different directions. To better analyze the long-time dynamics as a function of the time delay between the infrared pump and the X-ray probe, in Fig. 9d we report the relative variation of the contrast of the signal from different monoclinic domains (red and blue regions), as obtained by integrating over different areas of the PEEM image (see Sec. S1). The average XLD contrast decreases by almost 30% within 50 ps from the excitation and reaches a plateau, corresponding to 10% variation, in the 100 ps-1 ns time span. The PEEM signal fully recovers within 3 ns, which corresponds to the cooling time of the sample [10]. No signature of long-time melting of the monoclinic nanotexture is observed.
Although the contrast between the XLD signal from different monoclinic domains is mainly originated by the directionality of the orbitals, as discussed in Sec. 2 and S4, a weak contribution to the X-ray absorption signal is also given by the orbital occupation of the initial state of the transition. The cluster multiplet calculations reported in Ref. 42 show that the in-plane absorption at 520 eV significantly changes if fully polarized different initial states are considered. In particular, the difference between X-ray absorption at 520 eV and 518 eV, which is used as the reference to cancel backgrounds, decreases by 50% if the orbital occupation changes from to . The observed transient decrease of the XLD-contrast between neighbouring domains is thus compatible with the creation of a metastable metallic state with enhanced occupation and the same in-plane monoclinic distortion of the low-temperature insulating phase. We also note that, although the pump-induced variation of the and occupations is very rapid, the growth of metastable metallic domains takes place on much longer timescales. More specifically, the increase of the occupation in the metastable monoclinic metallic phase implies the restoring of the vanadium dimer length of the corundum structure. This process is much slower since it involves the rearrangement of the vanadium dimers over distances of the order of the typical size of the monoclinic domains (250 nm). This latter structural transformation acts as the bottleneck for the proliferation of the non-thermal phase transformation [32].
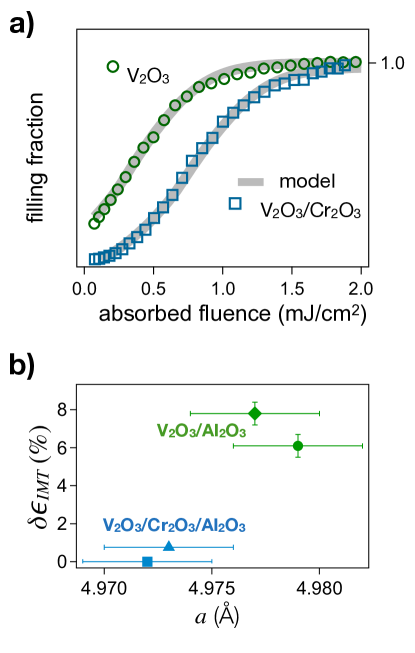
A possible route to control the photo-induced non-thermal metallic phase is given by interface strain engineering [81], which allows to control the residual interface strain in the V2O3 film. Quite naturally, the presence of residual tensile strain in the film may enhance and favour the emergence of monoclinic metallic regions. In Fig. 10a we compare the fluence dependent filling fraction measured on the V2O3 film used for tr-PEEM measurements to that obtained on a similar V2O3 film in which the residual strain is diminished by means of a Cr2O3 buffer layer[41] (see Methods). The fluence dependent data show a remarkably different metallization dynamics, compatible with a decrease of in the film with the Cr2O3 buffer layer. We underline that, in both cases, the morphology of monoclinic domains is very similar, as shown by PEEM images (see Fig. S7). The difference in the values does not impact on the monoclinic nanotexture, which is governed by the functional (6), but rather controls the fragility toward the emergence of the photo-induced non-thermal metallic phase. In Fig. 10b we present more data points showing the correlation between residual tensile strain and the value of .
In this work, we have developed a coarse-grained model, based on the minimization of a Landau-Ginzburg energy functional, to account for the space-dependent lattice and electronic dynamics across the insulator-to-metal transition in the archetypal Mott insulator V2O3. The spontaneous long-range nanotexture, originated by the minimization of the lattice energy, emerges as a key element to describe both the temperature-driven and the photo-induced transition. The reduced-strain regions at the domain boundaries and corners provide the necessary template for the nucleation of metallic domains. In out-of-equilibrium conditions, the domain boundaries stabilize and protect the photo-induced non-thermal monoclinic metallic state, which would be unstable at equilibrium and in homogeneous systems.
Although the reported theory and experiments refer to the Mott transition in V2O3, the present results unveil a profound and general link between the real-space topology, the transition dynamics and the emergence of non-thermal electronic states in quantum materials. The combination of multiscale modeling and microscopy experiments with time-resolution offers new platforms to understand and control the transition dynamics of solids which exhibit spontaneous self-organization at the nanoscale. Indeed, the complexity of space-dependent solid-solid phase transformations involving different degrees of freedom (electrons, lattice, spins, etc.) opens new exciting possibilities for achieving the full control of the transition and for synthesizing novel emerging metastable states that do not exist at equilibrium and in homogeneous phases. The present results suggest possible routes to control metastable metallicity via the topology of the nanotexture. For examples, crystals cut along different direction should exhibit little or no texture at all, which could change the dynamics of the photo-induced phase. On the other hand, the improvement in time-resolution and the use of free-electron-laser based spatially-resolved experiments are expected to provide fundamental information about the early-time dynamics of non-thermal metallization, which is missed in the present experiments. The combination of real-space morphology control via interface engineering, electric fields or pressure, with the development of novel excitation schemes to coherently manipulate insulator to metal phase transitions [82] are expected to open new routes for achieving the full and reversible control of the electronic properties of correlated oxides.
From the theoretical side, our results call for the development of realistic models that capture the long-range dynamics and the complexity of electronic transitions, which are usually tackled starting from a microscopic approach. On the one hand, theory should provide a guide to calculate the X-ray absorption signals of non-thermal phases, which do not exist at equilibrium. This would support the next generation of experiments in addressing the actual electronic and lattice configurations of transient metastable states. On the other hand, microscopic theory could help in linking the lattice parameters ad residual strain to the phenomenological control parameters, e.g. , which enter into the Landau-Ginzburg description. This effort would provide new keys to engineer the intrinsic nanotexture and control non-thermal phases.
In conclusion, the present results justify the ongoing efforts to develop novel table-top and large-scale facility time-resolved microscopy techniques to investigate the intertwining between non-thermal properties and real-space morphology in quantum correlated materials[83]. Addressing the role of real space inhomogeneities and intrinsic strain nanotexture will be crucial to finally clarify the long-standing issue about the possibility of fully decoupling and control the electronic and structural phase transitions in vanadates [22, 3, 20, 84, 52, 23, 54, 53, 26] and other Mott materials.
Methods
0.10 Experimental setup
Time-resolved PEEM measurements have been performed at the I06 beamline at the Diamond Light Source synchrotron. In order to carry out the experiment, the synchrotron was set to the hybrid injection pattern, in which a higher charge single-bunch is separated by the smaller charge multi-bunches by a 150 ns time gap. By gating the detector to avoid the multibunches it is possible to use the gap in the injection pattern to perform pump-probe experiment (see Fig. 1b, main text). The frequency of the X-ray single pulses is 533.8 kHz while the temporal width is 80 , which sets the temporal resolution of the experiment. The X-ray pulses are synchronized to a pump laser source delivering 50 fs pulses at 1.5 photon energy and 26.7 rep. rate. The photoemission signal relative to the X-ray pulses synchronized to the pump laser is acquired by proper electronic gating. The pump-probe delay is controlled by electronically modifying the opto-acoustic mirror of the laser cavity.
0.11 Samples
An epitaxial V2O3 film with thickness =50 nm is deposited by oxygen-assisted molecular beam epitaxy (MBE) in a vacuum chamber with a base pressure of Torr. The (0001)-Al2O3 substrate is used without prior cleaning and is slowly heated to a growth temperature of 700 . Vanadium is evaporated from an electron gun with a deposition rate of 0.1 , and an oxygen partial pressure of Torr is used during the growth [41]. Under these conditions, a single crystalline film with the -axis oriented perpendicular to the surface is obtained. To facilitate the spatial overlap between the optical pump and the X-ray probe we nanopatterned markers constituted by 40 Au/5 Ti thick layers deposited on the sample surface. The residual strain at the Al2O3/V2O3 interface induces an expansion of the in-plane lattice parameter , which changes from 4.954 Å (bulk) to 4.978 Å (film), as determined from X-ray diffraction. The use of a \ceCr2O3 buffer layer (lattice parameter =4.9528 Å) relaxes the tensile strain in the V2O3 film by 0.12% (lattice parameter 4.972 Å in \ceV2O3 for the \ceAl2O3/\ceCr2O3/\ceV2O3 configuration).
Data availability
The data generated in this study are available at http://hdl.handle.net/10807/208360.
References
References
- [1] Mott, N. F. The basis of the electron theory of metals, with special reference to the transition metals. Proceedings of the Physical Society. Section A 62, 416 (1949). URL http://stacks.iop.org/0370-1298/62/i=7/a=303.
- [2] Fish, J., Wagner, G. J. & Keten, S. Mesoscopic and multiscale modelling in materials. Nature Materials 20, 774–786 (2021).
- [3] McLeod, A. S. et al. Nanotextured phase coexistence in the correlated insulator V2O3. Nature Physics 13, 80 (2016).
- [4] McLeod, A. S. et al. Nano-imaging of strain-tuned stripe textures in a Mott crystal. npj Quantum Materials 6, 46 (2021).
- [5] Ronchi, A. et al. Ultrafast orbital manipulation and Mott physics in multi-band correlated materials. Proc. SPIE 17 (2018).
- [6] Giorgianni, F., Sakai, J. & Lupi, S. Overcoming the thermal regime for the electric-field driven Mott transition in vanadium sesquioxide. Nature Communications 10, 1159 (2019). URL https://doi.org/10.1038/s41467-019-09137-6.
- [7] Stoliar, P. et al. Universal Electric-Field-Driven Resistive Transition in Narrow-Gap Mott Insulators. Advanced Materials 25, 3222–3226 (2013).
- [8] Stoliar, P. et al. A Leaky-Integrate-and-Fire Neuron Analog Realized with a Mott Insulator. Advanced Functional Materials 27, 1604740 (2017).
- [9] del Valle, J., Ramirez, J. G., Rozenberg, M. J. & Schuller, I. K. Challenges in materials and devices for resistive-switching-based neuromorphic computing. Journal of Applied Physics 124, 211101 (2018).
- [10] Ronchi, A. et al. Light-Assisted Resistance Collapse in a -Based Mott-Insulator Device. Phys. Rev. Applied 15, 044023 (2021).
- [11] Adda, C. et al. Mott insulators: A large class of materials for Leaky Integrate and Fire (LIF) artificial neuron. Journal of Applied Physics 124, 152124 (2018).
- [12] Adda, C. et al. First demonstration of “Leaky Integrate and Fire” artificial neuron behavior on (V0.95Cr0.05)2O3 thin film. MRS Communications 8, 835–841 (2018).
- [13] Pérez-Tom1’as, A. Functional Oxides for Photoneuromorphic Engineering: Toward a Solar Brain. Advanced Materials Interfaces 6, 1900471 (2019).
- [14] Kim, H., Jo, Y., Kim, S., Kim, D. & Hur, J. 2g hts racetrack coil protection using smart switching feature of v2o3. IEEE Transactions on Applied Superconductivity 29, 1–5 (2019).
- [15] Salev, P., del Valle, J., Kalcheim, Y. & Schuller, I. K. Giant nonvolatile resistive switching in a mott oxide and ferroelectric hybrid. Proceedings of the National Academy of Sciences 116, 8798–8802 (2019).
- [16] del Valle, J. et al. Subthreshold firing in mott nanodevices. Nature 569, 388–392 (2019). URL https://doi.org/10.1038/s41586-019-1159-6.
- [17] Rupp, J. A. J. et al. Different threshold and bipolar resistive switching mechanisms in reactively sputtered amorphous undoped and Cr-doped vanadium oxide thin films. Journal of Applied Physics 123, 044502 (2018).
- [18] Rúa, A. et al. Toward reproducible metal-insulator transition characteristics in V2O3 thin films sputter-deposited on glass. Journal of Applied Physics 124, 205301 (2018).
- [19] Wouters, D. J., Menzel, S., Rupp, J. A. J., Hennen, T. & Waser, R. On the universality of the i–v switching characteristics in non-volatile and volatile resistive switching oxides. Faraday Discuss. 213, 183–196 (2019). URL http://dx.doi.org/10.1039/C8FD00116B.
- [20] Lantz, G. et al. Ultrafast evolution and transient phases of a prototype out-of-equilibrium Mott-Hubbard material. Nature Communications 8, 13917 (2017).
- [21] Kalcheim, Y. et al. Non-thermal resistive switching in Mott insulator nanowires. Nature Communications 11, 2985 (2020).
- [22] Morrison, V. R. et al. A photoinduced metal-like phase of monoclinic VO2 revealed by ultrafast electron diffraction. Science 346, 445–448 (2014).
- [23] Otto, M. R. et al. How optical excitation controls the structure and properties of vanadium dioxide. Proceedings of the National Academy of Sciences 116, 450–455 (2019).
- [24] Abreu, E. et al. Dynamic conductivity scaling in photoexcited V2O3 thin films. Phys. Rev. B 92, 085130 (2015).
- [25] Abreu, E. et al. Ultrafast electron-lattice coupling dynamics in VO2 and V2O3 thin films. Phys. Rev. B 96, 094309 (2017).
- [26] Vidas, L. et al. Does Host a Transient Monoclinic Metallic Phase? Phys. Rev. X 10, 031047 (2020).
- [27] McWhan, D. B., Rice, T. M. & Remeika, J. B. Mott transition in Cr-doped V2O3. Phys. Rev. Lett. 23, 1384 (1969).
- [28] McWhan, D. B. & Remeika, J. P. Metal-insulator transition in (V1-xCrx)2O3. Phys. Rev. B 2, 3734 (1970).
- [29] McWhan, D. B. et al. Electronic specific heat of metallic Ti-doped V2O3. Phys. Rev. Lett. 27, 941 (1971).
- [30] McWhan, D. B., Menth, A., Remeika, J. P., Rice, T. M. & Brinkman, W. F. Metal-insulator transitions in pure and doped V2O3. Phys. Rev. B 7, 1920 (1973).
- [31] Shao, Z. Lattice Distortion of V2O3 thin films during metal-to-insulator transition. Master’s thesis, Cornell University (2019). URL https://hdl.handle.net/1813/67719.
- [32] Ronchi, A. et al. Early-stage dynamics of metallic droplets embedded in the nanotextured Mott insulating phase of . Phys. Rev. B 100, 075111 (2019). URL https://link.aps.org/doi/10.1103/PhysRevB.100.075111.
- [33] Ding, Y. et al. Novel High-Pressure Monoclinic Metallic Phase of . Phys. Rev. Lett. 112, 056401 (2014). URL https://link.aps.org/doi/10.1103/PhysRevLett.112.056401.
- [34] Bai, L. et al. Pressure-induced cation-cation bonding in . Phys. Rev. B 92, 134106 (2015). URL https://link.aps.org/doi/10.1103/PhysRevB.92.134106.
- [35] Chudnovskii, F. et al. Acoustic Emission during Metal-Insulator Phase Transition in V2O3. Journal of Solid State Chemistry 133, 430 – 433 (1997). URL http://www.sciencedirect.com/science/article/pii/S0022459697975034.
- [36] Dernier, P. D. & Marezio, M. Crystal structure of the low-temperature antiferromagnetic phase of V2O3. Phys. Rev. B 2, 3771 (1970).
- [37] Fabrykiewicz, P., Przeniosło, R., Sosnowska, I. & Fauth, F. Positive and negative monoclinic deformation of corundum-type trigonal crystal structures of M2O3 metal oxides. Acta Crystallographica Section B 74, 660–672 (2018). URL https://doi.org/10.1107/S2052520618014968.
- [38] See the Supplementary Material at….
- [39] Poteryaev, A. I. et al. Enhanced crystal field splitting and orbital selective coherence by strong correlations in V2O3. Phys. Rev. B 76, 085127 (2007).
- [40] Scholl, A. et al. Observation of Antiferromagnetic Domains in Epitaxial Thin Films. Science 287, 1014–1016 (2000).
- [41] Dillemans, L. et al. Evidence of the metal-insulator transition in ultrathin unstrained V2O3 thin films. Applied Physics Letters 104, 071902 (2014).
- [42] Park, J.-H. et al. Spin and orbital occupation and phase transitions in V2O3. Phys. Rev. B 61, 11506–11509 (2000).
- [43] Tanaka, A. Electronic Structure and Phase Transition in V2O3: Importance of 3d Spin-Orbit Interaction and Lattice Distortion. Journal of the Physical Society of Japan 71, 1091 (2002).
- [44] Grieger, D. & Fabrizio, M. Low-temperature magnetic ordering and structural distortions in vanadium sesquioxide . Phys. Rev. B 92, 075121 (2015). URL https://link.aps.org/doi/10.1103/PhysRevB.92.075121.
- [45] Fouet, J., Sindzingre, P. & Lhuillier, C. An investigation of the quantum -- model on the honeycomb lattice. The European Physical Journal B - Condensed Matter and Complex Systems 20, 241 (2001).
- [46] Albuquerque, A. et al. Phase diagram of a frustrated quantum antiferromagnet on the honeycomb lattice: Magnetic order versus valence-bond crystal formation. Phys. Rev. B 84, 024406 (2011).
- [47] Mezzacapo, F. & Boninsegni, M. Ground-state phase diagram of the quantum - model on the honeycomb lattice. Phys. Rev. B 85, 060402 (2012).
- [48] Leiner, J. C. et al. Frustrated Magnetism in Mott Insulating . Phys. Rev. X 9, 011035 (2019). URL https://link.aps.org/doi/10.1103/PhysRevX.9.011035.
- [49] Pfalzer, P., Obermeier, G., Klemm, M., Horn, S. & denBoer, M. L. Structural precursor to the metal-insulator transition in . Phys. Rev. B 73, 144106 (2006). URL https://link.aps.org/doi/10.1103/PhysRevB.73.144106.
- [50] Kündel, J. et al. Direct observation of the lattice precursor of the metal-to-insulator transition in V2O3 thin films by surface acoustic waves. Applied Physics Letters 102, 101904 (2013).
- [51] Majid, S. S. et al. Stabilization of metallic phase in V2O3 thin film. Applied Physics Letters 110, 173101 (2017).
- [52] Singer, A. et al. Nonequilibrium Phase Precursors during a Photoexcited Insulator-to-Metal Transition in V2O3. Phys. Rev. Lett. 120, 207601 (2018).
- [53] Frandsen, B. A. et al. Intertwined magnetic, structural, and electronic transitions in . Phys. Rev. B 100, 235136 (2019).
- [54] Kalcheim, Y. et al. Robust Coupling between Structural and Electronic Transitions in a Mott Material. Phys. Rev. Lett. 122, 057601 (2019).
- [55] Lo Vecchio, I. et al. Fermi surface of metallic from angle-resolved photoemission: Mid-level filling of bands. Phys. Rev. Lett. 117, 166401 (2016). URL https://link.aps.org/doi/10.1103/PhysRevLett.117.166401.
- [56] Robinson, W. R. High-temperature crystal chemistry of V2O3 and 1% chromium-doped V2O3. Acta Crystallographica Section B 31, 1153–1160 (1975). URL https://doi.org/10.1107/S0567740875004700.
- [57] Chen, S., Hahn, J. E., Rice, C. E. & Robinson, W. R. The effects of titanium or chromium doping on the crystal structure of v2o3. Journal of Solid State Chemistry 44, 192–200 (1982). URL https://www.sciencedirect.com/science/article/pii/0022459682903656.
- [58] Grieger, D. & Lechermann, F. Effect of chromium doping on the correlated electronic structure of . Phys. Rev. B 90, 115115 (2014).
- [59] Rodolakis, F. et al. Inequivalent Routes across the Mott Transition in V2O3 Explored by X-Ray Absorption. Phys. Rev. Lett. 104, 047401 (2010).
- [60] Hansmann, P. et al. Mott–Hubbard transition in V2O3 revisited. Phys. Status Solidi B 250, 1251–1264 (2013). URL https://onlinelibrary.wiley.com/doi/full/10.1002/pssb.201248476#.
- [61] Lupi, S. et al. A microscopic view on the Mott transition in chromium-doped V2O3. Nature Communications 1, 105 (2010).
- [62] Paquet, D. & Leroux-Hugon, P. Electron correlations and electron-lattice interactions in the metal-insulator, ferroelastic transition in v: A thermodynamical study. Phys. Rev. B 22, 5284–5301 (1980). URL https://link.aps.org/doi/10.1103/PhysRevB.22.5284.
- [63] Han, Q. & Millis, A. Lattice energetics and correlation-driven metal-insulator transitions: The case of . Phys. Rev. Lett. 121, 067601 (2018). URL https://link.aps.org/doi/10.1103/PhysRevLett.121.067601.
- [64] Grandi, F., Amaricci, A. & Fabrizio, M. Unraveling the mott-peierls intrigue in vanadium dioxide. Phys. Rev. Research 2, 013298 (2020). URL https://link.aps.org/doi/10.1103/PhysRevResearch.2.013298.
- [65] Rasmussen, K. O. et al. Three-Dimensional Elastic Compatibility and Varieties of Twins in Martensites. Phys. Rev. Lett. 87, 055704 (2001). URL https://link.aps.org/doi/10.1103/PhysRevLett.87.055704.
- [66] Shenoy, S. R., Lookman, T., Saxena, A. & Bishop, A. R. Martensitic textures: Multiscale consequences of elastic compatibility. Phys. Rev. B 60, R12537–R12541 (1999). URL https://link.aps.org/doi/10.1103/PhysRevB.60.R12537.
- [67] Vasseur, R., Lookman, T. & Shenoy, S. R. Microstructure from ferroelastic transitions using strain pseudospin clock models in two and three dimensions: A local mean-field analysis. Phys. Rev. B 82, 094118 (2010). URL https://link.aps.org/doi/10.1103/PhysRevB.82.094118.
- [68] Nichols, D. N., Sladek, R. J. & Harrison, H. R. Elastic constants of between 300 and 640 K: Anomalies near the high-temperature electrical transition. Phys. Rev. B 24, 3025–3030 (1981). URL https://link.aps.org/doi/10.1103/PhysRevB.24.3025.
- [69] Yang, H., Sladek, R. & Harrison, H. Shear elastic constant softening in V1−xCrx)2O3: Second-order nature of the low temperature phase transition. Solid State Communications 47, 955 – 957 (1983). URL http://www.sciencedirect.com/science/article/pii/0038109883909778.
- [70] Yang, H. & Sladek, R. J. Elastic anomalies in (: Electron-transfer effects. Phys. Rev. B 34, 2627–2631 (1986). URL https://link.aps.org/doi/10.1103/PhysRevB.34.2627.
- [71] Boccara, N. Second-order phase transitions characterized by a deformation of the unit cell. Annals of Physics 47, 40 – 64 (1968). URL http://www.sciencedirect.com/science/article/pii/000349166890225X.
- [72] Yethiraj, M., Werner, S. A., Yelon, W. B. & Honig, J. M. Phonon anomalies and the magnetic transition in pure and Cr-doped . Phys. Rev. B 36, 8675–8686 (1987). URL https://link.aps.org/doi/10.1103/PhysRevB.36.8675.
- [73] Jayaraman, A., McWhan, D. B., Remeika, J. P. & Dernier, P. D. Critical behavior of the mott transition in cr-doped . Phys. Rev. B 2, 3751–3756 (1970). URL https://link.aps.org/doi/10.1103/PhysRevB.2.3751.
- [74] Castellani, C., Castro, C. D., Feinberg, D. & Ranninger, J. New model hamiltonian for the metal-insulator transition. Phys. Rev. Lett. 43, 1957–1960 (1979). URL https://link.aps.org/doi/10.1103/PhysRevLett.43.1957.
- [75] Limelette, P. et al. Universality and Critical Behavior at the Mott Transition. Science 302, 89–92 (2003).
- [76] Shenoy, S. R. & Lookman, T. Strain pseudospins with power-law interactions: Glassy textures of a cooled coupled-map lattice. Phys. Rev. B 78, 144103 (2008). URL https://link.aps.org/doi/10.1103/PhysRevB.78.144103.
- [77] Qazilbash, M. M. et al. Electrodynamics of the vanadium oxides and . Phys. Rev. B 77, 115121 (2008).
- [78] Gota, S., Gautier-Soyer, M. & Sacchi, M. Fe absorption in magnetic oxides: Quantifying angular-dependent saturation effects. Phys. Rev. B 62, 4187–4190 (2000).
- [79] Regan, T. J. et al. Chemical effects at metal/oxide interfaces studied by x-ray-absorption spectroscopy. Phys. Rev. B 64, 214422 (2001).
- [80] Liu, M. K. et al. Photoinduced Phase Transitions by Time-Resolved Far-Infrared Spectroscopy in V2O3. Phys. Rev. Lett. 107, 066403 (2011).
- [81] Homm, P., Menghini, M., Seo, J. W., Peters, S. & Locquet, J. P. Room temperature Mott metal-insulator transition in V2O3 compounds induced via strain-engineering. APL Materials 9, 021116 (2021).
- [82] Horstmann, J. G. et al. Coherent control of a surface structural phase transition. Nature 583, 232–236 (2020).
- [83] A.S. Johnson et al. Ultrafast x-ray hyperspectral imaging of a photo-induced phase transition with nanometer space and femtosecond time resolution. arxiv.org/abs/2202.08585 (2022).
- [84] Nájera, O., Civelli, M., Dobrosavljević, V. & Rozenberg, M. J. Resolving the controversy: Mott mechanism dominates the insulator-to-metal transition. Phys. Rev. B 95, 035113 (2017).
Acknowledgments
C.G., A.R. and P.F. acknowledge financial support from MIUR through the PRIN 2015 (Prot. 2015C5SEJJ001) and PRIN 2017 (Prot. 20172H2SC4_005) programs. C.G. and G.F. acknowledge support from Università Cattolica del Sacro Cuore through D.1, D.2.2, and D.3.1 grants. We acknowledge Diamond Light Source for the provision of beamtime under proposals number SI18897 and MM21700. JPL acknowledges financial supported by the KU Leuven Research Funds, Project No. KAC24/18/056, No. C14/17/080 and iBOF/21/084 as well as the Research Funds of the INTERREG-E-TEST Project (EMR113) and INTERREG-VL-NL-ETPATHFINDER Project (0559). M.M. acknowledges support from "Severo Ochoa" Programme for Centres of Excellence in R&D (MINCINN, Grant SEV-2016-0686). M.F. has received funding from the European Research Council (ERC) under the European Union’s Horizon 2020 research and innovation programme, Grant agreement No. 692670 "FIRSTORM".
Author Contributions Statement
A.R., P.F., P.H., A.F., F.M., S.S.D., M.M., J.-P.L. and C.G. conceived the project and carried out the time-resolved experiments at Diamond Light Source (UK). C.G. coordinated the research activities with input from all the coauthors, particularly A.R., P.F., F.M., M.M., J.-P.L. and M.F. A.R., P.F., M.M, J.-P.L. and C.G. analyzed the data. A.R., P.F., G.F. F.B. and C.G. developed the time-resolved setup for time-resolved reflectivity experiments. All the authors participated to the discussion of the results and contributed to the revision of the manuscript. M.F. developed the theoretical framework with main inputs from A.DP. and C.G. A.DP. performed numerical calculations based on Landau-Ginzburg functionals. A.R., M.F. and C.G. drafted the first version of the manuscript.
Competing Interests Statement
The authors declare no competing interests.