Emergence of two-level systems in glass formers: a kinetic Monte Carlo study
Abstract
Using a distinguishable-particle lattice model based on void-induced dynamics, we successfully reproduce the well-known linear relation between heat capacity and temperature at very low temperatures. The heat capacity is dominated by two-level systems formed due to the strong localization of voids to two neighboring sites, and can be exactly calculated in the limit of ultrastable glasses. Similar but weaker localization at higher temperatures accounts for the glass transition. The result supports the conventional two-level tunneling picture by revealing how two-level systems emerge from random particle interactions, which also cause the glass transition. Our approach provides a unified framework for relating microscopic dynamics of glasses at room and cryogenic temperatures.
I Introduction
Most liquids can be quenched into the glassy state by undergoing a glass transition, a phenomenon actively studied for decades Stillinger and Debenedetti (2013); Arceri et al. (2020). When further cooled below 1K, it was found by Zeller and Pohl that the heat capacity of glasses is proportional to the temperature , well exceeding Debye’s relation based on acoustic phonons Zeller and Pohl (1971). Anderson et al Anderson et al. (1972) and Phillips Phillips (1972) simultaneously proposed that the heat capacity is dominated at low by two-level systems (TLS). Their theory has successfully explained a plethora of low- thermal and acoustic properties of glasses Phillips (1987). Nevertheless, the microscopic nature of TLS and their possible universal properties remain controversial Leggett and Vural (2013); Queen et al. (2013); Pérez-Castañeda et al. (2014); Ramos (2020); Carruzzo and Clare (2020). Recently, TLS in glasses have attracted additional interest due to their strong relevance to noise in quantum computing devices Müller et al. (2019).
Numerous glasses Ramos (2020) exhibit the characteristic heat capacity found in Ref. [Zeller and Pohl, 1971]. Therefore, TLS is likely an intrinsic component in glasses and should be relevant to the glass transition and glassy dynamics in general. Yet, TLS at present plays little role in major theories of glass transition Stillinger and Debenedetti (2013); Arceri et al. (2020). Concerning particle simulations, both molecular dynamics (MD) simulations Kob and Andersen (1995) and lattice models Garrahan et al. can reproduce many features of glasses. Identification of TLS in MD systems has been reported Damart and Rodney (2018); Khomenko et al. (2020). However, according to Refs. Anderson et al. (1972); Phillips (1972), the characteristic low- heat capacity depends not only on the existence of TLS, but also that they must be sufficiently isolated from each other. The latter condition has not been fully explored in any particle simulation and, more importantly, the hallmark low- heat capacity has not been explicitly reproduced. As MD simulations become computationally challenging at low due to the slow dynamics, accessing the heat capacity directly can be difficult. Neither has this been achieved in conventional lattice models, despite their better computational efficiencies Garrahan et al. . On the other hand, heat capacity linear in has also been shown to be explainable with diffusive vibrational modes Baggioli and Zaccone (2019) and observed in a random network model Baggioli et al. (2019) that apparently exhibits no TLS.
In this work, we successfully reproduce the characteristic low- heat capacity of glasses using a recently proposed distinguishable particle lattice model (DPLM), which has already been shown to exhibit typical glass transition Zhang and Lam (2017). The heat capacity is shown to be dominated by TLS, which naturally emerge from increasingly strong particle localization as decreases. We demonstrate that the same localization effects are responsible for the glass transition at higher .
At , the heat capacity of many glasses follows Zeller and Pohl (1971); Ramos (2020). The linear term dominates at and is explained by the TLS theory Anderson et al. (1972); Phillips (1972). The Debye contribution can be independently determined from acoustic properties. Results in general support the existence of an extra term, which can be approximately accounted for using soft-potential models Karpov et al. (1983); Buchenau et al. (1991). Being a lattice model, the DPLM does not accommodate vibrations, leading to . We will show below that under a wide range of conditions, the specific heat capacity of the DPLM at low follows
| (1) |
consistent with experiments.
The DPLM has been shown to exhibits typical glassy behaviors such as a pronounced plateau in the mean-squared displacement of particles Zhang and Lam (2017); Deng et al. (2019) and stretched exponential relaxation in the self-intermediate scattering function Zhang and Lam (2017). It has recently afforded an explanation of the decades-old Kovac’s expansion gap paradox Lulli et al. (2020), reproduced Kovacs memory effect Lulli et al. (2021), suggested simple connections among glass fragility, entropy and particle pair-interactions Lee et al. (2020) and demonstrated heat-capacity overshoot Lee et al. (2021) . The present demonstration of characteristic low- thermal properties in the same model thus establishes a unique framework to relate the TLS theory to the rich dynamical behaviors of glasses at higher .
II Model
We adopt basically the DPLM defined in Ref. [Lee et al., 2020]. It is a two-dimensional lattice model with distinguishable particles. Each particle has its own type, and can move on a square lattice of size . A vacant lattice point is deemed occupied by a void so that the void density is . The system has a total energy
| (2) |
where the sum is only applied to occupied adjacent sites and . There are thus only nearest neighboring interactions between particles in the model. The index denotes which particle is at sites . Each interaction between particle and is sampled randomly from a distribution . The dynamics is furnished by the Metropolis rule satisfying detailed balance: each particle can hop to an empty adjacent site (i.e. a void) at a rate
| (3) |
where , , and is the change of the system energy due to the hop. Notice that the particle indices and are implicitly time dependent, since particles move around.
III Specific heat measurement
In our main simulations, we consider for simplicity an interaction distribution uniform over , where . We put , corresponding to purely repulsive interactions which suppress void aggregation even at low . A general form of should give qualitatively similar results. As will be discussed below, a uniform does not gives rise to, and should not be confused with, a flat TLS energy distribution. The latter is a commonly used simplification but is again non-essential for arriving at the experimental low- heat capacity Anderson et al. (1972); Phillips (1972).
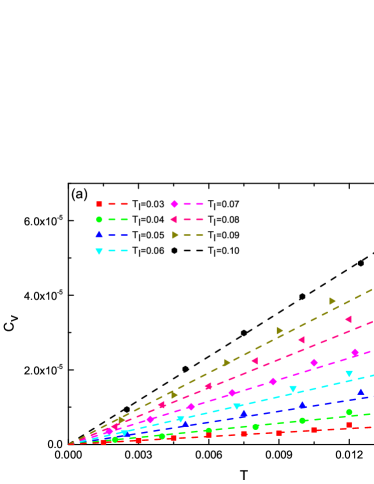
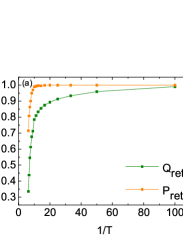
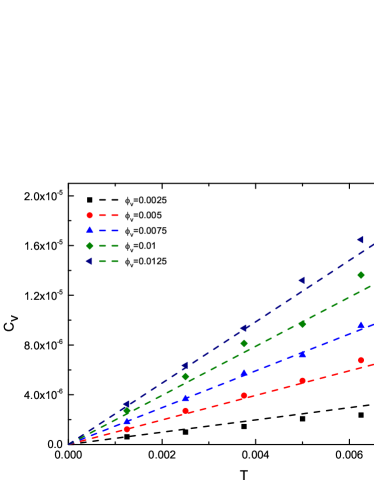
We initialize equilibrium systems on a lattice with a void density at temperature via direct construction Zhang and Lam (2017). Kinetic Monte Carlo simulations are then performed with decreasing from towards at a cooling rate . We continuously measure the system energy defined in Eq. (2) so as to calculate . The glass transition temperature in our system is found to be , which has been defined as the temperature at which the particle diffusion coefficient falls to a small reference value Lee et al. (2020). We first consider low initial equilibrium temperatures , leading to ultrastable glasses Swallen et al. (2007); Zhao et al. (2013) with a low fictive temperature close to . Simulation results on are plotted in Fig. 1(a). We observe that the DPLM successfully reproduce the linear relation between and , i.e. Eq. (1) in the low limit. Moreover, we find that , which equals the slope, decreases with . The reduction of shows a depletion of TLS, fully consistent with suggestions based on experiments Queen et al. (2013); Pérez-Castañeda et al. (2014).
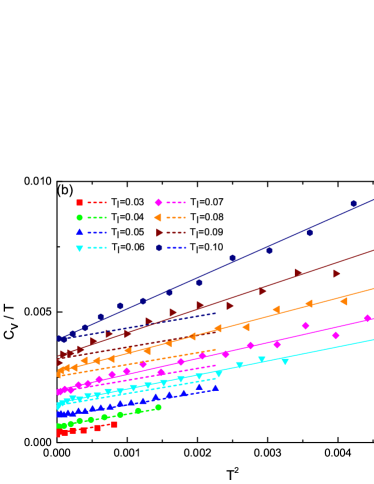
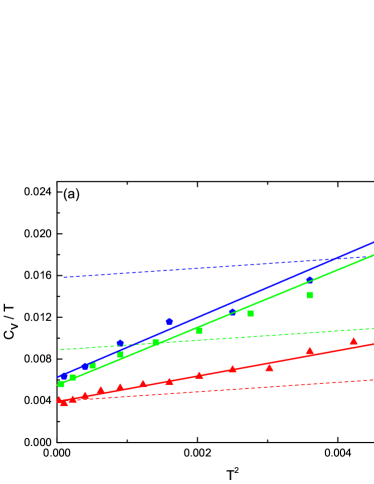
After confirming the term, we now examine the full expression in Eq. (1). Figure 1(b) plots against . The reasonable linear relations observed in all cases verify Eq. (1) with . Similar to experimental results Zeller and Pohl (1971), the absence of any second order term, i.e. , is evident. Nevertheless, the presence of the term is, at first sight, surprising, since similar nonlinear terms such as a term has been suggested to be accounted for by the soft-potential model concerning anharmonic vibrations Karpov et al. (1983); Buchenau et al. (1991). It is somewhat not expected for a lattice model. This will be discussed later.

IV Particle dynamics
A close examination of the particle dynamics shows that stronger particle localization at low accounts for both the glass transition and the emergence of TLS. In the DPLM, particle movements are induced by voids, a mechanism supported by recent colloidal experiments Yip et al. (2020). Since a particle hop can be equivalently considered as the opposite hop of a void, we describe the dynamics of particles and voids interchangeably. Figure 2 shows spatial profiles of the void occupation probability at site on a lattice at different stages of cooling. To enable a meaningful comparison, in each case is measured over a period of time during which particle hops have occurred.
For corresponding to the non-glassy liquid phase, we observe that voids diffuse quite freely. Thermal excitations dominate over random particle interactions. When cooled to , is much more heterogeneous, with highly preferential sites of locating voids. Such void localization is caused by the random particle interactions. It leads to significant dynamic slowdown and thus the glass transition as characterized in Refs. Zhang and Lam (2017); Lee et al. (2020) and will be further quantified below. As the system is further cooled to , most voids are persistently trapped to within a few sites. Some of them are even completely frozen. The system can no longer fully relax within practical simulation time, implying the glass phase. At , the strong localization completely freezes most voids. More importantly, a small number of voids are trapped between only two sites, forming TLS.
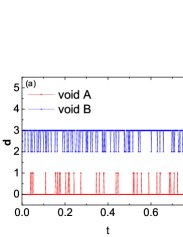
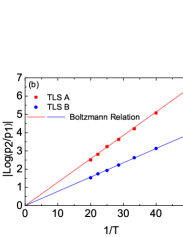
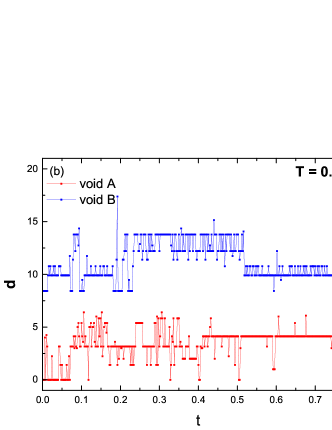
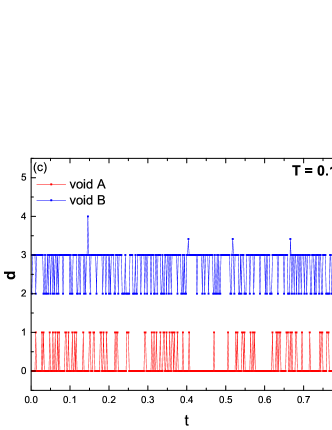
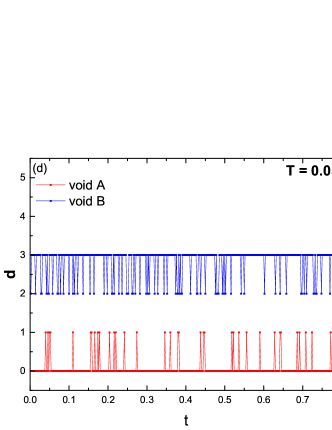
The TLS in our system exemplified in Fig. 2 are isolated and noninteracting, due to the strong localization and the small void density used. We emphasize that noninteracting or weakly interacting TLS are essential to account for the experimental Anderson et al. (1972); Phillips (1972). At , further system relaxation is limited to TLS transitions, while TLS movements, restructuring and other relaxations are all negligible. Figure 3(a) shows displacement-time graphs of the voids constituting the two TLS in Fig. 2. The bistability is evident, with each level corresponding to the void at one of the two energetically possible sites. The occupation probabilities and of the initial and the hopped levels are asymmetrical in general and depend on the energy difference . Figure 3(b) plots against . The nice linearity obtained verifies the equilibrium relation . Hence, TLS form equilibrium subsystems, in sharp contrast to the whole system which is out of equilibrium.
To further quantify in a unified manner how localization induces both the glass transition and TLS, we study the hopping return probabilities and of particles and voids respectively. After a particle has hopped, the return probability is defined as the probability that the next hop by the particle reverse its previous hop and return it to the original position Lam (2017); Zhang and Lam (2017); Lee et al. (2020); Yip et al. (2020). Here, we define analogously for voids. Figure 4 plots and against during cooling. Results are measured from snapshots of system configurations. They provide lower bounds of the probabilities, since some rapid back-and-forth motions in between consecutive snapshots may not be registered Lam (2017). At high , both and are relatively small as dynamics are closer to random walks. During cooling, they decrease monotonically and smoothly. At , we get . This implies a strong back-and-forth nature of the particle hops Vollmayr-Lee (2004); Lam (2017), which is a main contributor to the dramatically slowed down dynamics at the glass transition Lee et al. (2020). At , . Since nearly all hopping motions are reversed, particle dynamics are basically arrested, evidencing that the glass transition has already occurred and the system is deeply in the glass phase. At , , showing that nearly all dynamics are TLS transitions. Note that although particle hops are induced by voids, at all . This can be understood by noting, for example, that two consecutive non-returning hops by a single void involve single-hops by two different particles, resulting at distinct statistics for particles and voids.
V Emergence of two-level systems
A unique feature of the DPLM is its exact equilibrium properties Zhang and Lam (2017) which have been extensively verified numerically Zhang and Lam (2017); Lulli et al. (2020); Lee et al. (2020). This allows us to analytically deduce the emergence of TLS as follows. Let be the system energy change due to a hop attempt of a particle into a nearest neighboring void. The probability distribution can be computed for equilibrium systems Lam (2018), but in general depends non-trivially on the thermal history for non-equilibrium systems. The probability that a hop is energetically possible can be approximated by
| (4) |
where is the maximum energy cost for a hop attempt to be considered energetically possible. During cooling, temperature is close to for a duration which, as an order of magnitude estimation, is given by . For at least one hop to occur during , the hopping rate must satisfy , which gives
| (5) |
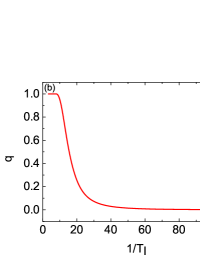
after using Eq. (3). For systems equilibrium at , is calculated using Eqs. (4)-(5) and exact expressions of from Ref. [Lam, 2018] and results are plotted in Fig. 4(b).
At small , we observe that converges towards 0, e.g. at . Voids then have vanishingly few energetically possible hopping pathways. Most voids are thus frozen. Some voids possess one energetically possible hop with a probability , where is the lattice coordination number. Each then forms a TLS leading to a TLS density . If a void is allowed multiple possible hops, a multi-level system with three or more levels results. This however occurs at a probability of order or smaller and are negligibly few compared with TLS.
The above analysis is directly applicable to corresponding to ultrastable glasses. Most glasses are however less stable with a fictive temperature around . The above picture is still qualitatively applicable because once cooled to , most dynamics are frozen, as can be observed from Fig. 2. Hence, should similarly approach 0. Nevertheless, due to local relaxations predominantly in the vicinity of voids, the system is overall non-equilibrium so that , and cannot be calculated analytically.
We begin our derivation of Eq. (1) by assuming . As explained above, most voids are completely frozen and have null contribution to . Voids forming multi-level systems are on the other hand few and can be neglected. Therefore, we only need to consider the TLS which dominate . Since TLS are at equilibrium as shown in Fig. 3(b), straightforward algebra gives
| (6) |
where
| (7) |
is the heat capacity of a TLS Phillips (1972). Note that is an even function peaked sharply at . This physically represents that TLS with large energy splits contribute little to . The upper integration limit can thus be approximated as infinity, giving
| (8) |
Here, is the TLS energy split with a distribution
| (9) |
This expression highlights the equivalent contributions to by hops with positive and neglect energy changes. Conventionally, is assumed a constant for simplicity Anderson et al. (1972); Phillips (1972). Instead, we expand about , keeping only the first two non-zero terms. After some algebra, Eq. (8) reduces to Eq. (1) with
| (10) |
All even terms, e.g. , vanish exactly since is even.
For ultrastable glasses with , we can calculate and using exact expressions of Lam (2018). In particular, for the uniform interaction distribution used in our main simulations and , we get
| (11) |
which is exact for . Figure 1 plots from Eqs. (1) and (11). We observed an excellent agreement with simulations for and at and 0.05 respectively. For less stable glasses with higher , discrepancies from Eq. (11) occur. This is because local relaxation results in deviation from the exact form of at used in our calculations. Nevertheless, Eq. (1) remains valid. See appendix A for more detailed calculations.
VI Comparison with glycerol
The DPLM is a microscopic model allowing quantitative comparisons with real materials Lee et al. (2020).
Up to now, we have been using dimensionless units. A quantitative comparison with real materials requires using physical units, which will be adopted in this section. First, we follow Ref. [Lee et al., 2020] to match the kinetic fragility of a specific material. To generate glasses of various fragilities, an energetic parameter is introduced in the interaction energy distribution by generalized it to a uniform-plus-delta functional form
| (12) |
where denotes Dirac’s delta function. To suppress void aggregation, we take in this work corresponding to fully repulsive interactions. When , Eq. (12) reduces to the uniform adopted in our main simulations. For small but finite , we get fragile glasses Lee et al. (2020).
At small , the physical significance of in Eq. (12) is that it includes a high-entropy high-energy (delta) component and a low-entropy low-energy (uniform) component. It was shown that replacing the delta function by a narrow Gaussian function gives similar results Lee et al. (2020). To eliminate non-analyticities which adversely impact our calculations, we further generalize Eq. (12) to a Fermi-plus-Gaussian form:
| (13) |
where
| (14) | |||||
| (15) |
for . Here, denotes the width of both the Gaussian and the drop in the Fermi function. When , Eq. (12) is recovered.
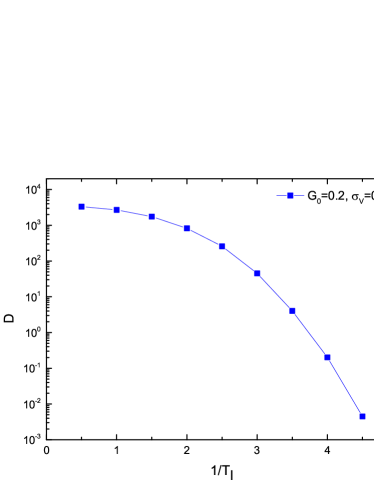
We have performed DPLM simulations using in Eq. (13) with and a cooling rate . Fig. 5 shows the measured diffusion coefficient against . The kinetic fragility measured based on a reference diffusion coefficient is . Extrapolating to following Ref. [Lee et al., 2020], we get which is comparable to the value 53 for glycerol Angell (1997). As explained in Ref. [Lee et al., 2020], the bi-component we adopt is closely related to the bond excitation model of Moynihan and Angell Moynihan and Angell (2000). The bond excitation model uses two parameters to describe thermodynamic properties of different materials: the entropy difference and the enthalpy difference between an unexcited and an excited state. They correspond to the Fermi (uniform) and Gaussian (delta) part of the bi-component , respectively. We can calculate and of the two components in DPLM following Ref. [Lee et al., 2020]. For , one can find that and . This is in agreement with a fit to the experimental thermodynamic data of glycerol using the bond excitation model, which gives and Moynihan and Angell (2000).
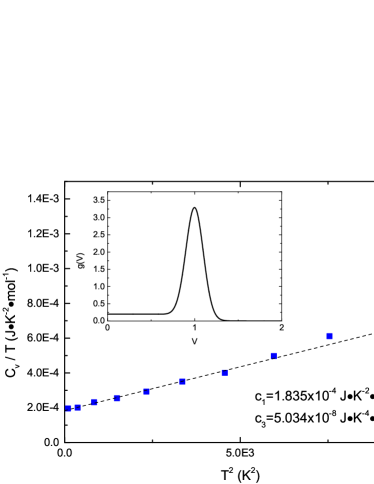
The two parameters and have weaker impacts on the fragility. In general, increases with while the dependence on is non-monotonic. We take , resulting at the distribution shown in the inset of Fig. 6. We then find that taking provides a reasonable value of . In dimensionless unit with , we get and . To convert to physical units, we note that for glycerol Angell (1997) and J/(Kmol). This gives J/K2 mol. It matches the experimental value of J/K2 mol Stephens (1973). However, we get from simulations J/K4 mol, which is a few orders smaller than J/K4 mol from experiments Stephens (1973). Therefore, using realistic model parameters, our model provides a possible explanation of , while has to be approximately accounted for using other mechanisms such as lattice vibrations considered by the soft-potential model Karpov et al. (1983); Buchenau et al. (1991).
VII Discussions
VII.1 Comparison with standard TLS picture
Anderson et al Anderson et al. (1972) and Phillips Phillips (1972) proposed the standard TLS model which explains the characteristic low- heat capacity, heat conductivity, phonon echoes properties of glasses Phillips (1987). While some properties such as heat capacity can be captured by semi-classical calculations Anderson et al. (1972), other properties must be accounted for by a fully quantum mechanical picture. Our lattice model focuses on the formation and the heat capacity of the TLS, which can well be described semi-classically. Quantum properties, similar to molecular vibrations, cannot be studied with classical lattice model and are beyond the scope of this work. Despite these limitations, we will show that the TLSs that naturally emerge from the DPLM at low are fully consistent with and hence support the standard TLS picture, despite some technical differences to be explained below.
The standard TLS model is also widely referred to as the tunneling two-level (TTL) model. TTL model decribes the two-level system with the following Hamiltonian:
| (16) |
where are energy of two quasi-stable configurations, are separately inter-well hopping frequency and intra-well oscillation frequency on site 1 and two. and are used to denote the energy barrier height and width. In their original paper Anderson et al. (1972), Anderson et al already pointed out that the relevant TLS should have large energy barrier so that resonant tunneling does not occur (V is large enough that off-diagonal elements are negligible), but transitions can occur by processes such as phonon-assisted tunneling. These transitions are thus incoherent processes consistent with a semi-classical description. The DPLM is basically a classical model. Particle hops at low should thus be interpreted in the semi-classical sense. The hopping rate in Eq. (3) is then taken as a rough approximation for phonon-assisted tunneling processes. More accurate forms of particle hopping rates however should not alter our results qualitatively.
Our expression of from Eq. (1) with from Eq. (10) is equivalent to that in Ref. [Anderson et al., 1972], after neglecting and identifying with, in our notation, the density of TLS per particle per unit energy in Ref. [Anderson et al., 1972] at , i.e.
| (17) |
Moreover, the standard model assumes random particle hopping barriers uncorrelated to the TLS energy split Anderson et al. (1972). Particles happen to have surmountable barriers constitute the TLS. In the DPLM, whether a particle can hop is also random, but the randomness primarily comes from whether it is a neighbor of a void. If a particle is next to a void so that a hop is allowed, the barrier then depends solely on the energy difference according to simple Metropolis rule in Eq. (3) without further randomness. Nevertheless, the DPLM can be generalized to have additional randomness in the barriers, which should not alter our results qualitatively.
VII.2 Real space structure of TLS
Despite decades of study, what constitutes the TLS is still controversial Müller et al. (2019). The movement of rigid molecular groups suggested in the original paper of Anderson et al Anderson et al. (1972) is still the leading contender. Our picture basically follows this view. A particle in the DPLM represents an atom or a rigid molecular group, while a void represents a quasivoid consisting of coupled free-volume fragments of a combined size comparable to that of a particle Yip et al. (2020). Moreover, a TLS transition is identified with a microstring particle hopping motion, in which a short chain of particles displace one another synchronously Aichele et al. (2003). They have been suggested as elementary motions in glasses Keys et al. (2011); Lam (2017), a notion supported by colloidal experiments at high density Yip et al. (2020). At present, the DPLM only directly simulates microstrings of unit length. Noting their strong back-and-forth nature as quantified by a high particle return probability , we have suggested that reversed microstrings are responsible for relaxations while only the non-reversed ones, which become increasingly few as decreases, lead to structural relaxations Lam (2017). In this work, we further establish that as the void return probability approaches 1 at very low , these microstrings constitute TLS transitions as well. These provide a simple unified view for these seemingly diverse processes of glasses.
VIII Conclusion
To conclude, we have shown that the specific heat of the DPLM follows at very low in agreement with experiments. By closely monitoring the motions of particles and voids, we observe formation of TLS as random particle interactions induce strong localization of voids to within two lattice sites. System relaxation is then limited to TLS transitions. For ultrastable glasses with a very low fictive temperature, the TLS density and thermal properties can be analytically calculated. For less stable glasses with fictive temperature close to the glass transition temperature, TLS emerge similarly at low after local relaxation subsides.
Acknowledgements.
We thank the support of National Natural Science Foundation of China (Grants 11974297 and 11774022).Appendix A Details of analytic calculation of specific heat capacity of TLS
We now provide further details on the calculation of the specific heat capacity in the DPLM. Consider a TLS with its initial state labeled 1 and the other state labeled 2. Denote the system energy at these two states by and so that . The relaxation rate of the TLS equals the sum of the forward and backward transition rates of the TLS, i.e. , implying . In our simulations, we adopt particle hopping rates in the Metropolis form, i.e.
| (18) |
We thus get
| (19) |
All TLS in the DPLM thus relax fast and this explains their equilibrium nature even at very low as numerically demonstrated in Fig. 3(b).
Since TLS are at equilibrium, its average energy can be calculated using the Boltzmann distribution and we get
| (20) |
The heat capacity of a TLS is then given by
| (21) |
Consider in which voids admit few energetically possible hopping pathways due to the strong localization. Assume also a small void density so that voids are isolated. The initial equilibrium position of a void is associated with state 1 of a possible TLS. There is a probability that the void can hop to a given nearest neighboring occupied site with an energy cost smaller than , realizing a TLS transition to state 2. Taking into account all possible TLS, the specific heat capacity , defined as heat capacity per particle, is
| (22) |
where is the lattice coordination number and is the probability distribution of . The void density has been assumed a constant independent of , as is assumed in our simulations for simplicity.
Only TLS with an energy split within a few can contribute significantly to the heat capacity. This is reflected in the function , which is sharply peaked at . The upper integration limit in Eq. (22) can thus be approximated by infinity. Noting also that is an even function of , Eq. (22) gives
| (23) |
where the TLS energy split has a distribution
| (24) |
The distribution is a smooth function provided the interaction distribution is sufficiently smooth, which should hold true in realistic systems. We expand about and write
| (25) |
Then, Eq. (24) becomes
| (26) |
All odd-power terms vanish exactly as is an even function of . Substituting Eq. (26) into Eq. (23) and neglecting higher order terms, we get
| (27) |
where
| (28) |
We have defined
| (29) |
so that and . These give
| (30) |
An interesting observation is that all even terms, e.g. , vanish exactly, which follows directly from the vanishing of all odd terms in from Eq. (26).
We now further assume an ultrastable system equilibrated at an initial temperature . Exact equilibrium properties of the DPLM Zhang and Lam (2017) then allow an exact evaluation of . At equilibrium temperature , the interaction between particles occupying sites and follows a distribution , which is simply the Boltzmann distribution Zhang and Lam (2017); Lulli et al. (2020)
| (31) |
Starting from the initial state 1 of the TLS, a given hop attempt to attain state 2 involves an energy change of the system given by Lam (2018)
| (32) |
where denotes initial interactions to be broken and denotes new interactions to be formed. Here, follows the a posteriori distribution because they are realized in the initial equilibrium configuration. In contrast follows the a priori distribution because without stipulating that the hop attempt must be successful, any new interactions are equally likely.
Note that in Eq. (23) depends on the coordination number not only explicitly but also implicitly via . Moreover, in turn depends on the lattice type and more generally on the system dimension. We now take for the square lattice adopted in this work. Eq. (32) states that is a sum of six random variables and its distribution thus follows the convolution form
| (33) |
where , which is non-zero for . In general, can be evaluated numerically using Eq. (33) for any . Fig. 8 shows the numerical result of . Note that is not a flat distribution as often assumed for simplicity Phillips (1987), despite a uniform interaction distribution being used. According to Eq. (30), the low- heat capacity depends only on and and other details of is irrelevant. For comparison, the inset in Fig. 8 shows for a different for . We observe a qualitatively similar , which will also lead to qualitatively similar heat capacity properties predictable using Eq. (30).


In particular, consider the interaction distribution uniform in adopted in our main simulations. Analytic calculation is possible. Performing simple algebra in the Laplace tranformed space, Eq. (33) becomes
| (34) |
where denotes the Laplace transform. The relevant derivatives at are found to be, after some algebra,
| (35) |
Substituting into Eq. (30), we get
| (36) |
Note that and from Eq. (36) are exact in the limit corresponding to ultrastable glasses, in which the only relaxation modes are TLS relaxations. They are accurately verified by DPLM simulations under these conditions as shown in Fig. 1.
Generalization to other lattice coordination number is straight-forward. For example, for appropriate for a triangular lattice in 2D or a cubic lattice in 3D, we get
| (37) |
and hence
| (38) |
For more general forms of , the Laplace transform may become intractable analytically but and can be readily solved accurately by performing the convolution numerically.
Appendix B Supplemental simulation results
Our main simulations have been performed using a void density . We have also performed simulations using a wider range of and results on are plotted in Fig. 7. Good agreement with Eqs. (27) and (36) is observed. In particular, Eq. (36) implies that which is well verified here. It shows that the TLS in the system are isolated and independent of each other at small .
We have focused on corresponding to ultrastable glasses, for which analytical expressions are obtained. We now explain additional simulations on less stable glasses with a higher initial temperature . Figure 9(a) plots against at low . Results are consistent with Eq. (27), although and , i.e. the y-intercept and slope, deviate from the theoretical values in Eq. (36). The discrepancies increase with because the initial temperature can no longer be taken as the fictive temperature at low due to significant relaxations. To illustrate the full picture, Fig. 9(b) plots against in a log-log scale from the same simulations for the entire temperature range. Consider or 0.2 simulating the formation of glasses by cooling from the liquid phase. At high , is of the order of , where . This is consistent with typical experimental values of excess entropy of glasses over their crystalline counterparts Moynihan and Angell (2000). As decreases, drops by a few orders of magnitude and eventually follows the temperature dependence in Eq. (27). Note that the curves for and 0.2 in Fig. 9(a) and (b) nearly coincide at . This is because the systems remain close to equilibrium during cooling at so that the thermal history above is irrelevant.
Fig. 3(a) in the main text plots the void displacement versus time of two TLS at , revealing their bistable nature. To provide the full picture, they are reproduced in Fig. 10, which also shows similar displacement-time graphs of these two voids at a wide range of . We observe that at , the voids are mobile and the displacements resemble those of simple random walks, indicating the liquid phase. At , localization of the voids during the displayed period is clear. At , the voids are much more tightly localized. The system is deep in the glass phase. One void already forms a TLS. The other leads to a four-level system, although the two excited levels carry much less probabilistic weights. At , both TLS have emerged from the strong localization, without detectable transition to higher levels.
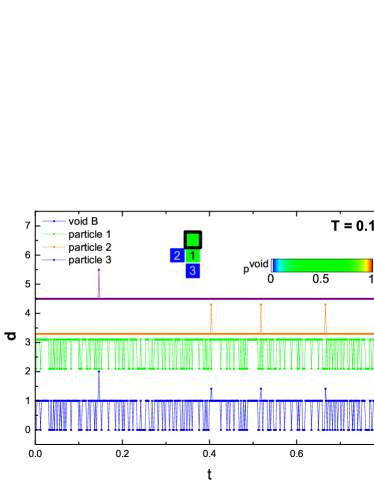
In the main text, we have argued that a TLS requires a void return probability , while a particle return probability is a necessary but an insufficient condition. To explain it further, Fig. 11 shows the displacement-time graph of a void exhibiting a four-level system. A transition between the two lower energy levels with and 1 involves the hop of a particle, the displacement of which is also shown (green). Excitations to two other levels with and in contrast involve the hop of two other particles, with their displacements also shown (orange and purple). From their displacement-time graphs, all three particles exhibit bistability and contribute to a unit particle return probability . However, they do not form three non-interacting TLS, as the first particle must be at the state before one of the other two particles can hop. These constraints are easily understood from the spatial profile of the possible positions of the void (see inset in Fig. 11). Therefore, this void together with the three particles form a four-level system, rather than three independent TLS.
Note that in the displacement-time graphs of voids and particles discussed above, alone does not perfectly resolve all possible levels. For example, can result from one of any four possible nearest neighboring hops of the void on a square lattice. Thus, we have also examined real space images as well as and components of the void displacement. All examples of TLS described by these plots indeed exhibit bistability.
References
- Stillinger and Debenedetti (2013) F. H. Stillinger and P. G. Debenedetti, “Glass transition thermodynamics and kinetics,” Annu. Rev. Condens. Matter Phys. 4, 263 (2013).
- Arceri et al. (2020) F. Arceri, F.çois P. Landes, L. Berthier, and G. Biroli, “Glasses and aging: A statistical mechanics perspective,” arXiv:2006.09725 (2020).
- Zeller and Pohl (1971) R. C. Zeller and R. O. Pohl, “Thermal conductivity and specific heat of noncrystalline solids,” Phys. Rev. B 4, 2029 (1971).
- Anderson et al. (1972) P. W. Anderson, B. I. Halperin, and C. M. Varma, “Anomalous low-temperature thermal properties of glasses and spin glasses,” Philosophical Magazine 25, 1 (1972).
- Phillips (1972) W. A. Phillips, “Tunneling states in amorphous solids,” Journal of Low Temperature Physics 7, 351 (1972).
- Phillips (1987) W. A. Phillips, “Two-level states in glasses,” Rep. Prog. Phys. 50, 1657 (1987).
- Leggett and Vural (2013) A. J. Leggett and D. C. Vural, ““tunneling two-level systems” model of the low-temperature properties of glasses: Are “smoking-gun” tests possible?” J. Phys. Chem. B 117, 12966 (2013).
- Queen et al. (2013) D. R. Queen, X. Liu, J. Karel, T. H. Metcalf, and F. Hellman, “Excess specific heat in evaporated amorphous silicon,” Phys. Rev. Lett. 110, 135901 (2013).
- Pérez-Castañeda et al. (2014) T. Pérez-Castañeda, C. Rodríguez-Tinoco, J. Rodríguez-Viejo, and M. A. Ramos, “Suppression of tunneling two-level systems in ultrastable glasses of indomethacin,” Proc. Natl. Acad. Sci. 111, 11275 (2014).
- Ramos (2020) M. A. Ramos, “Are universal “anomalous” properties of glasses at low temperatures truly universal?” Low Temperature Physics 46, 104 (2020).
- Carruzzo and Clare (2020) H. M. Carruzzo and C. Yu Clare, “Why phonon scattering in glasses is universally small at low temperatures,” Phys. Rev. Lett. 124, 075902 (2020).
- Müller et al. (2019) C. Müller, J. H. Cole, and Jürgen Lisenfeld, “Towards understanding two-level-systems in amorphous solids: insights from quantum circuits,” Rep. Prog. Phys. 82, 124501 (2019).
- Kob and Andersen (1995) W. Kob and H. C. Andersen, “Testing mode-coupling theory for a supercooled binary lennard-jones mixture i: The van hove correlation function,” Phys. Rev. E 51, 4626 (1995).
- (14) J. P. Garrahan, P. Sollich, and C. Toninelli, “Kinetically constrained models,” in Dynamical Heterogeneities in Glasses, Colloids and Granular Media, edited by L. Berthier, G. Biroli, J.-P. Bouchaud, L. Cipelletti, and W. van Saarloosand (Oxford University Press, 2011) .
- Damart and Rodney (2018) T. Damart and D. Rodney, “Atomistic study of two-level systems in amorphous silica,” Phys. Rev. B 97, 014201 (2018).
- Khomenko et al. (2020) D. Khomenko, C. Scalliet, L. Berthier, D. R. Reichman, and F. Zamponi, “Depletion of two-level systems in ultrastable computer-generated glasses,” Phys. Rev. Lett. 124, 225901 (2020).
- Baggioli and Zaccone (2019) M. Baggioli and A. Zaccone, “Hydrodynamics of disordered marginally stable matter,” Phys. Rev. Research 1, 012010 (2019).
- Baggioli et al. (2019) M. Baggioli, R. Milkus, and A. Zaccone, “Vibrational density of states and specific heat in glasses from random matrix theory,” Phys. Rev. E 100, 062131 (2019).
- Zhang and Lam (2017) L.-H. Zhang and C.-H. Lam, “Emergent facilitation behavior in a distinguishable-particle lattice model of glass,” Phys. Rev. B 95, 184202 (2017).
- Karpov et al. (1983) V. G. Karpov, I. Klinger, and F. N. Ignat’Ev, “Theory of the low-temperature anomalies in the thermal properties of amorphous structures,” Zh. eksp. teor. Fiz 84, 760 (1983).
- Buchenau et al. (1991) U. Buchenau, Y. M. Galperin, V. L. Gurevich, and H. R. Schober, “Anharmonic potentials and vibrational localization in glasses,” Phys. Rev. B 43, 5039 (1991).
- Deng et al. (2019) H.-Y. Deng, C.-S. Lee, M. Lulli, L.-H. Zhang, and C.-H. Lam, “Configuration-tree theoretical calculation of the mean-squared displacement of particles in glass formers,” J. Stat. Mech. 2019, 094014 (2019).
- Lulli et al. (2020) M. Lulli, C.-S. Lee, H.-Y. Deng, C.-T. Yip, and C.-H. Lam, “Spatial heterogeneities in structural temperature cause kovacs’ expansion gap paradox in aging of glasses,” Phys. Rev. Lett. 124, 095501 (2020).
- Lulli et al. (2021) M. Lulli, C.-S. Lee, L.-H. Zhang, H.-Y. Deng, and C.-H. Lam, “Kovacs effect in glass with material memory revealed in non-equilibrium particle interactions,” J. Stat. Mech. 2021, 093303 (2021).
- Lee et al. (2020) C.-S. Lee, M. Lulli, L.-H. Zhang, H.-Y. Deng, and C.-H. Lam, “Fragile glasses associated with a dramatic drop of entropy under supercooling,” Phys. Rev. Lett. 125, 265703 (2020).
- Lee et al. (2021) C.-S. Lee, H.-Y. Deng, C.-T. Yip, and C.-H. Lam, “Large heat-capacity jump in cooling-heating of fragile glass from kinetic monte carlo simulations based on a two-state picture,” Phys. Rev. E 104, 024131 (2021).
- Swallen et al. (2007) S. F. Swallen, K. L. Kearns, M. K. Mapes, Y. S. Kim, R. J. McMahon, M. D. Ediger, T. Wu, L. Yu, and S. Satija, “Organic glasses with exceptional thermodynamic and kinetic stability,” Science 315, 353 (2007).
- Zhao et al. (2013) J. Zhao, S. L. Simon, and G. B. McKenna, “Using 20-million-year-old amber to test the super-arrhenius behaviour of glass-forming systems,” Nat. Comm. 4, 1 (2013).
- Yip et al. (2020) C.-T. Yip, M. Isobe, C.-H. Chan, S. Ren, K.-P. Wong, Q. Huo, C.-S. Lee, Y.-H. Tsang, Y. Han, and C.-H. Lam, “Direct evidence of void-induced structural relaxations in colloidal glass formers,” Phys. Rev. Lett. 125, 258001 (2020).
- Lam (2017) C.-H. Lam, “Repetition and pair-interaction of string-like hopping motions in glassy polymers,” J. Chem. Phys. 146, 244906 (2017).
- Vollmayr-Lee (2004) K. Vollmayr-Lee, “Single particle jumps in a binary lennard-jones system below the glass transition,” J. Chem. Phys. 121, 4781 (2004).
- Lam (2018) C.-H. Lam, “Local random configuration-tree theory for string repetition and facilitated dynamics of glass,” J. Stat. Mech. 2018, 023301 (2018).
- Angell (1997) C. Austen Angell, “Entropy and fragility in supercooling liquids,” Journal of research of the National Institute of Standards and Technology 102, 171 (1997).
- Moynihan and Angell (2000) C. T. Moynihan and C. Austen Angell, “Bond lattice or excitation model analysis of the configurational entropy of molecular liquids,” J. Non-Cryst. Solids 274, 131 (2000).
- Stephens (1973) R. B. Stephens, “Low-temperature specific heat and thermal conductivity of noncrystalline dielectric solids,” Phys. Rev. B 8, 2896 (1973).
- Aichele et al. (2003) M. Aichele, Y. Gebremichael, F. W. Starr, J. Baschnagel, and S. C. Glotzer, “Polymer-specific effects of bulk relaxation and stringlike correlated motion in the dynamics of a supercooled polymer melt,” J. Chem Phys. 119, 5290 (2003).
- Keys et al. (2011) A. S. Keys, L. O. Hedges, J. P. Garrahan, S. C. Glotzer, and D. Chandler, “Excitations are localized and relaxation is hierarchical in glass-forming liquids,” Phys. Rev. X 1, 021013 (2011).