Search for Majoron-emitting modes of 136Xe double beta decay with the complete EXO-200 dataset
Abstract
A search for Majoron-emitting modes of the neutrinoless double-beta decay of 136Xe is performed with the full EXO-200 dataset. This dataset consists of a total 136Xe exposure of 234.1 kgyr, and includes data with detector upgrades that have improved the energy threshold relative to previous searches. A lower limit of T4.31024 yr at 90% C.L. on the half-life of the spectral index Majoron decay was obtained, a factor of 3.6 more stringent than the previous limit from EXO-200 and a factor of 1.6 more stringent than the previous best limit from KamLAND-Zen. This limit corresponds to a constraint on the Majoron-neutrino coupling constant of -. The lower threshold and the additional data taken resulted in a factor 8.4 improvement for the mode compared to the previous EXO-200 search. This search provides the most stringent limits to-date on the Majoron-emitting decays of 136Xe with spectral indices and 7.
I Introduction
Double-beta () decay is a rare weak transition between two nuclei with the same mass number and nuclear charges that differ by two units. The process is only observable if single-beta () decay is highly suppressed or forbidden by energy conservation. Decays in which two neutrinos are emitted () are an allowed process in the Standard Model, and have been observed in a number of nuclides [1] including 136Xe with a half-life of =[ (stat) (syst)] yr [2]. However, if neutrinos are massive Majorana fermions, decays can also proceed without emission of neutrinos, violating lepton number conservation [3]. The simplest of such modes, the 0 decay with the emission of two electrons and nothing else, is a subject of an intense experimental search [4]. The most recent measurements have set stringent lower limits on the half-life for 0 decay of several isotopes, including 136Xe (EXO-200 [5] and KamLAND-Zen [6]), 76Ge (GERDA [7]), and 130Te (CUORE [8]).
In this paper we present results of a search for neutrinoless decay modes of 136Xe in which one or two additional bosons, denoted as here, are emitted together with the electrons, i.e.:
| (1) |
or
| (2) |
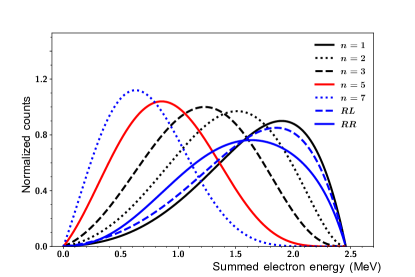
Any bosons emitted in the 0 (0) modes are usually referred to as “Majorons”. Majorons were originally proposed as a Goldstone boson associated with spontaneous lepton number symmetry breaking [9, 10, 11]. Majorons are possible dark matter candidates [12], and may be involved in cosmological and astrophysical processes [13, 14]. Precise measurement of the width of the boson decay to invisible channels [15] has disfavored the original Majoron models. However, other analogous models have been proposed, free of this constraint, in which Majorons more generally refer to massless or light bosons that might be neither Goldstone bosons, nor be required to carry a lepton charge [16]. The spectral index is used to characterize different Majoron-emitting modes that are experimentally recognizable by the shape of the sum electron spectrum [17, 18]. A novel model of decay with a emission of a light Majoron-like scalar particle was also proposed in [19], where the Majoron-like particle couples via an effective seven-dimensional operator with a right-handed lepton current, and with right-handed () or left-handed () quark current. The normalized spectra for various Majoron-emitting decay modes of 136Xe are shown in Fig. 1. The calculation of the spectra uses the Fermi function suggested in [20] that fully includes the nuclear finite size and electron screening [21] and evaluates the value of the Fermi function at the nuclear radius as recommended in [22]. The single-state dominance model of is used, while the higher-state dominance models that yield slightly different spectral shapes [23, 24] are not considered in the analysis.
Recent sensitive searches for Majoron-emitting decays have been carried out in 76Ge (GERDA [25]), 130Te (CUORE [26]), and 136Xe (KamLAND-Zen [6] and EXO-200 [21]). EXO-200 reported a lower limit of yr at 90% C.L. on the half-life of the spectral index Majoron decay mode based on 100 kgyr exposure of 136Xe [21], compared with a lower limit of yr at 90% C.L. reported by KamLAND-Zen [6]. Following that analysis, several detector upgrades were made to EXO-200 permitting a lower analysis threshold, and additional data were acquired in “Phase-II” of EXO-200 operations from May 2016 to December 2018 utilizing these technical improvements. The total Phase-II exposure collected was similar to that of the first run (“Phase-I”, September 2011 to February 2014) from which the previous searches for Majoron-emitting modes were reported. This paper reports a search for Majoron-emitting modes of decay using the full EXO-200 dataset that totals 1181.3 days of live time after data quality cuts described in [27], corresponding to a 134% increase in 136Xe exposure relative to the previous search [21].
II Detector description, Data and Monte Carlo Simulation
The EXO-200 detector consisted of a cylindrical liquid xenon (LXe) time projection chamber (TPC) filled with LXe enriched to 80.6% in 136Xe. A cathode split the TPC into two drift regions, each with a radius of 18 cm and a drift length of 20 cm. The TPC was enclosed by a radiopure thin-walled copper vessel. The electric field in the drift region was raised from 380 Vcm in Phase-I to 567 Vcm in Phase-II to improve the energy resolution. The ionization produced from interactions in each drift region was read out after being drifted to crossed-wire planes at each anode, inducing signals on the front-most wire plane (V-wires), after which it was collected by the second wire plane (U-wires). The scintillation light was collected by arrays of large area avalanche photo-diodes (LAAPDs) [28] located behind the wire planes. A more detailed description of the detector can be found in [29, 30].
The detector was located inside a clean room at the Waste Isolation Pilot Plant (WIPP) in Carlsbad, New Mexico, under an overburden of 1623 meters water equivalent [31]. An active muon veto system consisting of plastic scintillator panels surrounding the clean room on four sides allowed prompt identification of 94% of the cosmic ray muons passing through the setup, and allowed rejection of cosmogenic backgrounds [31].
Each TPC event is reconstructed by grouping charge and light signals into individual energy deposits. Ionization signals measured by the two wire planes provide information about coordinates and perpendicular to the drift field. The time difference between the light signal and the associated charge signal, together with the measured electron drift velocity [32], provides the position. Events with a single reconstructed charge deposit are referred to as “single site” (SS), and include most or decays with characteristic spatial extent of 2–3 mm. Events with multiple reconstructed deposits are referred to as “multisite” (MS), and arise mostly from multiple interactions of MeV-energy -rays. Additionally, internally generated -like events in the fiducial volume (FV) are uniformly distributed in the LXe, compared to the spatial distribution of background events arising from -rays entering the TPC, which tend to be concentrated nearer to the vessel walls. This difference is captured in the analysis by the standoff-distance (SD) variable, defined as the shortest distance between any reconstructed charge deposit and the closest material surface excluding the cathode. The total energy of an event is determined by combining the charge and scintillation signals. This combination achieves better energy resolution than possible from each individual channel alone due to the anticorrelation between them [33, 34].
The detector response to decays and background interactions is modeled by a detailed Monte Carlo (MC) simulation based on GEANT4 [35]. Radioactive sources are deployed at several positions near the TPC to characterize the detector response and validate the MC simulation. The scintillation and ionization yields were determined with interactions from calibration sources over a range of electric fields [34]. The energy scale and resolution are simultaneously determined by fitting the expected energy spectra generated by MC to the corresponding calibration sources. The absolute energy scale is found to be consistent with the calibration sources at the sub-percent level [5, 34].
The dataset and event selection criteria used in this work is the same as in the search for decay [5], except that a reduced energy threshold is used here. The 136Xe exposure of the entire dataset after data quality cuts and accounting for live time loss due to vetoing events coincident with the muon detector is 234.1 kgyr, or 1727.5 molyr, with 117.4 (116.7) kgyr in Phase-I (Phase-II).
III Analysis Procedure
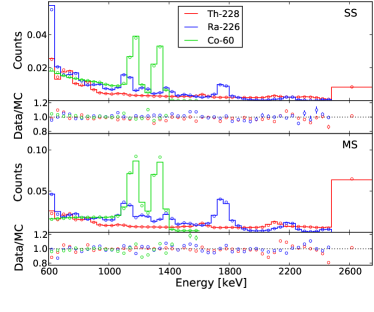
The energy threshold used in this work is lowered from the 1000 keV threshold used in the most recent search by EXO-200 [5] to 600 keV, to improve sensitivity to Majoron-emitting modes at low energy. As shown in Fig. 2, the energy measurement shows good spectral agreement between the data and the simulation for SS and MS events above 600 keV using 228Th, 226Ra, and 60Co calibration sources. The SD is also observed to have good agreement between the data and the simulation at energies above 600 keV, as shown in Fig. 2.
Probability density functions (PDFs) for signal and background components are generated using the Monte Carlo (MC) simulation. The PDFs are functions of two observables: energy and SD. Studies were performed to estimate the sensitivity improvement possible with additional multivariate discriminators similar to those used in previous searches [5, 36], but the minimal set of variables (energy and SD) was chosen as it had comparable sensitivity while minimizing systematic errors at low energy. The systematic errors in the analysis are described in detail in Sec. IV. To avoid any possible bias in analysis criteria, all selection cuts and the choice of fitting variables were determined from MC-based sensitivity studies alone prior to performing any fits to the data itself. The components of the overall fit model are similar to that in [5] with the signal replaced by a Majoron-emitting decay. Since this work used a reduced energy threshold, two components are added to the background model:
-
•
85Kr dissolved in the LXe that produces decays with an end point energy of 687.0 keV [37]
-
•
137Cs in the materials near the LXe, which emits -rays with energy of 661.7 keV [37]
The simulation of 85Kr includes the two decay modes with branching ratios of 99.56% and 0.434% to the ground and excited states of 85Rb followed by the release of a 514.0 keV -ray, respectively [37]. A shape correction accounting for the forbidden nature of the first unique decay was calculated using the method described in [38] to be between -15% and 80% depending on its energy. This correction was applied as an event weighting in the MC simulation.
The PDF model is parametrized by the event counts and SS fractions ( = SS/(SS+MS)) of the individual components, as well as two normalization parameters to account for the effects of systematic errors [39]. The search was performed using a maximum-likelihood (ML) function to fit simultaneously both SS and MS events with their corresponding PDFs generated by MC, in a similar approach as [5]. Systematic errors, described in Sec. IV are included in the ML fit as nuisance parameters constrained by normal distributions. The median 90% CL sensitivity is estimated using toy datasets generated from the PDFs of the background model. An energy threshold of 600 keV is used in the fit, which provides near optimal sensitivity for all Majoron-emitting modes considered here. The reduced energy threshold relative to previous analyses [21, 5] results in higher signal detection efficiencies, especially for the mode, which has a peak around 628 keV in the energy spectrum. Lower energy thresholds do not further improve sensitivity because the increase in signal efficiency is outweighed by the presence of backgrounds, including 85Kr.
IV Systematic Errors
Systematic errors were accounted for by the same technique as described in [39, 5]. The five Gaussian constraints added to the ML fit, which are used to propagate systematic errors into the results, correspond to:
-
•
uncertainty in the activity of radon in the LXe as determined in stand-alone studies via measurement of time correlated 214Bi-214Po decays [40];
-
•
uncertainty in the relative fractions of neutron capture-related PDF components generated by dedicated simulations [31];
-
•
uncertainty in SS fractions obtained by comparisons between calibration data and MC;
-
•
uncertainty in the overall event detection efficiency, referred to as normalization, caused by event reconstruction and selection efficiencies;
-
•
uncertainty in the signal detection efficiency, referred to as signal-specific normalization, caused by discrepancies in the shape distributions between data and MC and background model uncertainties.
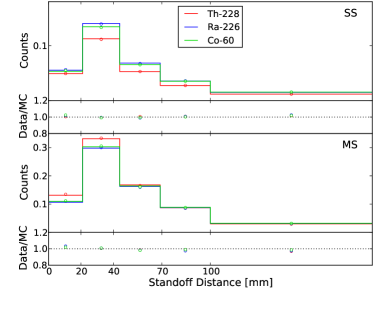
The first two uncertainties were constrained by relative errors of 10% and 20%, respectively, as evaluated in [41]. The uncertainty in the SS fractions is determined by comparisons between the data and MC for calibration sources, as shown in Fig. 3. Taking into account different calibration sources at various positions, these systematics are evaluated to be 3.7% (3.6%) for Phase-I (Phase-II), averaged over the energy range considered here. The uncertainty on the overall efficiency was evaluated to be 3.1% (3.0%) for Phase-I (Phase-II), and differs slightly from that estimated in [5] after accounting for the larger energy range considered here. The top four uncertainties are presented in Table 1.
Discrepancies in the shape distributions between data and MC are propagated into the signal rate through a normalization parameter that only scales the coefficient of the signal PDFs. This signal-specific normalization parameter is constrained to unity within the errors arising from spectral shape agreement and background model uncertainties as described below. To estimate the effect of spectral shape errors, the ratio between data and MC of the projections onto energy and SD (Fig. 2) were used to re-weight all PDF components by the observed differences (referred to below as un-skewing). 60Co and 238U-related PDFs were weighted by ratios from 60Co and 226Ra calibration sources respectively, while the other -like PDFs were weighted by ratios from the 228Th source that has the most data. Toy datasets were generated from these un-skewed background PDFs, along with a given number of signal events. These toy datasets were then fit with the standard background and signal PDFs used in the primary analysis. The average difference between the true number of signal events added to the toy datasets and the best-fit signal counts is used to quantify the impact of the spectral discrepancy. To evaluate the uncertainty associated with the background model, decays of Th, U, and Co were simulated in different locations than that in the default model. For example, all far 238U are represented by the decays in the air gap between the cryostat and the lead shielding in the background model. To evaluate the errors introduced by this approximation, 238U simulated in the cryostats is used to represent all 238U from remote locations. This is taken to represent an extreme deviation from the more realistic case used in this analysis. Toy datasets generated with the default model along with a given number of signal events were fitted with this alternative model, and the resulting difference between the true number of signal events added to the toy datasets and the best-fit signal counts is taken as the systematic error of the background model. The background model error also includes the effects of perturbations to the 2 spectrum due to corrections to the Fermi function arising from the finite nuclear size and electron screening effects [20, 22]. The PDF integrals differed by 1.5% in the case of a differing Fermi function. The signal-specific normalization error is a function of the number of signal counts to account for possible existence of signal events, that is presented in Table 2.
| Constraints | Phase-I | Phase-II |
| Radon in LXe | 10% | 10% |
| Neutron-capture PDF fractions | 20% | 20% |
| SS fractions | 3.7% | 3.6% |
| Normalization | 3.1% | 3.0% |
| Decay Mode | RR | RL | |||||
| Phase-I | a b | 0.11 138 | 0.04 201 | 0.08 435 | 0.37 2040 | 0.25 62 | 0.17 66 |
| Phase-II | a b | 0.19 48 | 0.12 123 | 0.18 143 | 0.02 555 | 0.27 37 | 0.22 47 |
V Results and conclusion
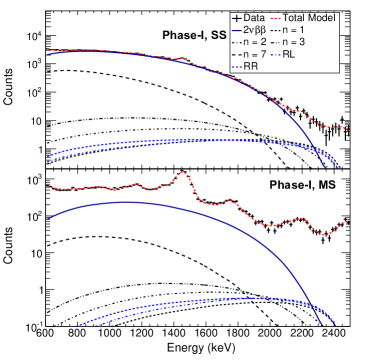
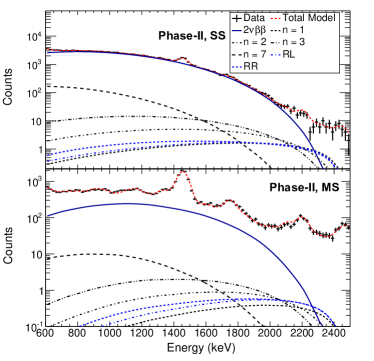
To determine confidence intervals on each of the Majoron decay modes considered here, the datasets from Phase-I and Phase-II are fit independently with efficiency and livetime from each phase taken into account. The observed data, and an example of the best fit spectrum for the Majoron mode, are shown in Fig. 4. No statistically significant evidence for Majoron-emitting decays is observed for any mode considered. The fits are initially performed individually for each Majoron-emitting decay mode separately for Phase-I and Phase-II, and the combined limits are determined after summing the profile likelihood obtained from each dataset. While the fits are performed for each mode independently, Fig. 4 also overlays the corresponding spectra from all fits at the 90% C.L. upper limits on the number of decays for each mode. The lower limits on the Majoron-emitting half-lives are summarized in Table 3. EXO-200 has better detection efficiency at low energies and improved spectral agreement between data and MC simulation in Phase-II with upgraded electronics, which result in more stringent lower limits on most Majoron-emitting half-lives than in Phase-I. The improvement is particularly significant for mode that has a spectrum peaking at lower energy than the other modes.
| Decay Mode | Phase-I, yr | Phase-II, yr | Combined, yr | EXO-200 (2014), yr | |
| 2.31024 | 3.01024 | 4.31024 | - | 1.21024 | |
| 9.71023 | 9.81023 | 1.51024 | - | 2.51023 | |
| 4.61023 | 3.81023 | 6.31023 | 2.71022 | ||
| 4.61023 | 3.81023 | 6.31023 | - | 2.71022 | |
| 1.61022 | 6.01022 | 5.11022 | - | 6.11021 | |
| RR | 2.01024 | 2.21024 | 3.71024 | - | - |
| RL | 2.31024 | 2.71024 | 4.11024 | - | - |
The lower limit on the Majoron-emitting half-lives for the models with 1, 3, and 7 can be translated into limits on the effective neutrino-Majoron coupling constants using:
| (3) |
where =, is the nuclear matrix element, is the axial coupling constant, (4) for the emission of one (two) Majorons, and is the unnormalized phase space integral that depends on the model type and fundamental constants [21]. Table 3 summarizes the 90% C.L. upper limits on the effective Majoron-neutrino coupling constants. The phase space factors are taken from [21], while the matrix elements are taken from [42, 43] for the Majoron decay mode with , and from [44] for other modes. The spread in the limits on the coupling constants is due to ambiguity in the matrix elements. This is the most stringent limit on for the Majoron among all decay nuclei [45, 46, 25, 26]. The previous best limit from a laboratory experiment comes from KamLAND-Zen, which reported a limit of (0.8-1.6) [45]. The phase-space integral for the Majoron used by KamLAND-Zen is about a factor two smaller than the most up to date value used here [21]. KamLAND-Zen’s half-life limit would translate to a limit on the coupling constant of (0.6-1.2) with the same phase space factor, and our new limit corresponds to a factor of 1.3 improvement over this previous result. Our limit on the coupling constant of is two orders of magnitude more stringent than the recent result obtained in the measurement of pion decays [47].
In conclusion, we report results from a search for Majoron-emitting double-beta decay modes of 136Xe with the complete EXO-200 dataset. No statistically significant evidence for this process is found, and we obtain limits on half-lives and effective coupling constants of Majoron-emitting decay modes that are more stringent than results of previous EXO-200 [21] and KamLAND-Zen [45] searches.
Acknowledgements.
EXO-200 is supported by the DOE and NSF in the U.S., the NSERC in Canada, the SNF in Switzerland, the IBS in Korea, the RFBR in Russia, the DFG in Germany, and CAS and ISTCP in China. The EXO-200 data analysis and simulation use resources of the National Energy Research Scientific Computing Center (NERSC). We gratefully acknowledge the KARMEN collaboration for supplying the cosmic-ray veto detectors, as well as the WIPP for their hospitality. We would also like to thank Ricardo Cepedello for providing some of the energy spectra of two electrons for neutrinoless double-beta decay of 136Xe with nonstandard Majoron emission.References
- Zyla et al. [2020] P. Zyla et al. (Particle Data Group), Prog. Theor. Exp. Phys. , 083C01 (2020).
- Albert et al. [2014a] J. B. Albert et al. (EXO-200 Collaboration), Phys. Rev. C 89, 015502 (2014a).
- Schechter and Valle [1982] J. Schechter and J. W. F. Valle, Phys. Rev. D 25, 2951 (1982).
- Dolinski et al. [2019] M. J. Dolinski, A. W. P. Poon, and W. Rodejohann, Ann. Rev. Nucl. Part. Sci. 69, 219 (2019).
- Anton et al. [2019] G. Anton et al. (EXO-200 Collaboration), Phys. Rev. Lett. 123, 161802 (2019).
- Gando et al. [2016] A. Gando et al. (KamLAND-Zen Collaboration), Phys. Rev. Lett. 117, 082503 (2016), [Addendum: Phys.Rev.Lett. 117, 109903 (2016)].
- Agostini et al. [2020] M. Agostini et al. (GERDA), Phys. Rev. Lett. 125, 252502 (2020), arXiv:2009.06079 [nucl-ex] .
- Adams et al. [2021] D. Q. Adams et al. (CUORE), (2021), arXiv:2104.06906 [nucl-ex] .
- Chikashige et al. [1981] Y. Chikashige, R. N. Mohapatra, and R. D. Peccei, Phys. Lett. B 98, 265 (1981).
- Gelmini and Roncadelli [1981] G. B. Gelmini and M. Roncadelli, Phys. Lett. B 99, 411 (1981).
- Georgi et al. [1981] H. M. Georgi, S. L. Glashow, and S. Nussinov, Nucl. Phys. B 193, 297 (1981).
- Lattanzi et al. [2013] M. Lattanzi, S. Riemer-Sorensen, M. Tortola, and J. W. F. Valle, Phys. Rev. D 88, 063528 (2013).
- Dolgov and Takahashi [2004] A. D. Dolgov and F. Takahashi, Nucl. Phys. B 688, 189 (2004).
- Das and Pulido [2011] C. R. Das and J. Pulido, Phys. Rev. D 84, 105040 (2011).
- Schael et al. [2006] S. Schael et al. (ALEPH, DELPHI, L3, OPAL, SLD, LEP Electroweak Working Group, SLD Electroweak Group, SLD Heavy Flavour Group), Phys. Rept. 427, 257 (2006), arXiv:hep-ex/0509008 .
- Barabash [2015] A. Barabash, Physics Procedia 74, 416 (2015).
- Bamert et al. [1995] P. Bamert, C. Burgess, and R. Mohapatra, Nucl. Phys. B 449, 25 (1995).
- Hirsch et al. [1996a] M. Hirsch, H. Klapdor-Kleingrothaus, S. Kovalenko, and H. Päs, Phys. Lett. B 372, 8 (1996a).
- Cepedello et al. [2019] R. Cepedello, F. F. Deppisch, L. González, C. Hati, and M. Hirsch, Phys. Rev. Lett. 122, 181801 (2019).
- Schenter and Vogel [1983] G. Schenter and P. Vogel, Nuclear Science and Engineering 83, 393 (1983).
- Albert et al. [2014b] J. B. Albert et al. (EXO-200 Collaboration), Phys. Rev. D 90, 092004 (2014b).
- Kotila and Iachello [2012] J. Kotila and F. Iachello, Phys. Rev. C 85, 034316 (2012).
- Moreno et al. [2009] O. Moreno, R. Alvarez-Rodriguez, P. Sarriguren, E. Moya de Guerra, F. Simkovic, and A. Faessler, J. Phys. G 36, 015106 (2009).
- Barea et al. [2013] J. Barea, J. Kotila, and F. Iachello, Phys. Rev. C 87, 014315 (2013).
- Agostini et al. [2015] M. Agostini et al., Eur. Phys. J. C 75, 416 (2015).
- Davis [2020] C. J. Davis, Search for Neutrinoless Double-Beta Decay with Majoron Emission in Cuore, Ph.D. thesis, Yale University (2020).
- Albert et al. [2014c] J. B. Albert et al. (EXO-200 Collaboration), Phys. Rev. C 89, 015502 (2014c).
- Neilson et al. [2009] R. Neilson et al., Nucl. Instrum. Meth. A 608, 68 (2009).
- Auger et al. [2012] M. Auger et al., Journal of Instrumentation 7, P05010 (2012).
- Ackerman et al. [2021] N. Ackerman et al., (2021), arXiv:2107.06007 [physics.ins-det] .
- Albert et al. [2016] J. Albert et al. (EXO-200 Collaboration), JCAP 2016, 029 (2016).
- Albert et al. [2017a] J. B. Albert et al. (EXO-200 Collaboration), Phys. Rev. C 95, 025502 (2017a).
- Conti et al. [2003] E. Conti et al., Phys. Rev. B 68, 054201 (2003).
- Anton et al. [2020] G. Anton et al. (EXO-200 Collaboration), Phys. Rev. C 101, 065501 (2020).
- Allison et al. [2006] J. Allison et al., IEEE Trans. Nucl. Sci. 53, 270 (2006).
- Albert et al. [2018] J. B. Albert et al. (EXO-200 Collaboration), Phys. Rev. Lett. 120, 072701 (2018).
- National Nuclear Data Center [2008] B. N. L. National Nuclear Data Center, “Nudat (nuclear structure and decay data),” (2008).
- Konopinski [1966] E. J. Konopinski, The theory of beta radioactivity (Oxford University Press, 1966).
- Albert et al. [2017b] J. B. Albert et al. (EXO-200 Collaboration), Phys. Rev. D 96, 092001 (2017b).
- Albert et al. [2015] J. B. Albert et al. (EXO-200 Collaboration), Phys. Rev. C 92, 015503 (2015).
- Albert et al. [2014d] J. B. Albert et al. (EXO-200 Collaboration), Phys. Rev. C 89, 015502 (2014d).
- Menendez et al. [2009] J. Menendez, A. Poves, E. Caurier, and F. Nowacki, Nucl. Phys. A 818, 139 (2009).
- Simkovic et al. [2009] F. Simkovic, A. Faessler, H. Muther, V. Rodin, and M. Stauf, Phys. Rev. C 79, 055501 (2009).
- Hirsch et al. [1996b] M. Hirsch, H. V. Klapdor-Kleingrothaus, S. G. Kovalenko, and H. Pas, Phys. Lett. B 372, 8 (1996b).
- Gando et al. [2012] A. Gando et al. (KamLAND-Zen Collaboration), Phys. Rev. C 86, 021601 (2012).
- Arnold et al. [2014] R. Arnold et al. (NEMO-3), Phys. Rev. D 89, 111101 (2014).
- Aguilar-Arevalo et al. [2021] A. Aguilar-Arevalo et al. (PIENU), Phys. Rev. D 103, 052006 (2021).