Factual Consistency Evaluation for Text Summarization via Counterfactual Estimation
Abstract
Despite significant progress has been achieved in text summarization, factual inconsistency in generated summaries still severely limits its practical applications. Among the key factors to ensure factual consistency, a reliable automatic evaluation metric is the first and the most crucial one. However, existing metrics either neglect the intrinsic cause of the factual inconsistency or rely on auxiliary tasks, leading to an unsatisfied correlation with human judgments or increasing the inconvenience of usage in practice. In light of these challenges, we propose a novel metric to evaluate the factual consistency in text summarization via counterfactual estimation, which formulates the causal relationship among the source document, the generated summary, and the language prior. We remove the effect of language prior, which can cause factual inconsistency, from the total causal effect on the generated summary, and provides a simple yet effective way to evaluate consistency without relying on other auxiliary tasks. We conduct a series of experiments on three public abstractive text summarization datasets, and demonstrate the advantages of the proposed metric in both improving the correlation with human judgments and the convenience of usage. The source code is available at https://github.com/xieyxclack/factual_coco.
1 Introduction
In recent years, significant progress has been achieved in text summarization, and with the help of deep neural networks, we can generate informative, relevant, and fluent texts See et al. (2017); Narayan et al. (2018); Liu and Lapata (2019). However, it still remains a major challenge to ensure the factual consistency of the generated summary with respect to the source document Zhang et al. (2020c); Kryscinski et al. (2020). For instance, in the annotated data released by Maynez et al. (2020), more than 50% of the generated summaries are not completely consistent with the source document. Such factual inconsistency between source document and generated summary, also known as hallucination, undoubtedly limits practical applications of text summarization techniques.
To ensure the factual consistency in text summarization, a reliable automatic evaluation metric is the first and the most crucial factor Goodrich et al. (2019). The predominant automatic metrics, e.g., ROUGE Lin (2004) and METEOR Lavie and Agarwal (2007), are mainly based on -gram lexical-overlap and have been proven to be poorly correlated with human judgments on factual consistency Bhandari et al. (2020); Maynez et al. (2020); Wang et al. (2020). To better evaluate the factual consistency of summarization systems, various types of metrics have been introduced, including computing semantic similarity with pretrained model instead of -gram based similarity Zhang et al. (2020b); Koto et al. (2020), and using auxiliary tasks such as textual entailment Falke et al. (2019); Maynez et al. (2020) and question answering Chen et al. (2018); Eyal et al. (2019); Wang et al. (2020); Scialom et al. (2021). However, none of them tackle this issue from the view of intrinsic cause of the factual inconsistency. Besides, some metrics rely on auxiliary tasks (e.g., question answering), which makes these metrics costly and inconvenient. In short, automatic evaluation for factual consistency in text summarization still remains an open research problem.
Revisiting the sequence-to-sequence (Seq2Seq) summarization models, a summary is generated according to the encoded source document and the learned decoder. The information in the source document is encoded and used to ensure the factual consistency of generated summary. The decoder, as a language model, learns the language prior from the training corpus to transform the encoded source document to an informative and fluent summary. However, the side effects also come along with the language prior, hallucinating the inconsistency tokens due to spurious linguistic correlations learned from training corpus. For instance, when the term green leaves occurs frequently in the training corpus and the summarization model has learned such language prior knowledge, it could be with high probability to generate such inconsistency term green leaves, even though the source document is about red maple leaves. Similar hallucination phenomena have also been observed in other conditional text generation tasks, including image caption Hendricks et al. (2018) and data-to-text Filippova (2020).
Shed light by the above challenges and insights, in this paper, we seek to design a simple yet effective evaluation metric, named Counterfactual Consistency (denoted as CoCo), for text summarization. Different from the existing metrics, CoCo is proposed to evaluate the factual consistency of summarized texts via counterfactual estimation, and it does not rely on auxiliary tasks, which brings the convenience of usage in practice. To be specific, with the help of causal inference Pearl and Mackenzie (2018); Yao et al. (2021), we formulate the causal relationship among the source document, the generated summary, and the language prior to build up the causal graph for text summarization. According to the built causal graph and the analysis of causal effect, we point out that the effect of language prior can be blamed to cause factual inconsistency. Thus, we propose counterfactual abstractive summarization to estimate the causal effect of language prior on the generated summary, and remove it from the total causal effect. The estimated effect, which is the causal effect of the source document on the generated summary, serves as a factual consistency score of the generated summary. The intuition is that when texts are generated more relying on the source document rather than the language prior, they should be more likely to be factually consistent w.r.t. the source documents.
To demonstrate the effectiveness of the proposed metric CoCo, we conduct a series of experiments on three public datasets, which are derived from widely-used benchmarks CNN/Daily Mail Hermann et al. (2015); Nallapati et al. (2016) or XSUM Narayan et al. (2018), and have human annotations on factual consistency. Without relying on auxiliary tasks, the proposed metric CoCo achieves a significant improvement against the existing automatic metrics for text summarization in terms of the correlation with human annotations.
2 Related Work
The most popular -gram based evaluation metrics, e.g., ROUGE Lin (2004), BLEU Papineni et al. (2002) and METEOR Lavie and Agarwal (2007), have been proven to perform poorly on measuring factual consistency Wang et al. (2020). Inspired by the success of pretrained contextual word embeddings, BERTScore Zhang et al. (2020b) leverages the pretrained BERT Devlin et al. (2019) model to compute the similarity between the generated summary and reference. However, these metrics cannot lead to a satisfying correlation to human judgments on factual consistency since they only capture the token-level overlapping or similarity. Hence, instead of defining metrics on token level, Goodrich et al. (2019) proposes to measure the factual consistency by counting the overlap of facts (i.e., relation tuple) extracted from the generated summary and the source document.
Several works have also explored Natural Language Inference (NLI) to evaluate the factual consistency via calculating entailment probability between the document and its abstractive summaries Falke et al. (2019); Maynez et al. (2020). They assume that a factually consistent summary is usually entailed by the source document. To address the issue of domain shift in out-of-the-box NLI models, synthetic training datasets, e.g., augmented by summarization datasets Kryscinski et al. (2020) and QA datasets Mishra et al. (2021), are created to finetune the BERT-based NLI models.
Question answering has also been used as an evaluation method for summarization Mani et al. (1999); Clarke and Lapata (2010). For factual consistency evaluation, the basic intuition is to test whether a summary and its corresponding source have similar answers for the synthetic questions. The differences between various works are mainly in question generation and metric computation. For example, Eyal et al. (2019) generates questions from the reference summary; Wang et al. (2020) and Durmus et al. (2020) generate questions from the evaluated summary; while Scialom et al. (2021) generates questions from both the evaluated summary and its corresponding source document. For metric computation, Eyal et al. (2019) averages the percentage of questions answered correctly according to the generated summaries, while Wang et al. (2020) computes the similarity of the two answers from the summary and its corresponding source with token-level F1 score.
In summary, the existing metrics are proposed to measure the factual consistency via calculating the semantic similarity between the generated summary and the source document or the references, with the help of extrinsic tasks like pretrained language models or other auxiliary tasks. However, few of them explore the intrinsic cause of the factual inconsistency. In this paper, we study this task from the perspective of causal inference Pearl (2001); Pearl and Mackenzie (2018).
3 Methodology
In this section, we introduce the proposed metric for measuring factual consistency in text summarization, named Counterfactual Consistency (denoted as CoCo).
3.1 Causal Graph of Text Summarization
We first introduce two key concepts of causal inference, i.e., causal graph and causal effect. The causal graph represents the causal relationships between variables using a directed acyclic graph , where denotes the set of variables and represents the cause-effect relationships among these variables. Fig. 1(a) shows an example of causal graph with four variables. In a causal graph, capital letters (e.g., and ) denote random variables and lowercase letters (e.g., ) denote their observed values, respectively. An edge means a causal-effect relationship between the parent (cause) and the child (effect), e.g., it can be denoted as .
Here, we build the causal graph of abstractive text summarization as illustrated in Fig. 1(a). It reflects the causal relationships among the fact , the source document , the language prior , and the generated summary . The paths and represent the source document (e.g., an informative and fluent news report) is composed by the fact (e.g., the happened event) and the language prior knowledge . The paths and reflect the causal relationships in the generation process of a summary , which can be interpreted as: The encoder of a Seq2Seq model comprehends the input document and then the decoder transforms the hidden representation outputed from the encoder into a summary with the help of the language prior knowledge (e.g., the usage of demonstratives and prepositions, the logistic relationships intra- and inter-sentences, etc.).
The causal graph in Fig. 1(a) provides an insight for measuring factual consistency for text summarization. For an abstractive text summarization model, it demands both the information of source document (i.e., the causal effect shown by ), as well as the language prior (i.e., the causal effect shown by ) to generate the summary. The information provided by the source document ensures the summarization model to generate an informative and relevant summary. The language prior brings benefits such as grammar rules; however, on the other hand, it can also lead to hallucinate the inconsistency tokens via introducing spurious linguistic correlations or even biased knowledge learned from the training corpus Hermann et al. (2015); Niu et al. (2020).
3.2 Causal Effect
Inspired by the intrinsic cause of factual consistency in text summarization discussed above, we propose a novel automatic evaluation metric, named Counterfactual Consistency (denoted as CoCo), to measure the factual consistency via counterfactual estimation. To be specific, we aim to estimate the causal effect of to measure the factual consistency of the generated summary, since when the summaries are generated relied on the source document, they should be more likely to be factually consistent w.r.t. the source document than those generated relied on language prior.
To achieve this, we first need to use counterfactual notations to translate causal assumptions from graphs to formulas. For causal graph in Fig. 1(a), given that if is set to and is set to , the value that summary could be is denoted as:
| (1) |
Since there is no confounder of and , we have that equals to and equals to . Without loss of generality, we omit the do operator for simplicity. Thus, Eq. (1) can be simplified as:
| (2) |
Similarly, the counterfactual notation of source document can be .
As shown in Fig. 1(a), there exist two paths directly connected to , i.e., and . Thus, can be rewritten as the function of and :
| (3) |
In the factual scenario, we have . While, in the counterfactual scenario, can be set as different values. For example, describes the situation is set to . The term “” denotes the no-treatment condition, which can be interpreted as eliminating the causal effect via setting the variable to an empty value. Note that such case can only happen in the counterfactual scenario.
To measure causal effects, we need to compare two potential outcomes of the same individual given two different treatments. For example, comparing the outcomes of taking the drug (i.e., treatment) and not taking the drug (i.e., no-treatment) to estimate the effect of a drug on a disease. Here, to estimate the causal effect of input source document on summary , we aim to compare the summaries of feeding document to the summarization model (i.e., ), and the document is not given (i.e., the no-treatment condition . As shown in Fig. 1(a), the outcome of is also affected by the language prior knowledge . Thus we should take both and into consideration when estimating the effect of on . However, estimating the effect of on via is impractical, since it is hard to block the effect of (i.e., ) for an abstractive summarization system.
To address this issue, we propose to estimate the causal effect of on by subtracting the causal effect of on from the total effect. The total effect of treatment and on compares hypothetical situations (, ) and (, ), which is denoted as
| (4) |
which represents the difference between the output of taking the treatment (i.e., ) and that of no-treatment condition (i.e., ).
For the causal effect of on , we propose counterfactual abstractive summarization to estimate it by blocking the effect of . Counterfactual abstractive summarization describes the scenario where and had been . Since the response of is blocked, the model can only rely on the given language prior to generate summaries. Thus, the causal effect of on can be obtained by comparing counterfactual abstractive summarization to the no-treatment conditions:
| (5) |
where denotes the changes in the outcome with changing from to and is set to the value it would have obtained at .
Thus, the causal effect of on , denoted as , can be obtained by subtracting from :
| (6) |
It can be observed that Eq. (6) is equivalent to the comparison between the generated summaries of conventional abstractive summarization and counterfactual abstractive summarization, as illustrated in Fig. 1(b), which implies the approach to measure the factual consistency in text summarization. The term happens to be a standard abstractive summarization model that takes as input and outputs , with the help of language prior learned from training corpus; while the term describes a model that generates only depend on the language prior , in normal case it works like a language model.
Operator
Source document
Summary
Sentence-level mask
People with a DNA variation in a gene called PDSS2 tend to drink fewer cups of coffee, a study carried out at the University of Edinburgh has found. It suggests the gene reduces cell ability to break down caffeine
Researchers have identified a gene that appears to curb coffee consumption.
Span-level mask
People with a DNA variation in a gene called PDSS2 tend to drink fewer cups of coffee, a study carried out at the University of Edinburgh has found. It suggests the gene reduces cell ability to break down caffeine
Researchers have identified a gene that appears to curb coffee consumption.
3.3 CoCo Metric
There exist several ways to implement Eq. (6) by applying different functions to approximate , such as lexical overlapping and semantic similarity between the generated summaries. For text summarization, given source document , the outputs of the model are the probability distributions over the vocabulary, from which a series of tokens are sampled to compose a summary. Thus, from another point of view, functions that can be applied to the probability distribution are also suitable to approximate , such as the perplexity and uncertainty Xu et al. (2020); Xiao and Wang (2021). In this study, taking both the effectiveness and convenience into consideration, we adopt the probabilities of the tokens of evaluated summaries, i.e., , to implement Eq. (6) as our automatic evaluation metric CoCo for factual consistency. Besides, we adopt an independent summarization model as the scoring model in the instantiation of CoCo, rather than using the model that generates the evaluated summary, considering that the factual consistency can be biased by the model that produced this evaluated summary. By adopting an independent summarization model as the scoring model, CoCo can be applied to score any given summary based on its corresponding source document, disregarding how the evaluated summary is generated.
In practice, key tokens, e.g., nouns and verbs, usually play a more important role in measuring the factual consistency than conjunctions and symbols. However, the final score can be easily dominated by the probability of those negligible tokens (e.g., conjunctions) and becomes meaningless since they often have a much higher generation probability than the key tokens. To address this issue, we only count the probability of key tokens (denoted as ) in the evaluated summary. The criteria of selecting key tokens can be task-oriented designed, e.g., one can select disease names as key tokens for measuring the factual consistency of radiology reports Zhang et al. (2020c). It is worth noting that here we do not remove other tokens in the evaluated summary, we just ignore their scores.
Assume that a scoring model takes the source document as input, and tries to generate the evaluated summary in an auto-regressive manner. At -th step during decoding, the scoring model outputs a probability distribution among the vocabulary . For the term in Eq. (6), a natural choice is to obtain the probability of with the empty source document . However, in practical use, empty input could make the summarization model into an ill-posed state that produces almost zero probability for all tokens in the evaluated summary due to the mismatch between training and inference. To tackle this issue, we perform mask operation on the relevant content in that is considered as what the model relies on during the generation process of . For each token in , the masked content could be token-level, span-level, sentence-level, and even the whole document (different mask strategies are evaluated in the experiment section). We show two examples of how we mask the source document according to in Table 1.
Finally, we aggregate the mask content according to all the tokens in and result in a mask source document . The masked source document is fed into the scoring model and the decoder produces another probability distribution accordingly. The definition of CoCo can be formally given as:
| (7) |
where denotes the all prefix tokens in before -th step111when is the first token in , ., and and represents the predicted probability of token at -th when given the prefix tokens and the source document or its masked version . The algorithm of CoCo is illustrated in Algorithm 1.
4 Experiments
4.1 Datasets
To evaluate the effectiveness of the proposed metric, we conduct experiments on three public abstractive text summarization datasets.
QAGS-CNN/DM. It is a subset of CNN/Daily Mail dataset Hermann et al. (2015); Nallapati et al. (2016) and released by Wang et al. (2020). This dataset contains 235 instances collected from the test set of CNN/Daily Mail, and each instance consists of a source document, a reference summary, and a model-generated summary produced by a bottom-up abstractive summarization model Gehrmann et al. (2018). The generated summaries are assigned with human annotations to indicate their factual consistency scores.
QAGS-XSUM. This dataset is derived from XSUM Narayan et al. (2018) and contains 239 source documents, the corresponding reference summaries, and the synthetic summaries generated by BART Lewis et al. (2020). Wang et al. (2020) collects human evaluation scores on factual consistency for each generated summary via ParlAI Miller et al. (2017) .
SUMMEVAL. It is released by Fabbri et al. (2021) and contains the generated summaries from 16 abstractive and extractive models of 100 test data from DNN/Daily Mail. We adopt 1200 abstractive text summaries and extract 3600 public expert annotations on factual consistency for them.
4.2 Baselines
We adopt widely-used automatic evaluation metrics for comparison, such as ROUGE Lin (2004), BLEU Papineni et al. (2002) and METEOR Lavie and Agarwal (2007). For ROUGE, we adopt ROUGE-1, ROUGE-2 and ROUGE-L, which denotes that the overlapping units in calculation are set to be uni-grams, bi-grams and longest-common subsequence respectively.
Besides, BERTScore Zhang et al. (2020b), FFCI Koto et al. (2020), QAGS Wang et al. (2020), and QuestEval Scialom et al. (2021) are also adopted as baselines in the experiment. We use the outputs from the -th layer in roberta-large to implement BERTScore as suggested by Zhang et al. (2020b). For FFCI, a framework that can be implemented by different basic metrics, we use FFCI, FFCI, FFCI, FFCI to distinguish the different basic metrics as the original paper suggested. For QA-based metrics QAGS and QuestEval, following the settings in the original papers, the QG model and QA model in QAGS are implemented based on BART and BERT respectively, and for QuestEval, they are both implemented based on T5 Raffel et al. (2020). And we adopt QuestEval, QuestEval, QuestEval for calculating the precision, recall, and F1 score of the answers given the source documents and generated summaries.
For the proposed metric CoCo, we investigate different mask strategies in our study. We use CoCo, CoCo, CoCo, and CoCo to denote token-level, span-level (i.e., to mask five successive tokens that contain the key token as the center), sentence-level and document-level (i.e., to mask the whole document) mask strategies when calculating the causal effect of the source document on the generated summary.
4.3 Implementation
We adopt BART Lewis et al. (2020) as the scoring model for the proposed metric CoCo. To be specific, we feed the whole source document or masked source document into the encoder of BART and apply the teacher forcing Bengio et al. (2015) during the decoding process. At -th step of decoding, we take the output probability of the -th token in the evaluated summary , i.e., , as one of the factual consistency scores for the evaluated summary if is a key token recognized by part-of-speech tagging toolkit spaCy222https://spacy.io/, otherwise, we discard it.
In our study, the BART model is finetuned on the training set of CNN/Daily Mail datasets for the experiments conducted on QAGS-CNN/DM and SUMMEVAL, and finetuned on the training set of XSUM for QAGS-XSUM. For baseline models, the implementation is based on the huggingface Wolf et al. (2020). More details of the implementation can be found in the Appendix. All models are implemented using PyTorch Paszke et al. (2019) and performed on GeForce RTX 2080 Ti GPUs.
4.4 Comparison Results
| Metric | QAGS-CNN/DM | QAGS-XSUM | SUMMEVAL | |||
|---|---|---|---|---|---|---|
| ROUGE-1 | 29.01 | 23.87 | 13.12 | 12.82 | 20.23 | 17.72 |
| ROUGE-2 | 17.91 | 18.78 | 8.66 | 9.96 | 16.72 | 16.72 |
| ROUGE-L | 23.43 | 24.09 | 8.36 | 10.66 | 19.20 | 18.16 |
| METEOR | 25.65 | 24.56 | 10.78 | 11.59 | 16.91 | 14.38 |
| BLEU | 17.63 | 22.85 | 2.55 | 2.55 | 10.83 | 10.73 |
| BERTScore | 37.41 | 36.36 | 11.25 | 13.23 | 18.58 | 17.53 |
| FFCI | 43.55 | 42.00 | 13.70 | 19.26 | 36.46 | 33.86 |
| FFCI | 45.01 | 43.62 | 18.96 | 18.63 | 37.95 | 35.40 |
| FFCI | 43.11 | 41.32 | 16.67 | 17.54 | 38.02 | 34.45 |
| FFCI | 48.47 | 48.62 | 20.04 | 19.04 | 28.54 | 30.76 |
| QAGS | 31.39 | 35.96 | 15.18 | 17.48 | 17.71 | 12.65 |
| QuesEval | 38.02 | 35.96 | 5.66 | 7.43 | 33.53 | 29.52 |
| QuesEval | 41.10 | 36.40 | 6.57 | 7.33 | 26.95 | 25.69 |
| QuesEval | 49.18 | 44.53 | 7.03 | 9.63 | 36.96 | 33.93 |
| CoCo (ours) | 55.79 | 49.33 | 19.02 | 19.83 | 42.67 | 40.09 |
| CoCo (ours) | 57.28 | 50.14 | 18.71 | 18.65 | 43.57 | 40.96 |
| CoCo (ours) | 58.84 | 52.25 | 24.08 | 22.70 | 42.04 | 39.03 |
| CoCo (ours) | 55.27 | 49.54 | 19.57 | 18.21 | 41.18 | 39.61 |
We report the Pearson correlation coefficient () and Spearman correlation coefficient () between various automatic evaluation metrics and human judgments on factual consistency in Table 2 (results are shown as percentages). The larger value represents the better positive correlation with human judgments, which demonstrates the effectiveness of the automatic evaluation metric on factual consistency for text summarization.
From the table, we can observe that the -gram based metrics, including ROUGE, METEOR, and BLEU, achieve the worse results on three datasets compared with most of other the baselines. These results are consistent with the observation in previous studies Bhandari et al. (2020); Maynez et al. (2020). Although convenient for adopting, -gram based metrics are poorly correlated with human judgments on factual consistency, since they only care about the lexical overlap between the generated summary and reference, but fail to capture the semantic similarity.
Compared to -gram based metrics, BERTScore could not achieve consistent improvements on three datasets (better on QAGS-CNN/DM but slightly worse on QAGS-XSUM and SUMMEVAL). And the comparisons between FFCI and its corresponding basic metric (e.g., FFCI v.s. BERTScore) show the advantages brought by calculating the lexical-overlap or semantic similarity between the generated summaries and the source document rather than the reference when measuring factual consistency. However, since FFCI adopts a sentence-level evaluation manner, the cost can be nearly times of other metrics when a document and a generated summary containing and sentences respectively.
On the other hand, QA-based metrics QAGS and QuestEval introduce auxiliary tasks, including question generation (QG) and question answering (QA), to evaluate factual consistency. Both of them achieve competitive results compared with other baselines. However, QA-based metrics highly rely on well-trained QA and QG models, which makes them inconvenient, or unavailable in languages without enough corpus for pretraining. Meanwhile, it is worth pointing out that these metrics are computationally expensive Koto et al. (2020), and easily lead to error propagation and accumulation because of their pipeline manner.
The proposed metric CoCo outperforms other baselines by a noticeable margin on three adopted datasets. For instance, the Pearson correlation coefficient between CoCo and human judgments on QAGS-CNN/DM is 58.84, which is significantly larger than those of the best result among baselines (49.18 for QuesEval), and is twice times of the best result among -gram based metrics (29.01 for ROUGE-1). These results demonstrate the effectiveness of CoCo in improving the correlation with human judgments. In the bottom subgroup of Table 2, we report the comparison results among different mask strategies applied in CoCo. From these results, we can see the span-level and sentence-level mask strategies are better than token-level and document-level, which implies that a suitable mask range for relevant content is important for measuring factual consistency. The too-small mask range could cause that the decoder is still able to infer the masked tokens from the context, while the too-large mask range might weaken the effect of language prior and lead to near-zero scores for all the tokens in the evaluated summary.
4.5 Further Discussions
In this section, we provide some discussions about the proposed CoCo metric to better understand how it works to measure the factual consistency of the model-generated summary.
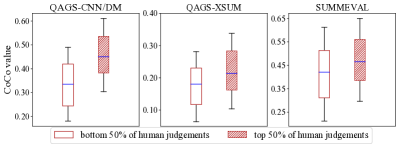
CoCo values w.r.t. various human judgments. For each adopted dataset, we split the instances into two halves according to the human judgments assigned to the model-generated summaries. Then we calculate the statistics of CoCo values for each half respectively and illustrate the results in Fig. 2. It can be observed that summaries with high human judgments (i.e., in the top 50%) are also assigned with high CoCo values, which demonstrates CoCo values are consistent with human judgments on factual consistency. Thus the proposed metric CoCo is a reliable automatic evaluation metric for factual consistency in text summarization.
Different scoring models. We adopt four different scoring models to implement CoCo, including BART, BERT Liu and Lapata (2019), T5 Raffel et al. (2020), and PEGASUS Zhang et al. (2020a) (denoted as PEGA). The experiment results are shown in Table 3, which demonstrate that among the four adopted scoring models, CoCo achieves consistent and competitive results against the performance of baselines reported in Table 2.
| Datasets | BART | BERT | T5 | PEGA |
|---|---|---|---|---|
| QAGS-CNN/DM | 58.84 | 53.27 | 56.13 | 58.96 |
| QAGS-XSUM | 24.08 | 17.88 | 21.66 | 19.83 |
| SUMMEVAL | 42.04 | 39.36 | 42.98 | 43.38 |
Case study. To better understand how CoCo works, a case study is illustrated in Table 4. We take three tokens American, Augusta, and Monday as examples and show the CoCo values. The tokens American is factually inconsistent w.r.t. the source document since there does not exist any context to infer Tiger Woods is an American in the source document. Augusta and Monday are factually consistent as they can be directly explained by the source document.
We can observe that both Augusta and Monday are assigned with a high CoCo value (0.4115 and 0.6346 respectively), while that of American is significant lower (0.0251). Such differences are caused by that both Augusta and Monday are generated more relied on the source document, but American is more likely to be hallucinated by the decoder, with the help of the language prior knowledge from the training corpus. The proposed metric CoCo can assign these hallucinations with low scores via counterfactual estimation to measure the factual consistency of the generated summary.
| Source document |
| Tiger Woods declared himself ready to compete for a fifth Masters title after completing 11 holes of practice at Augusta National on Monday. |
| Summary with CoCo values |
| The American(0.0251) completed 11 holes of practice at Augusta(0.4115) on Monday(0.6346). |
5 Conclusions
In this paper, we introduce CoCo, an effective and convenient metric for measuring the factual consistency of abstractive summarization models. Inspired by the intrinsic cause of factual inconsistency in text summarization, CoCo can evaluate factual consistency via counterfactual estimation without relying on other extrinsic tasks. Experiments on human-annotated datasets verify the advantages of our proposed metric in terms of the correlation with human judgments. In the future, several directions can be explored. First, although this paper focuses on evaluation metric, the proposed idea can be incorporated into abstractive summarization models to enhance factual consistency. Another interesting direction is to apply this metric in other conditional text generation tasks such as image caption and data-to-text generation.
References
- Bengio et al. (2015) Samy Bengio, Oriol Vinyals, Navdeep Jaitly, and Noam Shazeer. 2015. Scheduled sampling for sequence prediction with recurrent neural networks. In Proceedings of NIPS, page 1171–1179.
- Bhandari et al. (2020) Manik Bhandari, Pranav Narayan Gour, Atabak Ashfaq, and Pengfei Liu. 2020. Metrics also disagree in the low scoring range: Revisiting summarization evaluation metrics. In Proceedings of COLING, pages 5702–5711.
- Chen et al. (2018) Ping Chen, Fei Wu, Tong Wang, and Wei Ding. 2018. A semantic qa-based approach for text summarization evaluation. In Proceedings of AAAI, pages 4800–4807.
- Clarke and Lapata (2010) James Clarke and Mirella Lapata. 2010. Discourse constraints for document compression. CL, 36(3):411–441.
- Devlin et al. (2019) Jacob Devlin, Ming-Wei Chang, Kenton Lee, and Kristina Toutanova. 2019. BERT: Pre-training of deep bidirectional transformers for language understanding. In Proceedings of NAACL, pages 4171–4186.
- Durmus et al. (2020) Esin Durmus, He He, and Mona Diab. 2020. FEQA: A question answering evaluation framework for faithfulness assessment in abstractive summarization. In Proceedings of ACL, pages 5055–5070.
- Eyal et al. (2019) Matan Eyal, Tal Baumel, and Michael Elhadad. 2019. Question answering as an automatic evaluation metric for news article summarization. In Proceedings of NAACL, pages 3938–3948.
- Fabbri et al. (2021) Alexander R. Fabbri, Wojciech Kryściński, Bryan McCann, Caiming Xiong, Richard Socher, and Dragomir Radev. 2021. SummEval: Re-evaluating Summarization Evaluation. TACL, 9:391–409.
- Falke et al. (2019) Tobias Falke, Leonardo F. R. Ribeiro, Prasetya Ajie Utama, Ido Dagan, and Iryna Gurevych. 2019. Ranking generated summaries by correctness: An interesting but challenging application for natural language inference. In Proceedings of ACL, pages 2214–2220.
- Filippova (2020) Katja Filippova. 2020. Controlled hallucinations: Learning to generate faithfully from noisy data. In Findings of EMNLP, pages 864–870.
- Gehrmann et al. (2018) Sebastian Gehrmann, Yuntian Deng, and Alexander Rush. 2018. Bottom-up abstractive summarization. In Proceedings of EMNLP, pages 4098–4109.
- Goodrich et al. (2019) Ben Goodrich, Vinay Rao, Peter J. Liu, and Mohammad Saleh. 2019. Assessing the factual accuracy of generated text. In Proceedings of KDD, page 166–175.
- Hendricks et al. (2018) Lisa Anne Hendricks, Kaylee Burns, Kate Saenko, Trevor Darrell, and Anna Rohrbach. 2018. Women also snowboard: Overcoming bias in captioning models. In Proceedings of ECCV, pages 771–787.
- Hermann et al. (2015) Karl Moritz Hermann, Tomas Kocisky, Edward Grefenstette, Lasse Espeholt, Will Kay, Mustafa Suleyman, and Phil Blunsom. 2015. Teaching machines to read and comprehend. In Proceedings of NIPS, page 1693–1701.
- Koto et al. (2020) Fajri Koto, Jey Han Lau, and Timothy Baldwin. 2020. Ffci: A framework for interpretable automatic evaluation of summarization. arXiv preprint arXiv:2011.13662.
- Kryscinski et al. (2020) Wojciech Kryscinski, Bryan McCann, Caiming Xiong, and Richard Socher. 2020. Evaluating the factual consistency of abstractive text summarization. In Proceedings of EMNLP, pages 9332–9346.
- Lavie and Agarwal (2007) Alon Lavie and Abhaya Agarwal. 2007. Meteor: An automatic metric for mt evaluation with high levels of correlation with human judgments. In Proceedings of WMT | WS, pages 228–231.
- Lewis et al. (2020) Mike Lewis, Yinhan Liu, Naman Goyal, Marjan Ghazvininejad, Abdelrahman Mohamed, Omer Levy, Veselin Stoyanov, and Luke Zettlemoyer. 2020. BART: Denoising sequence-to-sequence pre-training for natural language generation, translation, and comprehension. In Proceedings of ACL, pages 7871–7880.
- Lin (2004) Chin-Yew Lin. 2004. Rouge: A package for automatic evaluation of summaries. In Text summarization branches out, pages 74–81.
- Liu and Lapata (2019) Yang Liu and Mirella Lapata. 2019. Text summarization with pretrained encoders. In Proceedings of EMNLP, pages 3730–3740.
- Mani et al. (1999) Inderjeet Mani, David House, Gary Klein, Lynette Hirschman, Therese Firmin, and Beth Sundheim. 1999. The TIPSTER SUMMAC text summarization evaluation. In Proceedings of EACL, pages 77–85.
- Maynez et al. (2020) Joshua Maynez, Shashi Narayan, Bernd Bohnet, and Ryan McDonald. 2020. On faithfulness and factuality in abstractive summarization. In Proceedings of ACL, pages 1906–1919.
- Miller et al. (2017) Alexander Miller, Will Feng, Dhruv Batra, Antoine Bordes, Adam Fisch, Jiasen Lu, Devi Parikh, and Jason Weston. 2017. ParlAI: A dialog research software platform. In Proceedings of EMNLP, pages 79–84.
- Mishra et al. (2021) Anshuman Mishra, Dhruvesh Patel, Aparna Vijayakumar, Xiang Lorraine Li, Pavan Kapanipathi, and Kartik Talamadupula. 2021. Looking beyond sentence-level natural language inference for question answering and text summarization. In Proceedings of NAACL-HLT 2021, pages 1322–1336.
- Nallapati et al. (2016) Ramesh Nallapati, Bowen Zhou, Cicero dos Santos, Çaǧlar Gulçehre, and Bing Xiang. 2016. Abstractive text summarization using sequence-to-sequence RNNs and beyond. In Proceedings of SIGNLL, pages 280–290.
- Narayan et al. (2018) Shashi Narayan, Shay B. Cohen, and Mirella Lapata. 2018. Don’t give me the details, just the summary! topic-aware convolutional neural networks for extreme summarization. In Proceedings of EMNLP, pages 1797–1807.
- Niu et al. (2020) Yulei Niu, Kaihua Tang, Hanwang Zhang, Zhiwu Lu, Xian-Sheng Hua, and Ji-Rong Wen. 2020. Counterfactual vqa: A cause-effect look at language bias. arXiv preprint arXiv:2006.04315.
- Ott et al. (2019) Myle Ott, Sergey Edunov, Alexei Baevski, Angela Fan, Sam Gross, Nathan Ng, David Grangier, and Michael Auli. 2019. fairseq: A fast, extensible toolkit for sequence modeling. In Proceedings of NAACL-HLT 2019: Demonstrations, pages 48–53.
- Papineni et al. (2002) Kishore Papineni, Salim Roukos, Todd Ward, and Wei-Jing Zhu. 2002. Bleu: A method for automatic evaluation of machine translation. In Proceedings of ACL, page 311–318.
- Paszke et al. (2019) Adam Paszke, Sam Gross, Francisco Massa, Adam Lerer, James Bradbury, Gregory Chanan, Trevor Killeen, Zeming Lin, Natalia Gimelshein, Luca Antiga, Alban Desmaison, Andreas Kopf, Edward Yang, Zachary DeVito, Martin Raison, Alykhan Tejani, Sasank Chilamkurthy, Benoit Steiner, Lu Fang, Junjie Bai, and Soumith Chintala. 2019. Pytorch: An imperative style, high-performance deep learning library. In Proceedings of NIPS, volume 32.
- Pearl (2001) Judea Pearl. 2001. Direct and indirect effects. In Proceedings of UAI, page 411–420.
- Pearl and Mackenzie (2018) Judea Pearl and Dana Mackenzie. 2018. The book of why: the new science of cause and effect.
- Raffel et al. (2020) Colin Raffel, Noam Shazeer, Adam Roberts, Katherine Lee, Sharan Narang, Michael Matena, Yanqi Zhou, Wei Li, and Peter J. Liu. 2020. Exploring the limits of transfer learning with a unified text-to-text transformer. JMLR, 21(140):1–67.
- Scialom et al. (2021) Thomas Scialom, Paul-Alexis Dray, Patrick Gallinari, Sylvain Lamprier, Benjamin Piwowarski, Jacopo Staiano, and Alex Wang. 2021. Questeval: Summarization asks for fact-based evaluation. arXiv preprint arXiv:2103.12693.
- Scialom et al. (2019) Thomas Scialom, Sylvain Lamprier, Benjamin Piwowarski, and Jacopo Staiano. 2019. Answers unite! unsupervised metrics for reinforced summarization models. In Proceedings of EMNLP, pages 3246–3256.
- See et al. (2017) Abigail See, Peter J. Liu, and Christopher D. Manning. 2017. Get to the point: Summarization with pointer-generator networks. In Proceedings of ACL, pages 1073–1083.
- Wang et al. (2020) Alex Wang, Kyunghyun Cho, and Mike Lewis. 2020. Asking and answering questions to evaluate the factual consistency of summaries. In Proceedings of ACL, pages 5008–5020.
- Wolf et al. (2020) Thomas Wolf, Lysandre Debut, Victor Sanh, Julien Chaumond, Clement Delangue, Anthony Moi, Pierric Cistac, Tim Rault, Rémi Louf, Morgan Funtowicz, Joe Davison, Sam Shleifer, Patrick von Platen, Clara Ma, Yacine Jernite, Julien Plu, Canwen Xu, Teven Le Scao, Sylvain Gugger, Mariama Drame, Quentin Lhoest, and Alexander M. Rush. 2020. Transformers: State-of-the-art natural language processing. In Proceedings of EMNLP, pages 38–45.
- Xiao and Wang (2021) Yijun Xiao and William Yang Wang. 2021. On hallucination and predictive uncertainty in conditional language generation. arXiv preprint arXiv:2103.15025.
- Xu et al. (2020) Jiacheng Xu, Shrey Desai, and Greg Durrett. 2020. Understanding neural abstractive summarization models via uncertainty. In Proceedings of EMNLP, pages 6275–6281.
- Yao et al. (2021) Liuyi Yao, Zhixuan Chu, Sheng Li, Yaliang Li, Jing Gao, and Aidong Zhang. 2021. A survey on causal inference. ACM Transactions on Knowledge Discovery from Data, 15(5).
- Zhang et al. (2020a) Jingqing Zhang, Yao Zhao, Mohammad Saleh, and Peter Liu. 2020a. Pegasus: Pre-training with extracted gap-sentences for abstractive summarization. In Proceedings of ICML, pages 11328–11339.
- Zhang et al. (2020b) Tianyi Zhang, Varsha Kishore, Felix Wu, Kilian Q. Weinberger, and Yoav Artzi. 2020b. Bertscore: Evaluating text generation with bert. In Proceedings of ICLR.
- Zhang et al. (2020c) Yuhao Zhang, Derek Merck, Emily Tsai, Christopher D. Manning, and Curtis Langlotz. 2020c. Optimizing the factual correctness of a summary: A study of summarizing radiology reports. In Proceedings of ACL, pages 5108–5120.
Appendix A Implementation Details
We introduce the implementation details of baselines for reproduction, including:
N-gram based metrics. We adopt the widely-used open source packages to implement the n-gram based metrics, including ROUGE333https://github.com/andersjo/pyrouge, BLEU444https://pypi.org/project/bleu/ and METEOR555https://github.com/salaniz/pycocoevalcap. And we use the CoreNLP666https://github.com/stanfordnlp/CoreNLP as the tokenizer.
BERTScore. It is implemented based on the source code released by Zhang et al. (2020b)777https://github.com/Tiiiger/bert_score. Following the original paper, we use the outputs from the -th layer in roberta-large. We also try to use bert-large-nli suggested by Koto et al. (2020), but it fails to perform better in the experiments.
FFCI. FFCI Koto et al. (2020) is a framework that can be implemented by different basic metrics. The adopted basic metrics in our study including ROUGE-1, ROUGE-2, ROUGE-L, and BERTScore, whose implementation details have been introduced above. The hyperparameters are set as the paper suggested.
QAGS. Following the settings in Wang et al. (2020), the question generation (QG) model and question answering (QA) model in QAGS are implemented based on BART and BERT respectively using the source code provided by fairseq Ott et al. (2019). For each summary, we extract 10 named entities via spaCy888https://spacy.io/, and generate totally 100 questions based on these named entities using QG model, from which 20 questions with high generated probabilities are selected. These questions are fed into a QA model, together with the corresponding source documents or the summaries, to generate answers for comparisons.
Appendix B Dataset Availability
QAGS-CNN/DM & QAGS-XSUM. They are released by Wang et al. (2020)999https://github.com/W4ngatang/qags/tree/master/data, and annotated on Amazon Mechanical Turk3101010https://www.mturk.com/ via ParlAI Miller et al. (2017). Please refer to the original paper for more details about the annotation protocol.
SUMMEVAL. It is released by Fabbri et al. (2021)111111https://github.com/Yale-LILY/SummEval. The expert annotations are adopted in our study as the paper suggested. For each source document in this dataset, there exists one original reference from CNN/DailyMail dataset and 10 additional crowdsources reference summaries. We only use the original reference in our study.