Melting phase diagram of bubble phases in high Landau levels
Abstract
A low-disorder, two-dimensional electron system (2DES) subjected to a large perpendicular magnetic field and cooled to very low temperatures provides a rich platform for studies of many-body quantum phases. The magnetic field quenches the electrons’ kinetic energy and quantizes the energy into a set of Landau levels, allowing the Coulomb interaction to dominate. In excited Landau levels, the fine interplay between short- and long-range interactions stabilizes bubble phases, Wigner crystals with more than one electron per unit cell. Here we present the screening properties of bubble phases, probed via a simple capacitance technique where the 2DES is placed between a top and a bottom gate and the electric field penetrating through the 2DES is measured. The bubbles formed at very low temperatures screen the electric field poorly as they are pinned by the residual disorder potential, allowing a large electric field to reach the top gate. As the temperature is increased, the penetrating electric field decreases and, surprisingly, exhibits a pronounced minimum at a temperature that appears to coincide with the melting temperature of the bubble phase. We deduce a quantitative phase diagram for the transition from bubble to liquid phases for Landau level filling factors .
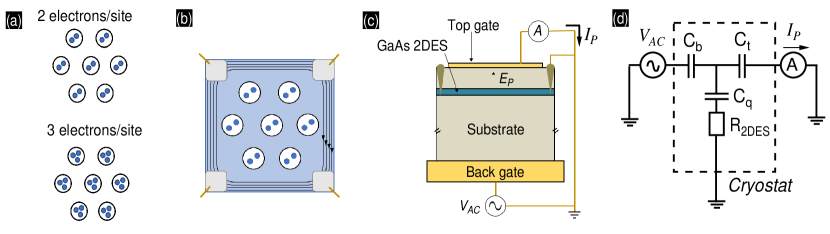
Two-dimensional electron systems (2DESs) in a perpendicular magnetic field reveal a fascinating set of many-body quantum phases [1, 2, 3]. In the lowest orbital Landau level (LL), there is a plethora of fractional quantum Hall states. In excited LLs, however, the nodes in the wavefunction lead to a weakened short-range interaction and a preferred long-range order, manifested by the formation of charge-density-wave and stripe/nematic phases [4, 5, 6, 8, 7, 9]. Consistent with this expectation, magnetotransport data for very low disorder 2DESs at very low temperatures have revealed anisotropic phases at half-filled, high-index LLs [10, 11] which are interpreted as stripe (or nematic) phases. Moreover, away from exact half-fillings, e.g., at LL filling factors and , there are unusual phases with a vanishing longitudinal resistance and a Hall resistance that is quantized at a value corresponding to the nearest integer quantum Hall state (IQHS), namely, at and , respectively ( is an integer ) [12, 13, 14, 15]. These are believed to be bubble phases, Wigner crystal states with more than one electron per unit cell, as shown in Fig. 1(a). Because they are pinned by the small but ubiquitous disorder, they are insulating but phenomenologically appear as reentrant IQHSs (RIQHSs). Even though the bulk of the 2DES is insulating, the longitudinal resistance vanishes because of the conducting edge states of the underlying LLs (see Fig. 1(b)). Besides magnetotransport, numerous other experimental techniques have been employed to study the bubble phases; these include measurements of non-linear - [12, 16, 17], microwave resonance [18, 19], and surface acoustic waves [20, 21]. The results of all these measurements are consistent with the presence of bubble phases.
Here we present experimental data, probing the bubble phases and their melting into a liquid state, using a technique that measures their screening efficiency. As highlighted in Fig. 1(c), this is a simple capacitance technique [24, 25, 22, 23] where the application of an AC voltage between the top and back gates induces an electric field that penetrates through the 2DES. The magnitude of depends on the screening efficiency of the 2DES bulk, and the size of the penetrating current is then probed in response to . At the lowest temperatures, we find that the pinned bubble phases screen the electric field between the gates poorly and a large is observed. With increasing temperature, the screening efficiency of the 2DES improves and drops, as expected. However, shows a distinct minimum at a temperature that corresponds to the melting temperature of the bubble phases. This observation suggests that the bubble phases becomes particularly efficient at screening near their melting. We use the data to construct a bubble-liquid melting phase diagram as a function of filling factor.
We studied a 2DES confined to a 30-nm-wide modulation-doped GaAs quantum well grown on a GaAs (001) substrate. The Si dopant atoms were placed in doping wells [26], leading to a very high-quality 2DES. The sample has density n cm-2 and a low-temperature mobility cm2/Vs. We measured a mm mm van der Pauw geometry sample with alloyed (InSn) electrical contacts at the corners. The device is mounted on a header using In that serves as a back gate, and on top has a deposited, semi-transparent, 15-nm-thick Al film, top gate. We illuminated our sample before the measurements [27]. We used lock-in techniques for magnetoresistance ( Hz) and capacitance measurements. For the latter, the frequency (f) range was Hz f Hz. The sample and a calibrated, RuO thermometer next to it were placed on the cold finger of a dry dilution refrigerator.
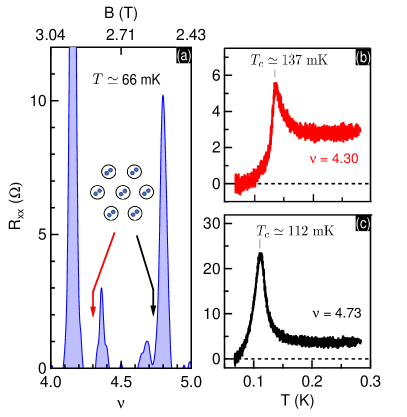
Figure 2(a) provides magnetoresistance data as a function of at the temperature T mK. Near and (marked by arrows), the longitudinal resistance () has vanishing values and the Hall trace is quantized to the resistance value of the nearest IQHS, signaling a RIQHS behavior [10, 11, 12, 18, 14, 16, 13]. See the Supplementary Material SM [28] for and traces. These characteristics have been associated with disorder-pinned bubble phases, which are observed in the highest-quality 2DESs. Pinned bubble phases have vanishingly small conductivity, but in transport measurements, the insulating behavior is shunted by the underlying edge currents of the filled LLs (see, e.g., Fig. 1(b)). We will return to the temperature dependence of the shown in Figs. 2(b,c) later in the manuscript.
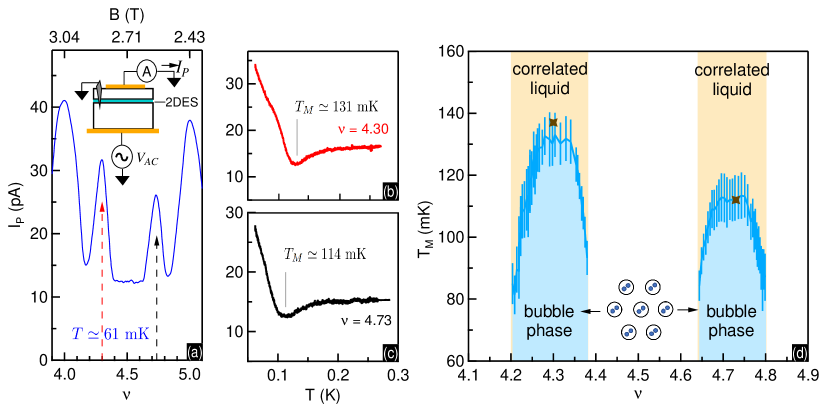
By probing the screening efficiency of the 2DES, we derive information regarding its bulk . Figure 3(a) shows the sample’s screening efficiency for ranging from 4 to 5, at mK [33]. At the and IQHSs, is a maximum, indicating minimal screening, i.e., an insulating bulk as the quasiparticles are localized by the disorder potential. As increases from , decreases and reaches a minimum at , hinting at the delocalization of quasiparticles that are able to screen better the penetrating electric field. For larger , rises and peaks at ; the local maximum in coincides with the bubble phase region in transport experiments, namely the vanishing of (see Fig. 2(a)). In pinned electron solids, the electrons are fixed to their positions and are unable to screen effectively the penetrating electric field, thus leading to signatures of minimal screening (maximal ) [22, 23], as seen in Fig. 3(a) at . When starts at 5 and decreases, follows a similar trend, reaching a local maximum at .
In between the bubble phases (), is minimal. This range of coincides with the region where anisotropic stripe/nematic phases are detected in magnetotransport [4, 5, 6, 10, 11, 9] (see Fig. 2(a)). Stripe/nematic phases are unidirectional charge density waves that are highly conductive along the stripe/nematic direction at finite temperatures, thus an impinging electric field should be screened, in agreement with the local wide minimum seen in Fig. 3(a). Note that we observe the same signatures of pinned bubble and stripe/nematic phases in at higher LLs, up to [28].
By measuring at fixed as the temperature is raised, we capture the screening behavior of the bubble phases as they melt. Figures 3(b,c) show vs. T for and . At the lowest temperatures, has large values consistent with pinned bubble phases. At high temperatures, saturates at a value that is lower than its maximum low-temperature value, consistent with a melted state, i.e., a liquid phase that has a higher screening efficiency than the pinned bubble phase. One would expect that as the bubbles melt, would change monotonically between these two limits as the electrons become unpinned with increasing temperature. Surprisingly, however, in between these two limits, reaches a local minimum at temperature , implying maximal screening at this temperature [34].
We attempt to understand qualitatively the non-monotonic response with a lumped-element circuit model as shown in Fig. 1(d) [35]. The 2DES is characterized by its quantum capacitance () and bulk resistance (). Since values of the top and bottom capacitances ( and ) are fixed, changes in are a direct consequence of variations in the 2DES impedance . The local minimum in , at , implies a dip in , which could mean that decreases, or increases, or both.
We associate with the melting temperature of the bubble phases based on the following considerations. First, a qualitatively similar behavior in vs. traces was recently seen when studying the screening properties of the Wigner crystal at very small (lowest LL) in low-density GaAs 2D electron and hole systems [22, 23]. Associating the temperature for maximum screening with the melting temperature of Wigner crystal, Ref. [22] found the measured dependence of this temperature on to be consistent with the melting phase diagrams reported previously for the Wigner crystal in GaAs 2DESs [36, 37, 38, 39]. Second, theories for the melting of a 2D solid [40, 41, 43, 42] predict a divergence in the compressibility near the melting temperature. The compressibility is proportional to in Fig. 1(d), and the 2DES screening ability is directly related to . A large compressibility would lead to increased screening. We surmise that the maximal screening at our measured might be related to an increase in as the bubble phase melts.
A natural question that arises is whether the non-monotonic behavior of and the value of are intrinsic to the 2DES and not an artifact of our measurement circuitry. As discussed in the SM [28] we tested this by measuring for frequencies ranging from to Hz. The non-monotonic behavior and the value of are frequency independent over this range.
Associating TM with the melting temperature, a plot of our measured TM vs. , as shown in Fig. 3(d), provides the bubbles’ thermal melting phase diagram. The light-blue and yellow regions represent the bubble phases and correlated liquids, respectively. The error bars give an estimate of the uncertainty in determining the temperature of the local minimum in vs. traces. The left-side bubble-liquid boundary has a relatively broad maximum around , and on its flanks decreases quickly reaching values as low as mK at and . The right-side bubble-liquid boundary also has a broad maximum near and, away from this maximum, falls rapidly to mK at and . Note that mK is our reliable lower temperature limit for detecting a minimum in . The range of the left-side bubble to liquid boundary in Fig. 3(d) falls within the available theoretical calculations for the bubble phase stability. Density-matrix-renormalization-group [8] and Hartree-Fock [44, 45] calculations predict and , respectively, for the window where the bubbles are stable. In the simplest scenario the regions around and should be particle-hole symmetric.
The melting of bubble phases has also been studied in transport measurements. Deng et al. [15, 14] performed resistance measurements in a 2DES of very similar density and mobility to our sample. They showed that in the bubble phases’ regime there is a sharp transition in as the temperature decreases. At high temperatures, has the classical Hall resistance value, and as the temperature decreases it quickly transitions to the resistance value of the nearest IQHS. Such a sharp transition was used to define the critical temperature () for the formation/melting of bubble phases. The longitudinal resistance that accompanies the sharp transition in , has a non monotonic behavior and it peaks at the same . The measured in the temperature dependence can therefore be also used to pinpoint the formation/melting of bubble phases. Based on their measured , Deng et al. [15] constructed thermal melting phase diagrams for bubble phases between . Their deduced diagrams also exhibit a dome-shaped boundary, similar to those seen in Fig. 3(d).
It is instructive to compare our results for with the temperature dependence of our data. Figures 2(b,c) feature vs. T for and . At the lowest temperatures is very close to zero, which is a manifestation of pinned bubble phases: the divergent bulk resistance is shunted by the underlying edge currents of the filled LLs. For T mK, where the bubble phases have melted and the system is composed of unpinned quasiparticles, reaches a non-zero saturation value. The resistance reaches a maximum at an intermediate temperature similar to what has been reported previously in Refs. [15, 14, 46, 47], as summarized in the preceding paragraph. In our measurements, we find that is indeed very close to deduced from screening efficiency data (see Figs. 3(b,c)). This can be best seen in the phase diagram in Fig. 3(d) where we have added our measured as brown crosses. Note that our measured values coincide (to within ) with those reported by Deng et al. [14].
Further contrasting of our data can be done with microwave resonance results from a very similar GaAs 2DES, again with comparable density and mobility to ours [18, 19]. At 50 mK, Lewis et al. [18] found resonances in the ranges and , providing support to the picture of pinned bubble phases. These filling factor ranges overlap with those where we see bubble phases in our experiments (Fig. 3(d)). Reference [18] also reported that the resonances are strongest at low temperatures and disappear when the temperature exceeds mK. This is somewhat smaller than our measured mK. Given our measured and values, it appears that the melting temperatures derived from screening and transport measurements are slightly larger than those from microwave resonances.
In summary, we report the first screening efficiency measurements of pinned bubble phases in excited LLs. As the bubble phases melt, a minimum in at temperature is found, signaling maximal screening. We associate with the bubble phase melting temperature and construct a melting phase diagram for the bubbles near and . We would like to highlight that the higher screening at an intermediate temperature appears to be a ubiquitous phenomenon for the melting of magnetic-field-induced electron solids formed in 2D systems, be it in the lowest [22, 23] or the excited LLs, thus it begs a rigorous theoretical explanation.
Acknowledgements.
We acknowledge support by the National Science Foundation (NSF) Grant DMR 2104771 for measurements. For sample synthesis and characterization, we acknowledge support by NSF Grants ECCS 1906253 and MRSEC DMR 1420541, and the Gordon and Betty Moore Foundation’s EPiQS Initiative (Grant No. GBMF9615 to L.N.P.). We thank David Huse for illuminating discussions.References
- [1] Perspective in Quantum Hall Effects: Novel Quantum Liquids in Low-Dimensional Semiconductor Structures, eds. S. Das Sarma and A. Pinczuk (Wiley, New York, 1997).
- [2] J. K. Jain, Composite Fermions (Cambridge University Press, Cambridge, 2007).
- [3] Fractional Quantum Hall Effects: New Developments, eds. B. I. Halperin and J. K. Jain (World Scientific, Singapore, 2020).
- [4] M. M. Fogler, A. A. Koulakov, and B. I. Shklovskii, Ground state of a two-dimensional electron liquid in a weak magnetic field, Phys. Rev. B 54, 1853 (1996).
- [5] A. A. Koulakov, M. M. Fogler, and B. I. Shklovskii, Charge Density Wave in Two-Dimensional Electron Liquid in Weak Magnetic Field, Phys. Rev. Lett 76, 499 (1996).
- [6] R. Moessner and J. T. Chalker, Exact results for interacting electrons in high Landau levels, Phys. Rev. B 54, 5006 (1996).
- [7] F. D. M. Haldane, E. H. Rezayi, and K. Yang, Spontaneous Breakdown of Translational Symmetry in Quantum Hall Systems: Crystalline Order in High Landau Levels, Phys. Rev. Lett 85, 5396 (2000).
- [8] N. Shibata and D. Yoshioka, Ground-State Phase Diagram of 2D Electrons in a High Landau Level: A Density Matrix Renormalization Group Study, Phys. Rev. Lett. 86, 5755 (2001).
- [9] E. Fradkin and S. A. Kivelson, Liquid-crystal phases of quantum Hall systems, Phys. Rev. B 59, 8065 (1999).
- [10] M. P. Lilly, K. B. Cooper, J. P. Eisenstein, L. N. Pfeiffer, and K. W. West, Evidence for an Anisotropic State of Two-Dimensional Electrons in High Landau Levels, Phys. Rev. Lett 82, 394 (1999).
- [11] R. R. Du, D. C. Tsui, H. L. Stormer, L. N. Pfeiffer, K. W. Baldwin, and K. W. West, Strongly anisotropic transport in higher two-dimensional Landau levels, Solid State Communications 109, 389 (1999).
- [12] K. B. Cooper, M. P. Lilly, J. P. Eisenstein, L. N. Pfeiffer, and K. W. West, Insulating phases of two-dimensional electrons in high Landau levels: Observation of sharp thresholds to conduction. Phys. Rev. B 60, R11285 (1999).
- [13] J. P. Eisenstein, K. B. Cooper, L. N. Pfeiffer, and K. W. West, Insulating and Fractional Quantum Hall States in the First Excited Landau level, Phys. Rev. Lett. 88, 076801 (2002).
- [14] N. Deng, J. D. Watson, L. P. Rokhinson, M. J. Manfra, and G. A. Csathy, Contrasting energy scales of reentrant integer quantum Hall states, Phys. Rev. B 86, 201301 (2012).
- [15] N. Deng, A. Kumar, M. J. Manfra, L. N. Pfeiffer, K. W. West, and G. A. Csathy, Collective Nature of the REentrant Integer Quantum Hall States in the Second Landau Level, Phys. Rev. Lett. 108, 086803 (2012).
- [16] X. Wang, H. Fu, L. Du, X. Liu, P. Wang, L. N. Pfeiffer, K. W. West, R.-R. Du, and X. Lin, Depinning transition of bubble phases in a high Landau level, Phys. Rev. B 91, 115301 (2015).
- [17] K. Bennaceur, C. Lupien, B. Reulet, G. Gervais, L. Pfeiffer, and K. West, Competing Charge Density Waves Probed by Nonlinear Transport and Noise in the Second and Third Landau Levels, Phys. Rev. Lett. 120, 136801 (2018).
- [18] R. M. Lewis, P. D. Ye, L. W. Engel, D. C. Tsui, L. N. Pfeiffer, and K. W. West, Microwave Resonance of the Bubble Phases in and Filled High Landau levels, Phys. Rev. Lett. 89, 136804 (2002).
- [19] R. M. Lewis, Y. Chen, L. W. Engel, D. C. Tsui, P. D. Ye, L. N. Pfeiffer, and K. W. West, Evidence of a First-Order Phase Transition Between Wigner-Crystal and Bubble Phases of 2D Electrons in Higher Landau levels, Phys. Rev. Lett. 93, 176808 (2004).
- [20] B. Friess, Y. Peng, B. Rosenow, F. von Oppen, V. Umansky, K. von Klitzing, and J. H. Smet, Negative permitivity in bubble and stripe phases, Nature Physics 13,1124 (2017).
- [21] B. Friess, V. Umansky, K. von Klitzing, and J. Smet, Current Flow in the Bubble and Stripe Phases, Phys. Rev. Lett. 120, 137603 (2018).
- [22] H. Deng, L. N. Pfeiffer, K. W. West, K. W. Baldwin, L. Engel, and M. Shayegan, Probing the Melting of a Two-Dimensional Quantum Wigner Crystal via its Screening Efficiency, Phys. Rev. Lett. 122, 116601 (2019).
- [23] M. K. Ma, K. A. Villegas Rosales, H. Deng, Y. Chung, L. N. Pfeiffer, K. W. West, K. Baldwin, R. Winkler, and M. Shayegan, Thermal and Quantum Melting Phase Diagrams for a Magnetic-Field-Induced Wigner Solid, Phys. Rev. Lett. 125, 036601 (2020).
- [24] J. P. Eisenstein, L. N. Pfeiffer, and K. W. West, Negative compressibility of interacting two-dimensional electron and quasiparticle gases, Phys. Rev. Lett. 68, 674 (1992).
- [25] J. P. Eisenstein, L. N. Pfeiffer, and K. W. West, Compressibility of the two-dimensional electron gas: Measurements of the zero-field exchange energy and fractional quantum Hall gap, Phys. Rev. B 50, 1760 (1994).
- [26] Y. J. Chung, K. A. Villegas Rosales, K. W. Baldwin, K. W. West, M. Shayegan, and L. N. Pfeiffer, Working principles of doping-well structures for high-mobility two-dimensional electron systems, Phys. Rev. Materials 4, 044003 (2020).
- [27] At 15 K, we shine light with a red-LED (next to the sample) for 30 minutes, and then proceed to mK temperatures.
- [28] See Supplemental Material, which includes Ref. [14,29-32], for additional magnetoresistance and screening efficiency data.
- [29] T. Sajoto, Y. P. Li, L. W. Engel, D. C. Tsui, and M. Shayegan, Hall resistance of the reentrant insulating phase around the 1/5 fractional quantum Hall liquid, Phys. Rev. Lett. 70, 2321 (1993).
- [30] V. J. Goldman, J. K. Wang, B. Su, and M. Shayegan, Universality of the Hall Effect in a Magnetic-Field-Localized Two-Dimensional Electron System, Phys. Rev. Lett. 70, 647 (1993).
- [31] Y. J. Chung, K. A. Villegas Rosales, K. W. Baldwin, P. T. Madathil, K. W. West, M. Shayegan, and L. N. Pfeiffer, Ultra-high-quality two-dimensional electron systems, Nat. Mat. 20, 632 (2021).
- [32] S. Luryi, Quantum capacitance devices, Appl. Phys. Lett. 52, 501 (1988).
- [33] The reported , which serves as a proxy for the screening efficiency, comes after calibrating the signal to remove the impact of parasitic capacitances. It is the out-of-phase (capacitive) component of the penetrating current.
- [34] In the SM we report vs. at different fixed temperatures, also displaying the melting of bubble phases [28].
- [35] Note that the parasitic capacitances and resistances (of, e.g., wires and contacts) have not been included.
- [36] V. J. Goldman, M. Santos, M. Shayegan, and J. E. Cunningham, Evidence for Two-Dimensional Quantum Wigner Crystal, Phys. Rev. Lett. 65, 2189 (1990).
- [37] F. I. B. Williams, P. A. Wright, R. G. Clark, E. Y. Andrei, G. Deville, D. C. Glattli, O. Probst, B. Etienne, C. Dorin, C. T. Foxon, and J. J. Harris, Conduction Threshold and Pinning Frequency of Magnetically Induced Wigner Solid, Phys. Rev. Lett. 66, 3285 (1991).
- [38] M. A. Paalanen, R. L. Willett, R. R. Ruel, P. B. Littlewood, K. W. West, and L. N. Pfeiffer, Electrical conductivity and Wigner crystallization, Phys. Rev. B 45, 13784 (1992).
- [39] Y. P. Chen, G. Sambandamurthy, Z. Wang, R. Lewis, L. Engel, D. Tsui, P. Ye, L. Pfeiffer, and K. West, Melting of a 2D quantum electron solid in high magnetic field, Nat. PhyS. 2, 452 (2006).
- [40] J. M. Kosterlitz and D. J. Thouless, Ordering, metastability and phase transitions in two-dimensional systems, J. Phys. C: Solid State Phys. 6, 1181 (1973).
- [41] B. Halperin and D. Nelson, Theory of Two-Dimensional Melting, Phys. Rev. Lett. 41, 121 (1978).
- [42] A. P. Young, Melting and the vector Coulomb gas in two dimensions, Phys. Rev. B 19, 1855 (1979).
- [43] D. Nelson and B. Halperin, Dislocation-mediated melting in two-dimensions, Phys. Rev. B 19, 2457 (1979).
- [44] R. Côté, C. B. Doiron, J. Bourassa, and H. A. Fertig, Dynamics of electrons in quantum Hall bubble phases, Phys. Rev. B 68, 155327 (2003).
- [45] M. O. Goerbig, P. Lederer, and C. M. Smith, Competition between quantum-liquid and electron-solid phases in intermediate Landau levels, Phys. Rev. B 69, 115327 (2004).
- [46] D. Ro, N. Deng, J. D. Watson, M. J. Manfra, L. N. Pfeiffer, K. W. West, and G. A. Csathy, Electron bubbles and the structure of the orbital wave function, Phys. Rev. B 99, 201111(R) (2019).
- [47] D. Ro, S. A. Myers, N. Deng, J. D. Watson, M. J. Manfra, L. N. Pfeiffer, K. W. West, and G. A. Csáthy, Stability of multielectron bubbles in high Landau levels, Phys. Rev. B 102, 115303 (2020).