A Local Universe Host for the Repeating Fast Radio Burst FRB 20181030A
Abstract
We report on the host association of FRB 20181030A, a repeating fast radio burst (FRB) with a low dispersion measure (DM, 103.5 pc cm-3) discovered by CHIME/FRB Collaboration et al. (2019a). Using baseband voltage data saved for its repeat bursts, we localize the FRB to a sky area of 5.3 sq. arcmin (90% confidence). Within the FRB localization region, we identify NGC 3252 as the most promising host, with an estimated chance coincidence probability . Moreover, we do not find any other galaxy with M AB mag within the localization region to the maximum estimated FRB redshift of 0.05. This rules out a dwarf host 5 times less luminous than any FRB host discovered to date. NGC 3252 is a star-forming spiral galaxy, and at a distance of 20 Mpc, it is one of the closest FRB hosts discovered thus far. From our archival radio data search, we estimate a 3 upper limit on the luminosity of a persistent compact radio source (source size 0.3 kpc at 20 Mpc) at 3 GHz to be , at least 1500 times smaller than that of the FRB 20121102A persistent radio source. We also argue that a population of young millisecond magnetars alone cannot explain the observed volumetric rate of repeating FRBs. Finally, FRB 20181030A is a promising source for constraining FRB emission models due to its proximity, and we strongly encourage its multi-wavelength follow-up.
1 introduction
Fast radio bursts (FRBs) are enigmatic radio pulses of high brightness temperature ( 1035 K) and millisecond duration (Lorimer et al., 2007; Thornton et al., 2013). In spite of the fact that more than 500 FRBs have been discovered to date111For a complete list of known FRBs, see https://www.herta-experiment.org/frbstats/ or the TNS (Yaron et al., 2020)., their nature continues to be a subject of intense debate, owing in part to a limited sample of localized FRBs. Furthermore, the FRBs exhibit a diverse range of phenomenology: most of the discovered sources are apparently non-repeating, but a small fraction are observed to repeat. Among the repeating FRBs, two thus far have shown evidence of periodic repetitions (CHIME/FRB Collaboration et al., 2020a; Rajwade et al., 2020; Cruces et al., 2020). As a result, a plethora of theories has been proposed to explain the FRB sources’ disparate behavior (see Platts et al., 2018, for a catalog of proposed models).
To unveil the nature of FRB sources, detailed studies of FRB hosts and their local environments are a promising way forward (Nicholl et al., 2017a; Li & Zhang, 2020). Currently, only 15 published FRBs have been sufficiently well localized on the sky to allow their host galaxies to be identified.222See http://frbhosts.org/ (visited on 01/07/2021); Heintz et al. (2020). All localized FRBs except FRB 20200120E in M81 (Bhardwaj et al., 2021) are located at redshifts ranging from 0.03 to 0.66 where the detailed study of the FRB local environment is limited by the sensitivity of current telescopes. Additionally, FRBs so far are only observed at radio wavelengths with no convincing afterglow emission reported to date. However, X-ray emission contemporaneous with FRB-like radio bursts were detected from SGR 1935+2154, which suggests that at least some FRBs could have prompt X-ray counterparts (CHIME/FRB Collaboration et al., 2020b; Bochenek et al., 2020; Mereghetti et al., 2020; Li et al., 2020; Ridnaia et al., 2020). Such X-ray emission currently can only be detected for nearby FRBs ( 50 Mpc; Scholz et al., 2020).
Recently, Bhardwaj et al. (2021) reported the discovery of an FRB with the lowest DM observed to date, FRB 20200120E, located toward the outskirts of the nearby spiral galaxy M81. Using the European Very-long-baseline interferometry Network (EVN), Kirsten et al. (2021) localized the FRB with sub-arcsecond precision to an M81 globular cluster. At a distance of 3.6 Mpc, FRB 20200120E is an excellent candidate for multi-wavelength observations that could strongly constrain the nature of the FRB progenitor.
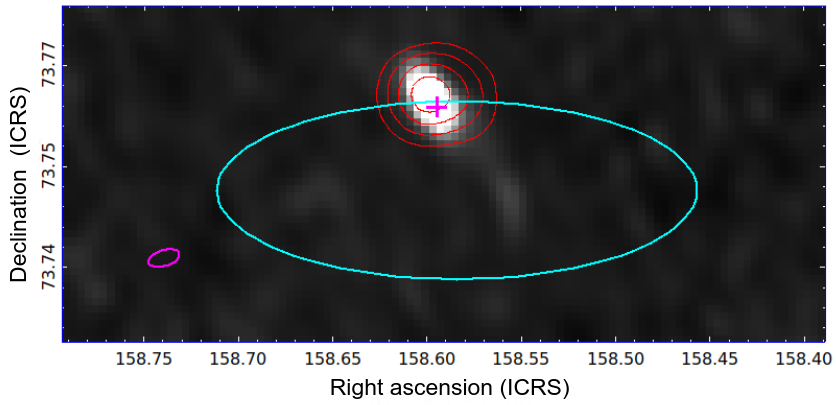
Here we report the identification of the most likely host for FRB 20181030A333Formerly named as FRB181030.J1054+73., a repeating FRB first reported by CHIME/FRB Collaboration et al. (2019a). Though its DM is only 103.5 pc cm-3, this is significantly larger than the expected contribution in this direction from the Milky Way disk ( 3341 pc cm-3). CHIME/FRB Collaboration et al. (2019a) did not find any Galactic ionized and/or star-forming region in the direction of FRB 20181030A. As a result, they concluded that the FRB should have a nearby extragalactic host. However, due to insufficiently precise localization of the FRB reported by CHIME/FRB Collaboration et al. (2019a), they could not make any firm association with a host. Since that report, CHIME/FRB has detected seven more bursts from the FRB (see Table 1).444For a complete list, check http://chime-frb.ca/repeaters/FRB20181030A (visited on 1/07/2021). For several of the FRB repeat bursts, raw voltage data were acquired, enabling localization of the FRB to a few arcminute precision, an improvement of over a factor of 200 in localization area. Within this localization region, we identify a local Universe spiral galaxy, NGC 3252 (Huchra et al., 1983), as its most likely host.
The paper is organized as follows: In §2, we describe our search for the host of FRB20181030A. From the low chance coincidence probability (§2.1) and absence of any other viable host candidates in the FRB localization region (§2.2), we argue that NGC 3252 is a promising host for the FRB. We estimate notable physical properties of NGC 3252 in §2.4 and then discuss our archival multi-wavelength data search to identify any FRB plausible counterpart in §2.5. In §3, we discuss implications of this discovery, and conclude in §4.
2 Observations
The Canadian Hydrogen Intensity Mapping Experiment Fast Radio Burst Project (CHIME/FRB) (CHIME/FRB Collaboration et al., 2018) first discovered two bursts from FRB 20181030A on 2018 October 30 (CHIME/FRB Collaboration et al., 2019a). The source’s DM is larger than the predicted Galactic contribution in the FRB sight-line (See Table 2). After subtracting DM contributions from the Milky Way disk and halo, as shown in Table 2, the DM-excess of the FRB is pc cm-3. Using the average Macquart relation (Equation 2 in Macquart et al., 2020), we estimate the redshift of the FRB to be assuming negligible host DM contribution. This suggests close proximity of the FRB host ( 200 Mpc). As of 2021 July 1, seven more bursts have been detected from the FRB4. Interestingly, all seven bursts were clustered in two different epochs on 2020 January 22, separated by 12 hours. This suggests a highly non-Poissonian waiting time distribution for the FRB bursts. Fortunately, four FRB 20181030A bursts have baseband data saved by the CHIME/FRB baseband system (bursts with reported DMbb values in Table 1).
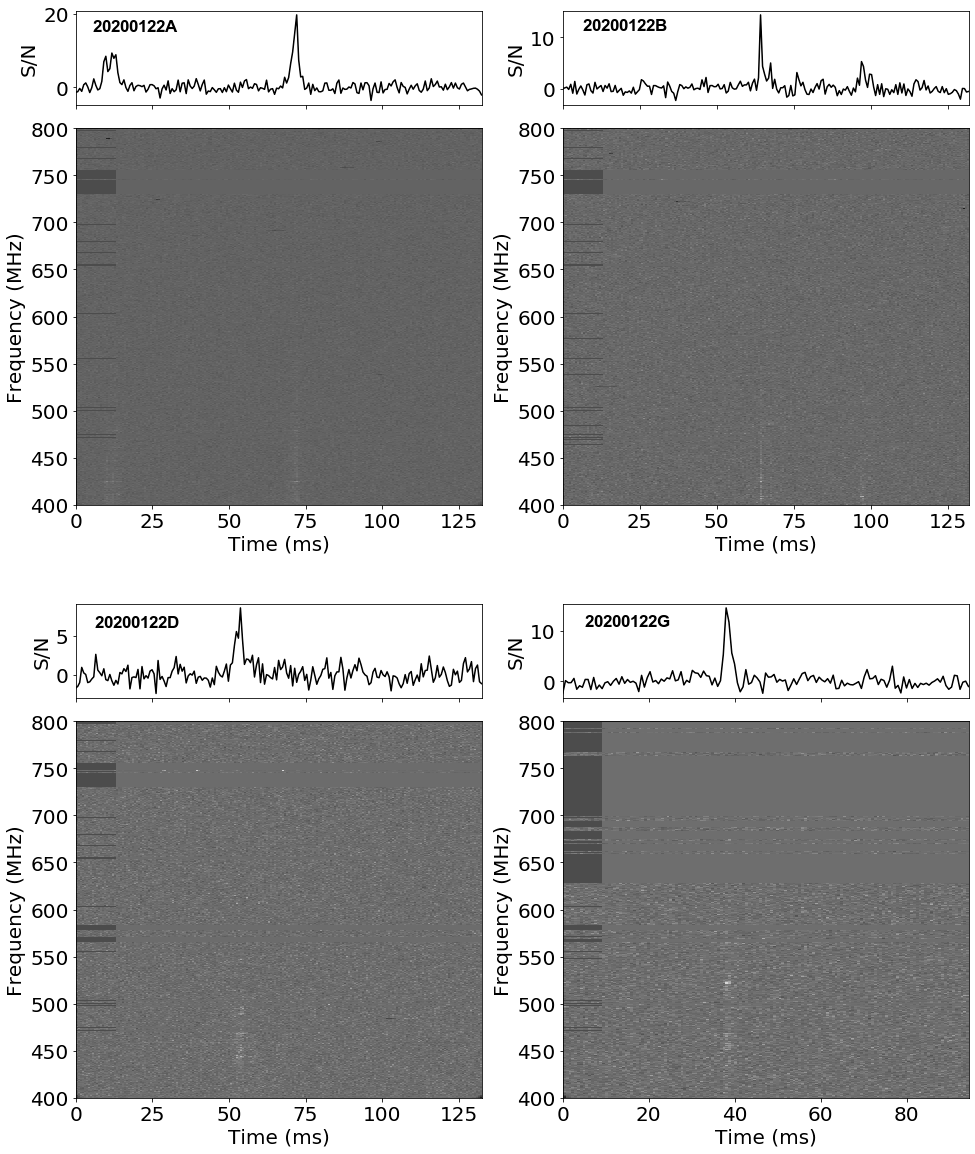
The baseband system of CHIME/FRB stores ms of channelized voltages around signals of interest (CHIME/FRB Collaboration et al., 2018). We have developed a pipeline to automatically process such baseband data and localize a burst on the sky with a precision of arcmin (Michilli et al., 2020). This is achieved by mapping the signal strength with a grid of largely overlapping beams around an initial guess. The resulting S/N measured in each beam is fitted with a mathematical model of the formed beam of the telescope. Systematic effects have been corrected by using a sample of sources with known positions. In this case, we used the baseband data of four detected bursts of FRB 20181030A, FRBs 20200122A, 20200122B, 20200122D, and 20200122G, to estimate the localization region of the FRB. The dedispersed baseband data waterfall plots and major characteristics of the four FRB bursts are shown in Figure 1 and Table 1, respectively. Other burst properties, such as fluence and flux density, along with a detailed description of both the intensity and baseband data analysis of all newly discovered FRB 20181030A bursts will be presented elsewhere. Moreover, the available data is insufficient to estimate meaningful constraints on the FRB’s periodicity. As the reported baseband localization uncertainties are statistical in nature (Michilli et al., 2020), we combined the localization regions of the four FRB bursts using a weighted average with inverse variance weights and localized the FRB to a sky area of 5.3 arcmin2 (90% confidence region; see Table 2). Next, we use the baseband localization region of FRB 20181030A to search for a potential host galaxy.
| TNS Name | MJD | Arrival Timea | S/Nb | DM | DMd |
|---|---|---|---|---|---|
| (UTC @ 400 MHz) | (pc cm-3) | (pc cm-3) | |||
| FRB 20181030Ae | 58421 | 04:13:13.1758(8) | 32.5 | 103.5 0.7 | |
| FRB 20181030Be | 58421 | 04:16:21.6419(14) | 17.1 | 103.5 0.3 | |
| FRB 20200122A | 58870 | 10:20:32.5805(3) | 13.9 | 103.53 0.02 | 103.40 0.14 |
| FRB 20200122B | 58870 | 10:27:00.4412(3) | 17.3 | 103.49 0.02 | 103.47 0.08 |
| FRB 20200122C | 58870 | 10:28:20(1) | 8.3 | 103.1 1.2 | |
| FRB 20200122D | 58870 | 22:09:30.8575(3) | 13.1 | 103.58 0.19 | 103.7 0.4 |
| FRB 20200122E | 58870 | 22:09:52(1) | 10.4 | 103.27 0.13 | |
| FRB 20200122F | 58870 | 22:22:21(1) | 8.9 | 103.7 0.7 | |
| FRB 20200122G | 58870 | 22:23:20.3080(3) | 10.5 | 103.57 0.10 | 103.7 0.5 |
a All burst times of arrival are topocentric. For FRBs 20200122C, 20200122E, and 20200122F, the arrival times are reported by the CHIME/FRB real-time pipeline (CHIME/FRB Collaboration et al., 2018). For FRBs 20200122A, 20200122B, 20200122D, and 20200122G, the arrival times are estimated by the baseband pipeline (Michilli et al., 2020). Finally, the arrival times of FRBs 20181030A and 20181030B are taken from CHIME/FRB Collaboration et al. (2019a).
b For all except FRBs 20181030A and 20181030B, band-averaged signal-to-noise (S/N) ratios are estimated by the CHIME/FRB real-time pipeline.
c S/N-optimized DM for the bursts detected in the baseband data.
d S/N-optimized DM from intensity data (see CHIME/FRB Collaboration et al., 2019a; Fonseca et al., 2020).
e Data from CHIME/FRB Collaboration et al. (2019a).
| Parameter | Value |
|---|---|
| R.A.(J2000)a | |
| Dec. (J2000)a | |
| 134.∘81, +40.∘06 | |
| DMb | 103.5 0.3 pc cm-3 |
| DM | 41 pc cm-3 |
| DM | 33 pc cm-3 |
| DM | 30 pc cm-3 |
| Max. distancee | 225 Mpc |
a The 90% confidence localization region of the FRB.
b From CHIME/FRB Collaboration et al. (2019b).
c Maximum DM model prediction along this line-of-sight for the NE2001 (Cordes & Lazio, 2002) and YMW16 (Yao et al., 2017) Galactic electron density distribution models.
dFiducial Milky Way halo prediction from the Dolag et al. (2015) hydrodynamic simulation and Yamasaki & Totani (2020) Milky Way Halo model.
e Corresponds to the maximum redshift of 0.05 (see §2.2).
2.1 Host galaxy search
First, we argue below that the FRB is unlikely to be Galactic in origin. As noted by CHIME/FRB Collaboration et al. (2019a), there is no catalogued Galactic ionized region, satellite galaxy, or globular cluster in the direction of the FRB that could contribute to the FRB DM. Moreover, Ocker et al. (2020) estimated the mean DM through the Milky Way’s warm ionized medium at large distances from the Galactic plane ( 2 kpc), = 23.0 2.5 pc cm-3. At the FRB’s Galactic latitude (), it would give a mean Galactic DM of pc cm-3. This agrees well with the prediction of the two Galactic DM models. The Milky Way halo DM contribution, DMhalo, on the other hand, is poorly constrained. Recently, Kirsten et al. (2021) estimated the Milky Way halo contribution in the direction of FRB 20200120E to be 40 pc cm-3. If this is also true for the FRB 20181030A sight-line, the FRB would be clearly extragalactic in origin. However, the halo may be clumpy (Kaaret et al., 2020), so it may still be possible to have significant variations in DMhalo along different sight-lines. Using the same argument as asserted by Bhardwaj et al. (2021), an FRB with a DM-excess of pc cm-3, if Galactic, would require a very distant ( 100 kpc) and unusually energetic neutron star as its source. As discussed below, we have found an extragalactic host with a low chance coincidence probability. Therefore, Occam’s razor argues for the extragalactic association.
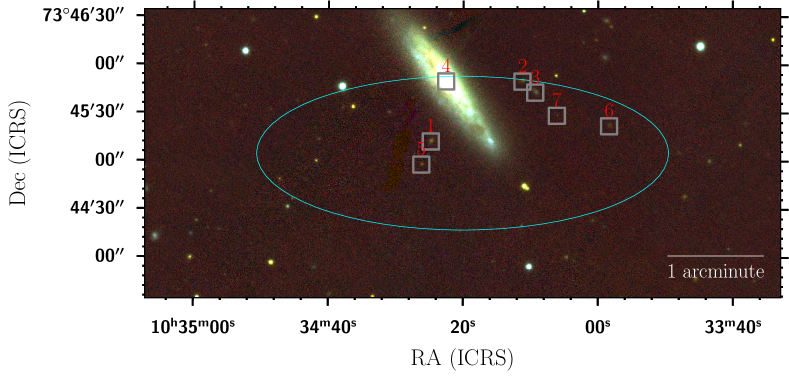
Next, we searched the NASA Extragalactic Database (NED) for catalogued galaxies within the FRB 90% confidence localization region and found only one galaxy, NGC 3252, with a redshift (z) of 0.00385(2) (Masters et al., 2014). NGC 3252 is a bright (m = 12.58 AB mag) Scd Hubble-type edge-on spiral galaxy (de Vaucouleurs et al., 1991) at a luminosity distance of Mpc. In Figure 2, we plotted the FRB localization region over a Pan-STARRS RGB image made using Pan-STARRS’s g-band (B:blue), r-band (G:green), and z-band (R:red) data. In the Figure, NGC 3252 is the most prominent galaxy. Note that NED does not provide the depth of completeness of catalogued galaxies in their search results. Therefore, in §2.2, we describe our search of dwarf galaxies within the FRB localization region.
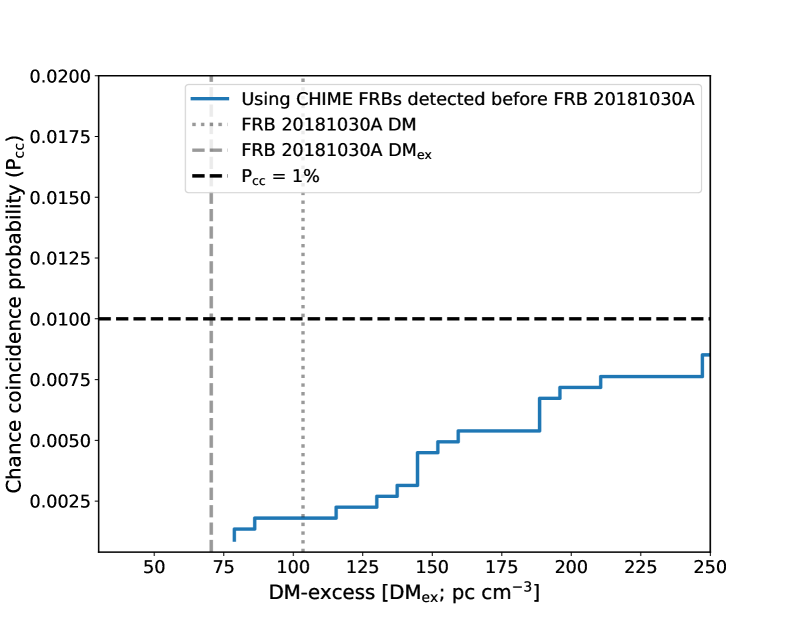
We now estimate the chance coincidence probability (Pcc) of finding an NGC 3252-like bright galaxy close to the FRB localization region. Briefly, we assume a Poisson distribution of galaxies across the sky and calculate the probability of finding one or more galaxies with m smaller than or equal to that of NGC 3252 (12.79 AB mag; without correcting for the Galactic extinction) by chance close to the FRB 90%-confidence localization region (5.3 acmin2). Using the areal number density of NGC 3252-like or brighter galaxies, = 0.2 deg-2 from Driver et al. (2016), we estimate P. However, as the presence of NGC 3252 is inferred post-hoc, we have corrected the Pcc to account for the problem of multiple testing (also known as the look-elsewhere effect) using the method described by Bhardwaj et al. (2021). After considering all CHIME FRBs that were discovered before the first detected burst of FRB 20181030A and have the DM-excess 103.5 pc cm-3 (see Figure 3), we estimate the Pcc to be 0.0025.
We should point out, however, that our chance coincidence analysis favors brighter galaxies over fainter ones because the latter are more abundant and therefore more likely to be found in the FRB localization region by chance. Therefore, in the next section, we searched for faint galaxies within the FRB localization region.
2.2 A dwarf host of FRB 20181030A?
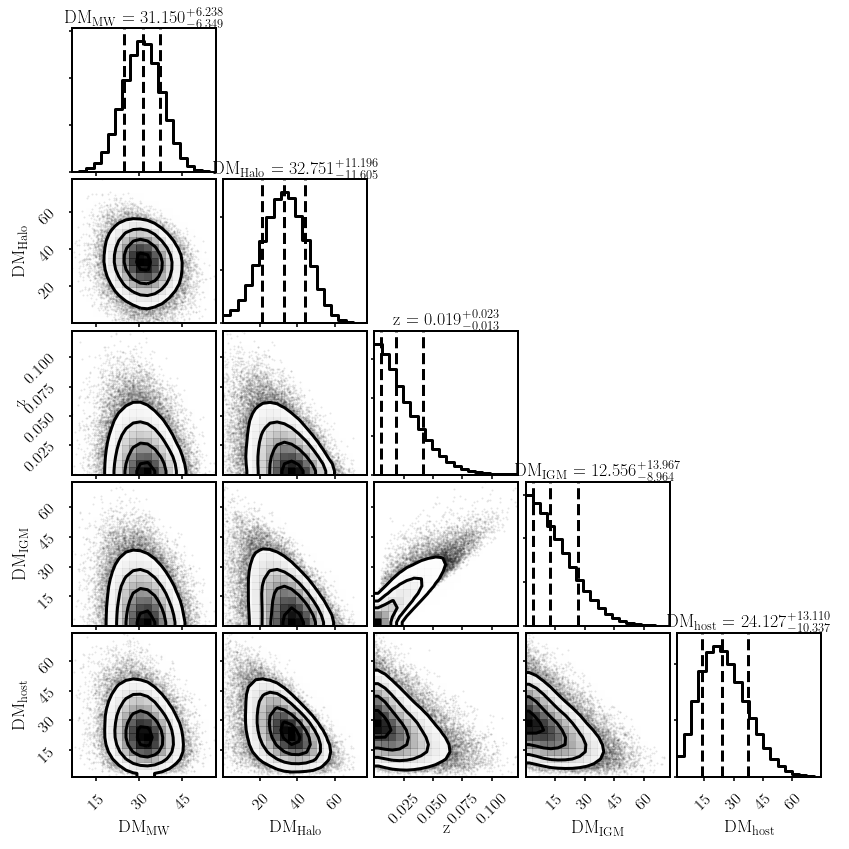
In order to check if there exists any plausible dwarf galaxy within the FRB localization, we first estimated the maximum redshift of the FRB 20181030A host by performing a Markov Chain Monte Carlo (MCMC) simulation, which is discussed in Appendix A. Using the priors shown in Table 8 and an emcee based MCMC inference framework (Foreman-Mackey et al., 2013), we computed a one-sided 95% Bayesian credible upper limit on the FRB host redshift (zmax) = 0.05 from the marginalized host redshift posterior.
There are a few factors that make our maximum redshift estimate conservative. If the FRB host lies beyond NGC 3252, the FRB sight-line would traverse the NGC 3252 halo with a projected offset 14 kpc. Using the stellar mass of NGC 3252 from Table 6, we estimated its halo mass to be 1.9 M⊙ using stellar mass to halo mass relation using Equation 2 from Moster et al. (2013) and the NFW profile halo concentration factor = 9.4 using Equation 24 from Klypin et al. (2016). At a projected offset of 14 kpc, using the method described by Bhardwaj et al. (2021), we estimate the DM contribution of the NGC 3252 halo 15 or 30 pc cm-3 for baryon fractions 0.4 and 0.75, respectively, using the halo density profile from Maller & Bullock (2004) (the profile that predicted the lowest M81 halo DM in Figure 4 of Bhardwaj et al., 2021). The former baryon fraction value is the minimum that Hafen et al. (2019) found in the Feedback In Realistic Environments (FIRE) simulation for a halo of mass 1011 M⊙). The latter value, i.e., 0.75, is estimated assuming 25% of the baryons exist in the galaxy as the interstellar medium (ISM), stars, and compact remnants (Fukugita et al., 1998). Moreover, NGC 3252 is a part of a galaxy group with the dynamic group mass = 1.2 M⊙ (Kourkchi & Tully, 2017). In addition to this, the FRB sight-line intersects several other galaxy groups that are located within z = zmax (Tempel et al., 2016; Lim et al., 2017). All these would contribute to the observed FRB DM and consequently, if accounted for, would reduce our maximum redshift estimate considerably.
Note that an FRB 20121102A-like star-forming dwarf galaxy ( AB mag; Tendulkar et al., 2017), the faintest FRB host discovered to date, if located at zmax, would have r-band magnitude 19.8 AB mag. Fortunately, the FRB field-of-view is imaged by the Dark Energy Spectroscopic Instrument (DESI) Legacy Imaging Survey (Dey et al., 2019) with an r-band depth 24 AB mag (5). Using the DESI data, Zou et al. (2019) estimated photometric redshifts of all the identified galaxies with a 5 r-band completeness limit of 23.6 AB mag. However, this limit is likely not complete for low surface brightness (LSB) galaxies. For the DESI Legacy Imaging Survey, the average r-band surface brightness limit is 26 mag arcsec-2 (Dey et al., 2019; Tanoglidis et al., 2021; Arora et al., 2021). At z = zmax, an M AB mag LSB galaxy of effective radius 1-3 kpc (Greco et al., 2018) and uniform surface brightness 26 mag arcsec-2 should be detected in the DESI data as an mr 22 AB mag source. More importantly, the mr 22 AB mag limit is sensitive to detect a dwarf host 5 times less luminous than any FRB host discovered to date (M AB mag). Given this constraint, we selected seven galaxies from Zhou et al. (2020), including NGC 3252, which have mr 22 AB mag and are located within the FRB 90% confidence localization region (shown as a cyan ellipse in Figure 2) and estimated their spectroscopic redshifts using the 10.4-m Gran Telescopio Canarias (GTC) (see §2.3).
2.3 GTC observations and analysis
In this section, we describe our GTC observations of the seven plausible host candidates. As will be shown later, only NGC 3252 satisfies the zmax constraint, and hence, the most plausible host of the FRB.
2.3.1 Observations
Observations of the galaxies identified within the FRB 20181030A 90% localization region were performed with the the Optical System for Imaging and low-intermediate Resolution Integrated Spectroscopy (OSIRIS555http://www.gtc.iac.es/instruments/osiris/) at the GTC. The OSIRIS detector consists of two CCDs and provides a field of view (FoV) of 7.8 7.8 with a pixel scale of 0.254. The data were obtained during four observing runs in October 2020 and May 2021. The observing blocks corresponding to the first two runs were executed under Director’s Discretionary time. A summary of the observations is given in Table 3.
We obtained long-slit spectra of the NGC 3252 using the R1000B grism that covers the spectral range from 3700 to 7500 Å, with the 1.2 slit width, providing a spectral resolution of about 9 Å. The slit was placed to pass through the major axis of the galaxy at a PA=37.31∘, which is shown in Figure 7.
To perform simultaneous observations of the other six host galaxy candidates in the localization region (see Table 4), we utilized the OSIRIS MOS (multi-object spectroscopy) mode. The mask for the MOS observations was designed with the OSIRIS Mask Designer Tool (González-Serrano et al., 2004; Gómez-Velarde et al., 2016) using the catalog coordinates of the galaxies and a set of five fiducial stars. The observations were performed with the R500B and R500R grisms that cover the spectral ranges 36007200 Å and 480010000 Å, respectively. For the target galaxies we designed rectangular slitlets with length varying between 4.5 and 10 and a width of 1.5 each. Two additional slitlets covered source-free regions for sky subtraction. The spectral resolution of the R500B and R500R data is 21 Å and 27 Å, respectively.
| Program | Date | Mode | Grism | Position | Exposure | Seeing | Airmass | Night |
|---|---|---|---|---|---|---|---|---|
| Angle | Time | |||||||
| GTC04-20BDDT | 24/10/2020 | long-slit | R1000B | 37.31∘ | 4 60 s | 1.2 | 1.59 | Dark |
| GTC04-20BDDT | 26/10/2020 | MOS | R500R | 0 | 8 700 s | 1.5 | 1.75 | Dark |
| GTC18-21AMEX | 04/05/2021 | MOS | R500B | 0 | 3 1200 s | 0.9 | 1.68 | Dark |
| GTC18-21AMEX | 15/05/2021 | MOS | R500B | 0 | 3 1200 s | 1.0 | 1.56 | Dark |
2.3.2 Data reduction
The OSIRIS MOS and long-slit spectra were reduced using the GTCMOS pipeline (Gómez-González et al., 2016) and standard IRAF routines (Tody, 1986, 1993). All spectra were bias-subtracted, and flat-fielded using the set of corresponding images taken during the same observing nights. For flux calibration we used spectrophotometric standards Feige 110, GD153 and Ross 640 (Oke, 1990; Bohlin et al., 1995; Oke, 1974) observed during the same nights as the targets. A set of arc-lamp spectra of Ne, Hg and Ar was used for wavelength calibration. The rms errors of the resulting solutions were 0.5Å for the R1000B grating and 2 Å for the R500R and R500B gratings.
| Number | R.A. | Dec. | DESI(r-band)a | Identified lines | zspec |
|---|---|---|---|---|---|
| J2000 | J2000 | AB mag. | |||
| 1 | 10h34m24.s81 | 7345′12.″81 | 19.69 | [OII], Ca doublet, G-band | 0.460(1) |
| 2 | 10h34m11.s23 | 7345′49.″23 | 19.89 | Ca doublet, G-band, Mg, Na | 0.455(2) |
| 3 | 10h34m9.s33 | 7345′42.″33 | 19.41 | [OII], Ca doublet, [OIII] doublet | 0.276(2) |
| 4b | 10h34m22.s56 | 7345′49.″56 | 12.58 | see text | 0.00385(2) |
| 5 | 10h34m26.s20 | 7344′57.″20 | 21.61 | Ca doublet, G-band, Mg, Na | 0.645(1) |
| 6 | 10h33m58.s36 | 7345′21.″36 | 20.76 | Ca doublet, G-band | 0.647(1) |
| 7 | 10h34m6.s12 | 7345′28.″12 | 21.67 | [OII], Ca doublet | 0.563(2) |
a The r-band magnitudes are corrected for the Milky Way extinction.
b Source 4 is NGC 3252, and at a spectroscopic redshift = 0.0039 (20 Mpc), it is the only galaxy in our list with the redshift .
2.3.3 Multi-object Spectroscopy
The resulting product of the pipeline contained 2-D calibrated spectra collected in all of the slitlets. We extracted each spectrum and subtracted the sky using the IRAF task . We utilized background from the source-free regions to subtract sky from the spectra obtained in the shortest slitlets. The lines identified for each galaxy and the corresponding average redshifts are presented in Table 4. To confirm our redshift estimations, we used the Manual and Automatic Redshifting Software (MARZ, Hinton et al., 2016) and compared the extracted spectra with the galaxy templates. In all cases the identified spectral lines (see Table 4) have shown an agreement with the spectral features corresponding to early type absorption and intermediate type galaxy templates, confirming our estimations.
Among the identified host galaxy candidates, only NGC 3252 has a spectroscopic redshift . This makes NGC 3252 the only viable FRB host candidate among all the identified galaxies with m AB mag. Note that blue star-forming dwarf galaxies have been proposed to host FRB progenitors (Metzger et al., 2017) via “prompt”-formation-channels, such as superluminous supernovae and long gamma-ray bursts (Fruchter et al., 2006). However, because of their highly dynamic and rich ISM, these galaxies are expected to contribute significantly to the FRB DM (Li et al., 2019). For instance, Tendulkar et al. (2017) estimated that the DM contribution of the FRB 20121102A host, a dwarf irregular star-forming galaxy, is pc cm-3. Hence, together with the inference from §2.2, the prospect of a host galaxy beyond NGC 3252 seems unlikely. Lastly, in Table 5, we have listed the three galaxies in the photometric redshift catalog of DESI extragalactic sources (Zou et al., 2019) that are located within the FRB localization region and have r-band magnitude 22 AB mag along with their estimated photometric redshifts. All three galaxies have 5 lower limit on the redshift zmax. Therefore, we conclude that the association between FRB and NGC 3252 is real and robust.
| Number | R.A. | Dec. | DESI(r-band) | z | z |
|---|---|---|---|---|---|
| J2000 | J2000 | AB mag. | |||
| 1 | 10h34m16s.01 | 7344′18″.60 | 22.56 | 0.62 | 0.06 |
| 2 | 10h33m59s.30 | 7344′40″.56 | 22.90 | 0.60 | 0.09 |
| 3 | 10h34m35s.06 | 7344′58″.56 | 22.73 | 0.72 | 0.06 |
a From photometric redshift catalog of galaxies detected in the DESI survey (Zou et al., 2019).
b For all three galaxies, z zmax.
2.4 Physical properties of NGC 3252
Here we summarise major physical properties of NGC 3252. We obtained long-slit spectroscopy data from GTC, and its analysis is described in Appendix B. From the integrated optical spectrum of the galaxy, we estimate the oxygen abundance 12+(O/H) = 8.440.06 (or nebular metallicity ), which is 60% of the solar value (Asplund et al., 2009). We also derive dust extinction at the V-band, A (E(BV) using R), using H/H ratio (i.e. Balmer decrement), assuming the standard Milky Way extinction curve (Cardelli et al., 1989). Finally, using SFR(H) = 7.9 M⊙ yr L(H/erg s-1) (Kennicutt et al., 1994), we get SFR(H)=0.033 M⊙ yr-1 using the extinction corrected total H luminosity of L(H) = 4.12 erg s-1.
However, as the slits only cover a small fraction of the surface area of NGC 3252, it is expected that the above star formation rate is significantly underestimated. Therefore, we estimate the total star formation rate (SFRtotal) by combining the total infrared (TIR) luminosity and far-UV (FUV)-derived SFR as described in Iglesias-Páramo et al. (2006), which is found to be a robust estimate for the disk galaxies (Buat et al., 2007). We estimated the TIR luminosity of NGC 3252 using the prescription of Dale & Helou (2002) which uses the Infrared Astronomical Satellite (IRAS) filters’ fluxes (Fullmer & Londsale, 1995), and got L(TIR) = 2.13 L⊙. Using Equation 5 from Iglesias-Páramo et al. (2006), SFR(TIR) = 0.38 M⊙ yr-1. Similarly, for the FUV luminosity, we use the Galex NUV filter flux and estimated the SFR(FUV) = 0.13 M⊙ yr-1 using the extinction uncorrected L(FUV) of NGC 3252 = 2.7 108 L⊙. Finally, the total recent star formation rate was calculated using the relation from Iglesias-Páramo et al. (2006): SFRtotal = SFR(NUV) + (1-) SFR(TIR) = 0.36 M⊙ yr-1 where 0.4 for disk galaxies in the local Universe (Iglesias-Páramo et al., 2004), which accounts for the fraction of the total IR luminosity heated by old stars. This relation has a calibrated uncertainty of about 20%.
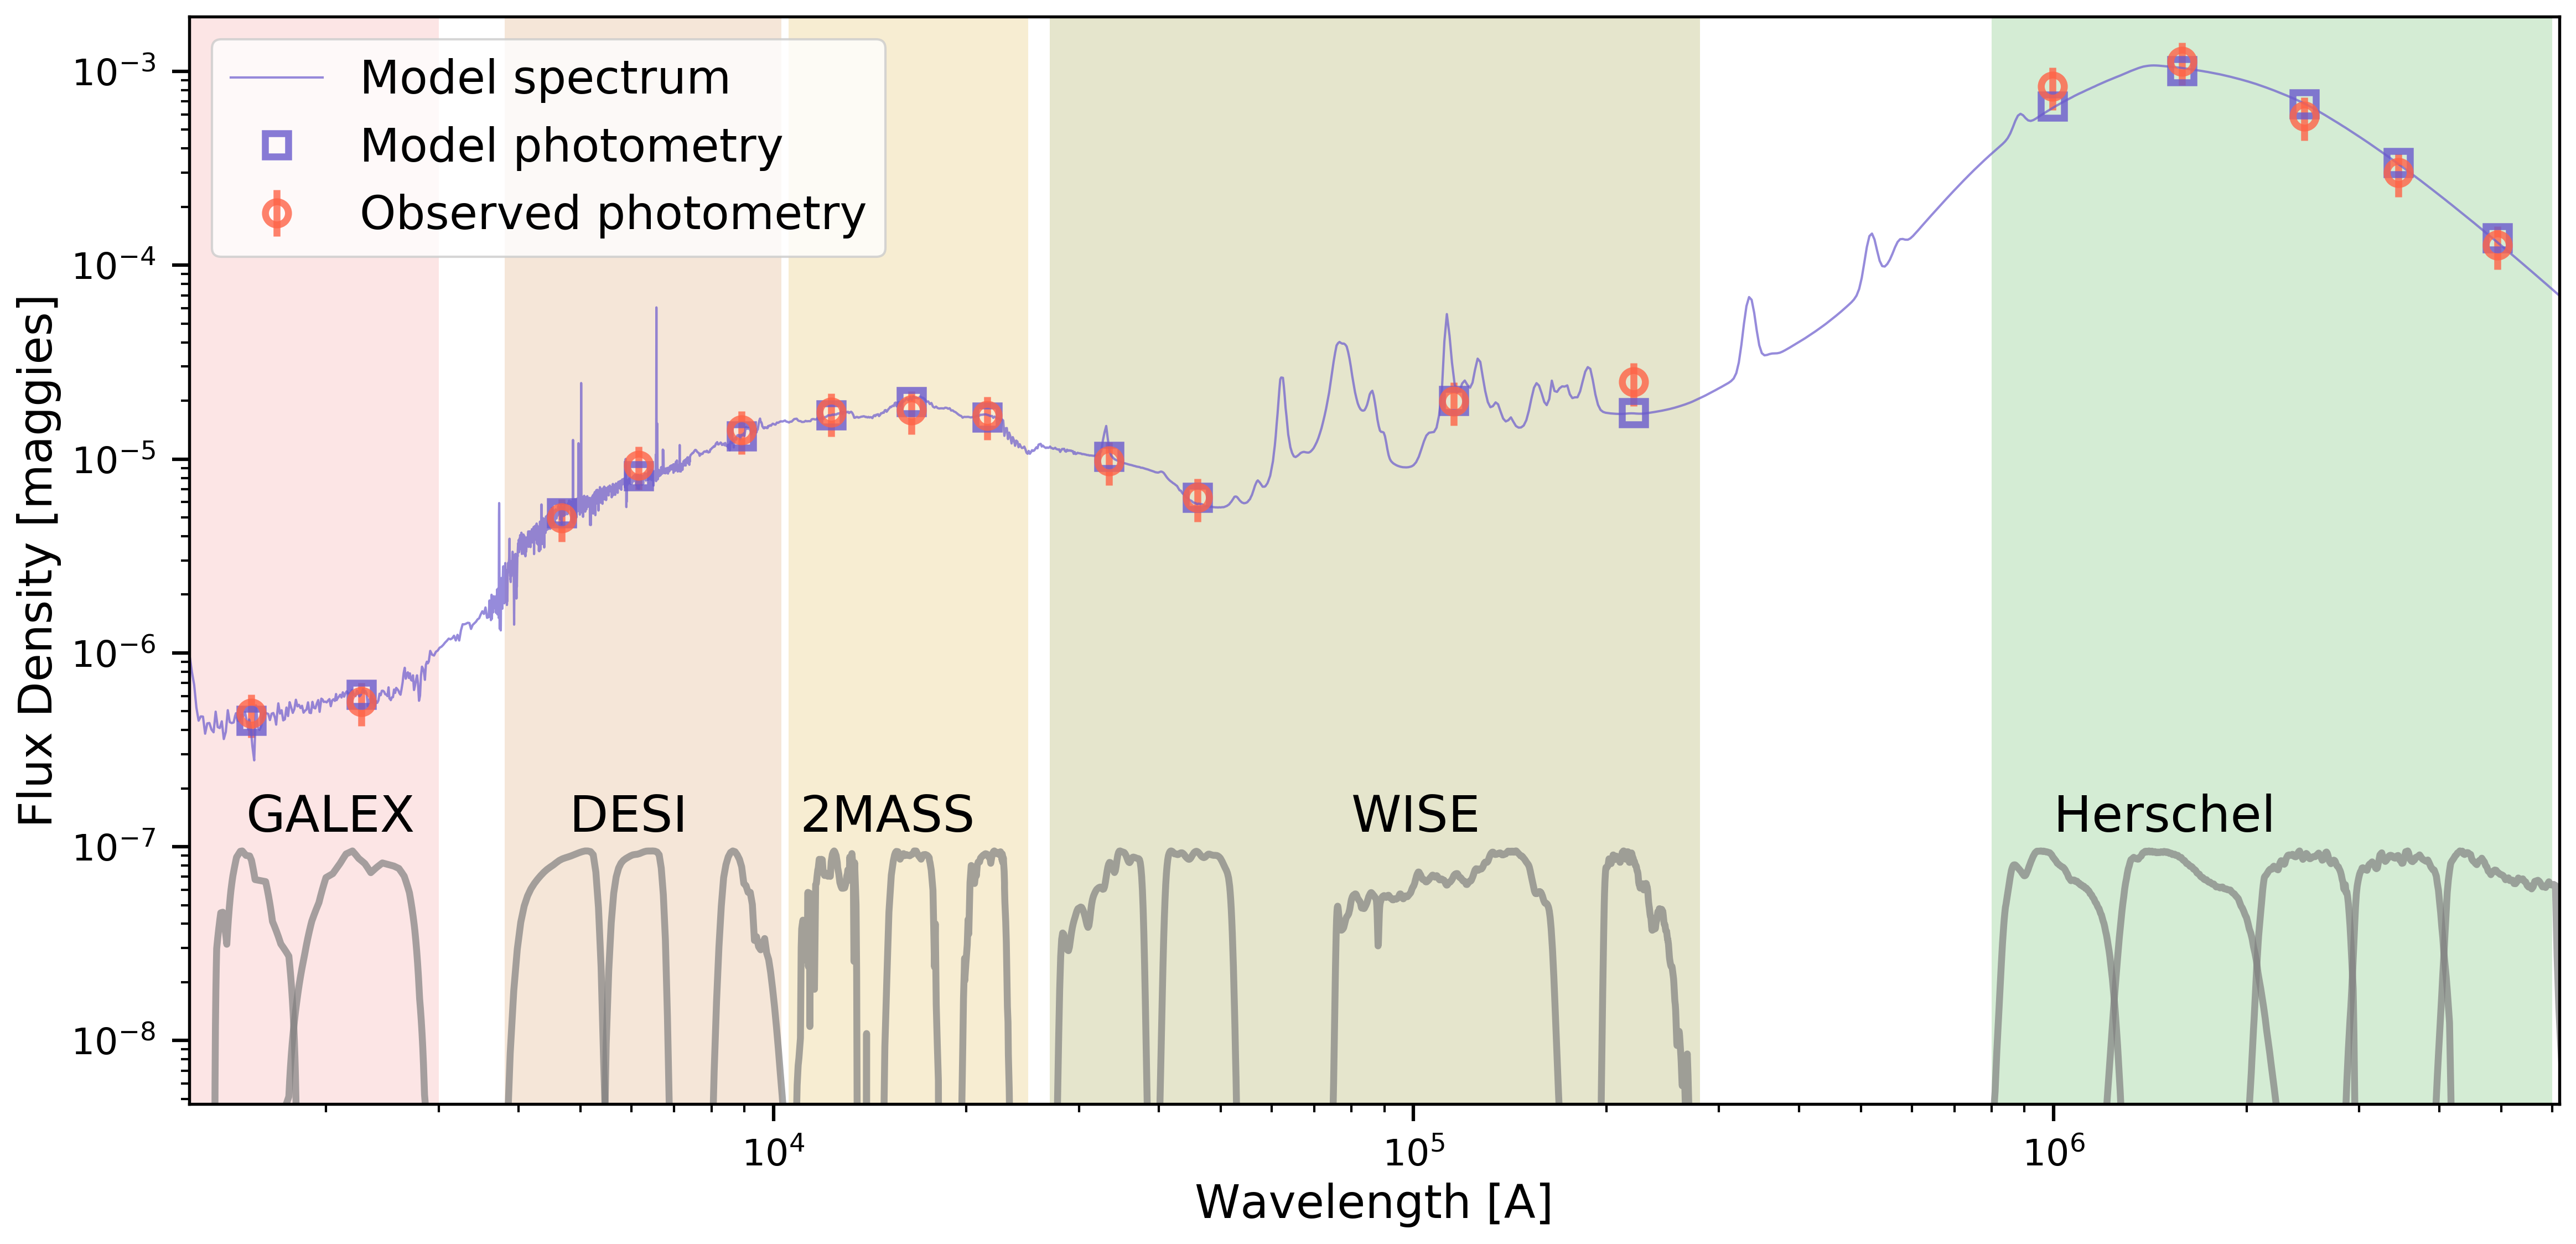
To estimate stellar mass, metallicity and mass-weighted age of NGC 3252, we use a Bayesian inference spectral energy distribution (SED) fitting code, Prospector (Leja et al., 2017; Johnson et al., 2019). Appendix C describes the SED fitting analysis in detail. We used 17 broadband filter fluxes covering the far-ultraviolet band (FUV) to far-infrared (FIR) bands (see Table 11) of NGC 3252 and fit a five-parameter delayed- model (Simha et al., 2014; Carnall et al., 2019). This model and assumed priors of the free-parameters are discussed in Appendix C. The best-fit spectral energy distribution (SED) profile of NGC 3252 is shown in Figure 4. Prospector also allows for Markov Chain Monte Carlo (MCMC) posterior sampling to estimate uncertainty in the best-fit values of the model parameters, which are stated in Table. 6.
| Property | Value | Reference |
| log[SFR] ()a | 0.1 | this work |
| Stellar Metallicity ()a | this work | |
| Nebular Metallicity () | 0.07 | this work |
| Oxygen abundance [O/H] | 8.44 0.06 | this work |
| Stellar mass ( | this work | |
| Effective radius (Reff; kpc) | 2.6 | Salo et al. (2015) |
| Mass-weighted age (Gyr)a | 4.8 | this work |
| E(B-V) (mag) | 0.42 0.06 | this work |
| Absolute r-band mag. (AB) | 19.1 0.5 | – |
| Luminosity distance (Mpc) | 20 5 | Tully et al. (2016) |
a Estimated using Prospector; See Appendix C.
2.5 Search for a multi-wavelength counterpart to FRB 20181030A
2.5.1 Persistent radio source search
We searched archival radio data of the following surveys to check for the presence of a persistent radio source within the FRB uncertainty region: the NRAO VLA Sky Survey (NVSS; Condon et al., 1998), the VLA Sky Survey (Lacy et al., 2016, VLASS;), the Westerbork Northern Sky Survey (WENSS; Rengelink et al., 1997), and the Tata Institute of Fundamental Research Giant Metrewave Radio Telescope Sky Survey (TGSS) Alternative Data Release (Intema et al., 2017). We found only one radio source, NVSS J103422+734554. The radio source is only detected in NVSS and is either unresolved or marginally extended. Moreover, it is spatially coincident with the center of NGC 3252. Table 7 lists 5 upper limits on the source’s integrated flux density derived from the archival radio images of all other surveys. The NVSS radio source is likely resolved out and hence, undetected in the VLASS 2.1 data. In VLASS 1.1 data, we detected an irregular-shape source spatially coincident with the NVSS radio source. However, due to the lack of detection in the VLASS 2.1 data despite similar sensitivity, and known calibration and imaging artefacts in the VLASS 1.1 data (Lacy et al., 2016), the radio source is likely spurious (M. Lacy, private communication). From the non-detection in the TGSS data and assuming a power-law dependence of the NVSS radio source flux density i.e., S, we estimated a lower limit on . This agrees well with the observed radio continuum spectral index of local star-forming galaxies (between 0.1 and 0.7; Marvil et al., 2015).
While searching the VLA archive, we also found raw EVLA data (project ID = AK752) that cover the FRB localization region. Observations were conducted on 2010 June 19 (MJD 55366) with the array in D-configuration in two 128-MHz bandwidth sub-bands with central frequencies 4.495 GHz and 7.852 GHz, and about 40 minutes of time on source. The absolute flux density calibrator 3C147 and the phase calibrator J1048+7143 were used. The data were calibrated and flagged using CASA software (McMullin et al., 2007). Additional RFI flagging and self-calibration were done resulting in a final primary-beam corrected image with a local rms noise of 30 Jy beam-1. Within the FRB localization region, we detect only the NVSS radio source extended in both the EVLA observations (See Figure 5). The integrated flux density of the NVSS source at 4.495 GHz and 7.852 GHz is estimated using the Aegean package (Hancock et al., 2012, 2018) and is stated in Table 7. Using the EVLA flux densities at 4.495 GHz and 7.852 GHz, we estimated to be , which is steeper than the lower-limit on estimated using the flux densities at 150 MHz and 1.4 GHz (). This is not unusual as the radio spectra of star-forming galaxies are known to show a break (or an exponential decline) in the frequency range of 112 GHz (Klein et al., 2018).
The NVSS source is likely to be produced via ongoing star formation in NGC 3252. To test this, we estimate the SFR using the NVSS 1.4 GHz continuum emission and compare it with the value estimated in §B. Using the 1.4 GHz–SFR relation from Davies et al. (2017), log(SFR, we estimate log(SFR which agrees with the SFR estimate in Table 6. Though it is difficult to rule out the presence of a low-luminosity active galactic nucleus (AGN) at the center of NGC 3252 (Maoz, 2007), the extended nature of the radio source and agreement of its 1.4 GHz flux density with the SFR of NGC 3252 suggest that an AGN is unlikely to be the dominant source of the observed persistent radio emission. Moreover, from the non-detection of a persistent compact radio source ( at 20 Mpc) in the FRB 20181030A localization region in the VLASS 2.1 data (which has the best angular resolution among all the radio surveys considered here), we estimate a 3 upper limit of 480 Jy at 3 GHz which at 20 Mpc implies an isotropic spectral luminosity erg/s/Hz, at least 1500 times fainter than that the persistent radio source detected spatially coincident to FRB 20121102A (Chatterjee et al., 2017; Resmi et al., 2020).
| Survey | Frequency | Date | Image Resolutiona | Integrated Flux Density |
|---|---|---|---|---|
| GHz | UT | mJy | ||
| TGSS | 0.15 | 2016 March 15 | 25 | 10b |
| WENSS | 0.326 | 1997 October 22 | 56 | |
| NVSSc | 1.4 | 1993 December 18 | 45 | |
| VLASS 2.1 | 3.0 | 2020 October 13 | 2.5 | |
| EVLAc | 4.495 | 2010 June 19 | 12.8 | |
| 7.852 | 2010 June 19 | 9.1 |
a For each survey, average of major and minor axes of the formed beam is quoted.
b 5 local rms noise.
c The lone radio source in the FRB uncertainty region is extended and spatially coincident with the center of NGC 3252 in the NVSS and two EVLA observations.
2.5.2 Archival search for X-ray counterparts
We searched the Transient Name Server (TNS)666https://www.wis-tns.org/ for any archival transient event that is spatially and temporally coincident with any of the nine recorded FRB 20181030A bursts and found none. We also checked if the FRB was visible to the Swift/Burst Alert Telescope (BAT) and Fermi/GBM at the time of the bursts. Unfortunately, Swift/BAT was either not operational (transiting through the South Atlantic Anomaly region) or the FRB location was not within the BAT’s field-of-view. Similarly, for all except FRB 20200122A , the FRB location was not visible to Fermi/GBM. If FRB 20200122A was associated with a giant magnetar flare like the one detected from SGR 180620 on 2004 December 27 (Palmer et al., 2005), Fermi/GBM with a flux sensitivity of 10-7 erg cm-2 s-1 in the 50–300 keV band (von Kienlin et al., 2020) would have marginally detected it. This places an upper limit on the coincident X-ray flare energy 1046 erg s-1 at 20 Mpc (without correcting for the attenuation by the host). There is an X-ray source RX J1034.3.3+7345 (or 1AXG J103422+7344 in the ASCA medium sensitivity survey by Ueda et al., 2001) in the vicinity of NGC 3252. This source was discovered in the ROSAT all-sky survey (Truemper, 1982) and was initially associated with NGC 3252 by Bade et al. (1998), Condon et al. (1998) and Bauer et al. (2000). However, with the availability of higher resolution X-ray images, this association has been argued to be incorrect (Haakonsen & Rutledge, 2009). More interesting, the X-ray source was found to be spatially coincident with an optical transient PTF10hjz discovered by the Palomar Transient Factory (PTF) on 2010 May 16 (Kasliwal, 2011). Based on its high optical and radio flux variability and estimated broadband spectral energy distribution, PTF10hjz was later classified as a background blazar (S. Kulkarni, private communication). Therefore, we conclude that the X-ray source RX J103423.1+734525 (or PTF10hjz) is unrelated to FRB 20181030A.
3 Discussion
3.1 Constraints on the Milky Way halo DM contribution
With NGC 3252 as its host, we can use FRB 20181030A and its low DM-excess (as for FRB 20200120E; Bhardwaj et al., 2021), to constrain the Milky Way halo DM along the FRB sight-line. At 20 Mpc, using the average Macquart relation, we estimate DM 5 pc cm-3.777DMIGM is expected to be considerable as the FRB sight-line intersects several foreground groups, including that of M81 (Tully, 2015) making DMIGM = 5 pc cm-3 a conservative estimate. Assuming negligible host DM contribution, we find an upper limit on the DMMW,halo to be 58 and 66 pc cm-3 using the DMMW estimate from the NE2001 and YMW16 models, respectively (See Table 2). However, a negligible host contribution is likely an overly conservative assumption as even in the extreme scenario where the FRB has a very large offset from the host, the host’s circumgalactic medium would still contribute to the FRB DM. Therefore, we use the MCMC analysis discussed in Appendix A, but this time, fix the redshift of the FRB to that of NGC 3252. From this analysis, we estimate the DMMW,halo 90% Bayesian credible interval to be (19 pc cm-3, 55 pc cm-3). This, along with a similar constraint derived by Bhardwaj et al. (2021), suggests that the Milky Way halo DM contribution could be relatively small. This in turn would help in constraining the state and composition of the Milky Way circumgalactic medium (Tumlinson et al., 2017). However, to constrain the average DMMW,halo estimate, we need more low-DM FRBs.
3.2 Comparison with SGR 1935+2154 radio bursts
From Table 2 of CHIME/FRB Collaboration et al. (2019a), the peak 400–800-MHz flux densities of the two published bursts from this source, FRBs 20181030A and 20181030B, are 3.2 1.7 Jy and 3.1 1.4 Jy, respectively. At a distance of 20 Mpc, the isotropic radio luminosity of these two bursts would be 1038 erg s-1, around six times larger than those of the very bright SGR 1935+2154 radio bursts recently detected by CHIME/FRB and STARE2 (CHIME/FRB Collaboration et al., 2020b; Bochenek et al., 2020).888Assuming the distance to SGR 1935+2154 is 10 kpc, but note that Zhou et al. (2020), Mereghetti et al. (2020) and Bailes et al. (2021) argue for a significantly smaller distance to the magnetar, - kpc. This suggests a continuum of FRB luminosities, at least at low values. Bochenek et al. (2020) estimated the volumetric rate of SGR 1935+2154-like bursts to be , assuming that the FRB luminosity function follows a power law and the FRB rate is proportional to the star-formation rate. As at least the two FRB bursts in the first CHIME/FRB catalog (The CHIME/FRB Collaboration et al., 2021) have isotropic luminosity erg s-1, we estimate a lower limit on the volumetric rate of FRBs ( erg s-1) to be . This lower limit is in agreement with the estimate by Bochenek et al. (2020), which supports their conclusion that magnetars like those observed in the Milky Way could be a dominant channel of FRB production, at least at the lower end of the FRB luminosity function.
Moreover, the estimated CHIME/FRB volumetric rate agrees with the rate calculated by extrapolating the luminosity function derived from a sample of bright FRBs observed at 1.4 GHz by the Australian Square Kilometre Array Pathfinder (ASKAP) and Parkes down to the luminosity of FRB 20181030A’s bursts (Lu & Piro, 2019; Luo et al., 2020). Lastly, the estimated FRB volumetric rate at low luminosities is at least 100 times higher than the observed volumetric rate of core-collapse supernovae in the local Universe (Taylor et al., 2014, Gpc-3 yr-1). Assuming core-collapse supernovae are the most common way to produce compact objects, FRBs detected at low luminosities ( erg s-1) are therefore more likely to be repeating sources.
3.3 Implications for different progenitor models
Three repeating FRB sources within a comoving volume out to a distance of 20 Mpc (CHIME/FRB Collaboration et al., 2020b; Bochenek et al., 2020; Bhardwaj et al., 2021) have now been discovered. Using these discoveries, we estimate a lower limit on the comoving number density (nFRB) of repeating FRB sources to be 9 Gpc-3. We can also express nFRB = R, where RFRB is the local Universe volumetric birth rate of repeating FRB sources, and are the average lifetime and active duty cycle of repeating FRBs, respectively, and is the beaming fraction. Taking the fiducial values of = 0.1 and = 0.3 from Lu & Kumar (2016) and Nicholl et al. (2017b), we estimate . One of the popular proposed repeating FRB models is a highly magnetized ( G) young neutron star with period ms. Nicholl et al. (2017b) estimated the volumetric birth-rate of millisecond magnetars (Rms) to be . Using this Rms value as , we estimate yr. This is around two orders of magnitude greater than the expected typical lifetime of a repeating FRB in the models that invoke millisecond magnetars ( yrs; Metzger et al., 2017, 2019). Therefore, it is unlikely that all repeating FRBs are produced by millisecond magnetars formed primarily via cataclysmic events, like superluminous supernovae, or long and short gamma-ray bursts. Note that Nicholl et al. (2017b) did not include accretion induced collapse (AIC) as a channel for forming millisecond magnetars in their calculation due to the high uncertainty in the AIC rates. However, theoretically estimated rates of AIC are found to be comparable to that of binary neutron star mergers (Tauris et al., 2013; Kwiatkowski, 2015). If these estimates are correct, including them would not change our conclusion significantly.
3.4 Comparison with other repeating FRB hosts
With the inclusion of FRB 20181030A, likely localized to the star-forming galaxy NGC 3252, in the sample of five repeating FRBs, 20121102A, 20180916B, 20190711A, 20200120E, and FRB 20201124A (CHIME/FRB Collaboration, 2021; Fong et al., 2021; Ravi et al., 2021), it is evident that the repeating FRB hosts exhibit a continuum of properties in terms of their luminosities, stellar masses, metallicity, and SFRs, ranging from FRB 20121102A, a metal-poor, high-star forming dwarf irregular galaxy, to FRB 20200120E, a metal-rich massive early-type spiral galaxy. However, it is interesting to note that all five localized repeating FRBs discovered thus far are in either spiral or irregular galaxies (Mannings et al., 2020; Bhardwaj et al., 2021), where practically all core-collapse supernovae (SN II, IIn, IIb, and Ib/c) occur (van den Bergh et al., 2005). However, FRB 20200120E is localized to an M81 globular cluster (Kirsten et al., 2021) where core-collapse supernovae are not expected to occur. Therefore, we need a larger sample of FRB hosts to decipher the nature of FRB progenitors. Lastly, we note that all three local Universe repeating FRBs have thus far been observed to produce only low-energy bursts ( erg), unlike, for example, the FRB 20121102A bursts, which have shown a range of burst energies (10 erg; e.g., Chatterjee et al., 2005; Gourdji et al., 2019). More bursts, particularly high-energy ones, from these FRBs would aid in constraining the emission mechanism of the local Universe FRBs (Lyubarsky, 2021).
4 Summary & Conclusions
We have reported on the likely association of the repeating FRB 20181030A discovered by CHIME/FRB Collaboration et al. (2019a) with a nearby star-forming spiral galaxy, NGC 3252, at a distance of 20 Mpc. The chance coincidence probability of finding NGC 3252 within the FRB localization region is . Moreover, we searched for plausible host galaxies within the 90% confidence localization region of the FRB, and found no galaxy except NGC 3252 with M, a limit in luminosity over five times smaller than for any FRB hosts identified to date.
NGC 3252 is a star-forming spiral galaxy (see Figure 4). We found no archival transient event spatially or temporally coincident with any of the reported FRB 20181030A bursts to date. For one FRB burst, FRB 20200122A, that was detected on 2020 January 22 by CHIME/FRB and was also visible to Fermi/GBM, we estimated an upper limit on the coincident X-ray flare energy to be 1046 erg s-1. We also searched for a compact, persistent radio continuum source within the FRB localization region and found none. We then estimated a 3 upper limit at 3 GHz , at least 1500 times fainter than the persistent source associated with FRB 20121102A. Due to its low DM-excess, we constrain the Milky Way halo DM contribution to be 1955 pc cm-3 (90% confidence interval) along the FRB sight-line. We also compared the two published FRB 20181030A bursts with those of SGR 1935+2154. The FRB bursts’ isotropic luminosity is 6 times larger than those of SGR 1935+2154; using this, we have estimated a lower limit on the volumetric rate of FRBs with luminosities erg s-1. We found this to be in good agreement with the rate estimated by Bochenek et al. (2020) using the SGR 1935+2154 radio burst, suggesting that many low-luminosity FRBs could be produced by magnetars. Lastly, we also showed that it is unlikely that most of the repeating FRB progenitors are young millisecond magnetars, and that if we expect millisecond magnetars to be a source of repeating FRBs, we need multiple repeating FRB formation channels.
At a distance of 20 Mpc, FRB 20181030A is one of the closest FRBs discovered to date. In principle, it should be possible to detect prompt multi-wavelength counterparts as predicted by several FRB models (Yi et al., 2014; Burke-Spolaor, 2018; Chen et al., 2020; Nicastro et al., 2021). Therefore, we strongly encourage multi-wavelength follow-up of FRB 20181030A.
CHIME, Fermi, GTC, VLA
References
- Arora et al. (2021) Arora, N., Stone, C., Courteau, S., & Jarrett, T. H. 2021, arXiv e-prints, arXiv:2105.01660
- Asplund et al. (2009) Asplund, M., Grevesse, N., Sauval, A. J., & Scott, P. 2009, ARA&A, 47, 481
- Astropy Collaboration et al. (2013) Astropy Collaboration, Robitaille, T. P., Tollerud, E. J., et al. 2013, A&A, 558, A33
- Astropy Collaboration et al. (2018) Astropy Collaboration, Price-Whelan, A. M., Sipőcz, B. M., et al. 2018, AJ, 156, 123
- Bade et al. (1998) Bade, N., Engels, D., Voges, W., et al. 1998, Astronomy and Astrophysics Supplement Series, 127, 145
- Bailes et al. (2021) Bailes, M., Bassa, C. G., Bernardi, G., et al. 2021, MNRAS, 503, 5367
- Bauer et al. (2000) Bauer, F. E., Condon, J. J., Thuan, T. X., & Broderick, J. J. 2000, ApJS, 129, 547
- Bhardwaj et al. (2021) Bhardwaj, M., Gaensler, B. M., Kaspi, V. M., et al. 2021, ApJ, 910, L18
- Bochenek et al. (2020) Bochenek, C. D., Ravi, V., Belov, K. V., et al. 2020, arXiv e-prints, arXiv:2005.10828
- Bohlin et al. (1995) Bohlin, R. C., Colina, L., & Finley, D. S. 1995, AJ, 110, 1316
- Buat et al. (2007) Buat, V., Takeuchi, T. T., Iglesias-Páramo, J., et al. 2007, ApJS, 173, 404
- Burke-Spolaor (2018) Burke-Spolaor, S. 2018, Nature Astronomy, 2, 845
- Byler et al. (2017) Byler, N., Dalcanton, J. J., Conroy, C., & Johnson, B. D. 2017, ApJ, 840, 44
- Calzetti et al. (2000) Calzetti, D., Armus, L., Bohlin, R. C., et al. 2000, ApJ, 533, 682
- Cardelli et al. (1989) Cardelli, J. A., Clayton, G. C., & Mathis, J. S. 1989, ApJ, 345, 245
- Carnall et al. (2019) Carnall, A. C., Leja, J., Johnson, B. D., et al. 2019, ApJ, 873, 44
- Chatterjee et al. (2005) Chatterjee, S., Vlemmings, W., Brisken, W., et al. 2005, The Astrophysical Journal Letters, 630, L61
- Chatterjee et al. (2017) Chatterjee, S., Law, C., Wharton, R., et al. 2017, Nature, 541, 58
- Chen et al. (2020) Chen, G., Ravi, V., & Lu, W. 2020, arXiv preprint arXiv:2004.10787
- CHIME/FRB Collaboration (2021) CHIME/FRB Collaboration. 2021, The Astronomer’s Telegram, 14497, 1
- CHIME/FRB Collaboration et al. (2018) CHIME/FRB Collaboration, Amiri, M., Bandura, K., et al. 2018, ApJ, 863, 48
- CHIME/FRB Collaboration et al. (2019a) CHIME/FRB Collaboration, Andersen, B. C., Band ura, K., et al. 2019a, ApJ, 885, L24
- CHIME/FRB Collaboration et al. (2019b) CHIME/FRB Collaboration, Andersen, B. C., Bandura, K., et al. 2019b, ApJ, 885, L24
- CHIME/FRB Collaboration et al. (2020a) CHIME/FRB Collaboration, Amiri, M., Andersen, B. C., et al. 2020a, Nature, 582, 351
- CHIME/FRB Collaboration et al. (2020b) CHIME/FRB Collaboration, :, Andersen, B. C., et al. 2020b, arXiv e-prints, arXiv:2005.10324
- Clark et al. (2018) Clark, C. J. R., Verstocken, S., Bianchi, S., et al. 2018, A&A, 609, A37
- Condon et al. (1998) Condon, J. J., Cotton, W., Greisen, E., et al. 1998, The Astronomical Journal, 115, 1693
- Condon et al. (1998) Condon, J. J., Yin, Q. F., Thuan, T. X., & Boller, T. 1998, AJ, 116, 2682
- Conroy et al. (2009) Conroy, C., Gunn, J. E., & White, M. 2009, ApJ, 699, 486
- Cordes & Lazio (2002) Cordes, J. M., & Lazio, T. J. W. 2002, arXiv preprint astro-ph/0207156
- Cruces et al. (2020) Cruces, M., Spitler, L. G., Scholz, P., et al. 2020, MNRAS, 500, 448
- Dale & Helou (2002) Dale, D. A., & Helou, G. 2002, ApJ, 576, 159
- Davies et al. (2017) Davies, L. J. M., Huynh, M. T., Hopkins, A. M., et al. 2017, MNRAS, 466, 2312
- de Vaucouleurs et al. (1991) de Vaucouleurs, G., de Vaucouleurs, A., Corwin, Herold G., J., et al. 1991, Third Reference Catalogue of Bright Galaxies (Springer)
- Dey et al. (2019) Dey, A., Schlegel, D. J., Lang, D., et al. 2019, AJ, 157, 168
- Dolag et al. (2015) Dolag, K., Gaensler, B. M., Beck, A. M., & Beck, M. C. 2015, Monthly Notices of the Royal Astronomical Society, 451, 4277
- Draine & Li (2007) Draine, B. T., & Li, A. 2007, ApJ, 657, 810
- Driver et al. (2016) Driver, S. P., Andrews, S. K., Davies, L. J., et al. 2016, The Astrophysical Journal, 827, 108
- Fong et al. (2021) Fong, W.-f., Dong, Y., Leja, J., et al. 2021, arXiv e-prints, arXiv:2106.11993
- Fonseca et al. (2020) Fonseca, E., Andersen, B. C., Bhardwaj, M., et al. 2020, ApJ, arXiv:2001.03595
- Foreman-Mackey et al. (2013) Foreman-Mackey, D., Hogg, D. W., Lang, D., & Goodman, J. 2013, PASP, 125, 306
- Fruchter et al. (2006) Fruchter, A. S., Levan, A. J., Strolger, L., et al. 2006, Nature, 441, 463
- Fukugita et al. (1998) Fukugita, M., Hogan, C., & Peebles, P. 1998, The Astrophysical Journal, 503, 518
- Fullmer & Londsale (1995) Fullmer, L., & Londsale, C. J. 1995, VizieR Online Data Catalog, VII/113
- Gelman et al. (2013) Gelman, A., Carlin, J. B., Stern, H. S., et al. 2013, Bayesian data analysis (CRC press)
- Goldstein et al. (2021) Goldstein, A., Cleveland, W. H., & Kocevski, D. 2021, Fermi GBM Data Tools: v1.1.0, , . https://fermi.gsfc.nasa.gov/ssc/data/analysis/gbm
- Gómez-González et al. (2016) Gómez-González, V. M. A., Mayya, Y. D., & Rosa-González, D. 2016, MNRAS, 460, 1555
- Gómez-Velarde et al. (2016) Gómez-Velarde, G., García-Alvarez, D., & Cabrerra-Lavers, A. 2016, in Astronomical Society of the Pacific Conference Series, Vol. 507, Multi-Object Spectroscopy in the Next Decade: Big Questions, Large Surveys, and Wide Fields, ed. I. Skillen, M. Balcells, & S. Trager, 191
- González-Serrano et al. (2004) González-Serrano, J. I., Sánchez-Portal, M., Castañeda, H., et al. 2004, Experimental Astronomy, 18, 65
- Goodman & Weare (2010) Goodman, J., & Weare, J. 2010, Communications in Applied Mathematics and Computational Science, 5, 65
- Gourdji et al. (2019) Gourdji, K., Michilli, D., Spitler, L. G., et al. 2019, ApJ, 877, L19
- Greco et al. (2018) Greco, J. P., Greene, J. E., Strauss, M. A., et al. 2018, ApJ, 857, 104
- Haakonsen & Rutledge (2009) Haakonsen, C. B., & Rutledge, R. E. 2009, ApJS, 184, 138
- Hafen et al. (2019) Hafen, Z., Faucher-Giguère, C.-A., Anglés-Alcázar, D., et al. 2019, Monthly Notices of the Royal Astronomical Society, 488, 1248
- Hancock et al. (2012) Hancock, P. J., Murphy, T., Gaensler, B. M., Hopkins, A., & Curran, J. R. 2012, Monthly Notices of the Royal Astronomical Society, 422, 1812
- Hancock et al. (2018) Hancock, P. J., Trott, C. M., & Hurley-Walker, N. 2018, Publications of the Astronomical Society of Australia, 35
- Harris et al. (2020) Harris, C. R., Millman, K. J., van der Walt, S. J., et al. 2020, Nature, 585, 357. https://doi.org/10.1038/s41586-020-2649-2
- Heintz et al. (2020) Heintz, K. E., Prochaska, J. X., Simha, S., et al. 2020, arXiv preprint arXiv:2009.10747
- Hinton et al. (2016) Hinton, S. R., Davis, T. M., Lidman, C., Glazebrook, K., & Lewis, G. F. 2016, Astronomy and Computing, 15, 61
- Huchra et al. (1983) Huchra, J., Davis, M., Latham, D., & Tonry, J. 1983, ApJS, 52, 89
- Hunter (2007) Hunter, J. D. 2007, Computing in Science & Engineering, 9, 90
- Iglesias-Páramo et al. (2004) Iglesias-Páramo, J., Buat, V., Donas, J., Boselli, A., & Milliard, B. 2004, A&A, 419, 109
- Iglesias-Páramo et al. (2006) Iglesias-Páramo, J., Buat, V., Takeuchi, T. T., et al. 2006, ApJS, 164, 38
- Intema et al. (2017) Intema, H., Jagannathan, P., Mooley, K., & Frail, D. 2017, Astronomy & Astrophysics, 598, A78
- Johnson et al. (2019) Johnson, B. D., Leja, J. L., Conroy, C., & Speagle, J. S. 2019, Prospector: Stellar population inference from spectra and SEDs, Astrophysics Source Code Library, ascl:1905.025
- Joye & Mandel (2003) Joye, W. A., & Mandel, E. 2003, in Astronomical Society of the Pacific Conference Series, Vol. 295, Astronomical Data Analysis Software and Systems XII, ed. H. E. Payne, R. I. Jedrzejewski, & R. N. Hook, 489
- Kaaret et al. (2020) Kaaret, P., Koutroumpa, D., Kuntz, K. D., et al. 2020, Nature Astronomy, doi:10.1038/s41550-020-01215-w. https://doi.org/10.1038/s41550-020-01215-w
- Kasliwal (2011) Kasliwal, M. 2011, the Gravitational-wave Physics and Astronomy Workshop,January 26-29, 2011. http://www.gravity.phys.uwm.edu/conferences/gwpaw/program/talks.html
- Keane et al. (2016) Keane, E. F., Johnston, S., Bhandari, S., et al. 2016, Nature, 530, 453
- Keating & Pen (2020) Keating, L. C., & Pen, U.-L. 2020, MNRAS, 496, L106
- Kennicutt et al. (1994) Kennicutt, Robert C., J., Tamblyn, P., & Congdon, C. E. 1994, ApJ, 435, 22
- Kirsten et al. (2021) Kirsten, F., Marcote, B., Nimmo, K., et al. 2021, arXiv e-prints, arXiv:2105.11445
- Klein et al. (2018) Klein, U., Lisenfeld, U., & Verley, S. 2018, A&A, 611, A55
- Klypin et al. (2016) Klypin, A., Yepes, G., Gottlöber, S., Prada, F., & Heß, S. 2016, MNRAS, 457, 4340
- Kourkchi & Tully (2017) Kourkchi, E., & Tully, R. B. 2017, ApJ, 843, 16
- Kwiatkowski (2015) Kwiatkowski, D. 2015, arXiv e-prints, arXiv:1512.00678
- Lacy et al. (2016) Lacy, M., Baum, S. A., Chandler, C. J., et al. 2016, AAS, 227, 324
- Leitherer (2005) Leitherer, C. 2005, in American Institute of Physics Conference Series, Vol. 761, The Spectral Energy Distributions of Gas-Rich Galaxies: Confronting Models with Data, ed. C. C. Popescu & R. J. Tuffs, 39–58
- Leja et al. (2017) Leja, J., Johnson, B. D., Conroy, C., van Dokkum, P. G., & Byler, N. 2017, ApJ, 837, 170
- Li et al. (2020) Li, C., Lin, L., Xiong, S., et al. 2020, arXiv preprint arXiv:2005.11071
- Li & Zhang (2020) Li, Y., & Zhang, B. 2020, ApJ, 899, L6
- Li et al. (2019) Li, Y., Zhang, B., Nagamine, K., & Shi, J. 2019, ApJ, 884, L26
- Lim et al. (2017) Lim, S. H., Mo, H. J., Lu, Y., Wang, H., & Yang, X. 2017, MNRAS, 470, 2982
- Lorimer et al. (2007) Lorimer, D. R., Bailes, M., McLaughlin, M. A., Narkevic, D. J., & Crawford, F. 2007, Science, 318, 777
- Lu & Kumar (2016) Lu, W., & Kumar, P. 2016, MNRAS, 461, L122
- Lu & Piro (2019) Lu, W., & Piro, A. L. 2019, ApJ, 883, 40
- Luo et al. (2020) Luo, R., Men, Y., Lee, K., et al. 2020, MNRAS, 494, 665
- Lyubarsky (2021) Lyubarsky, Y. 2021, Universe, 7, 56
- Macquart et al. (2020) Macquart, J.-P., Prochaska, J., McQuinn, M., et al. 2020, Nature, 581, 391
- Maller & Bullock (2004) Maller, A. H., & Bullock, J. S. 2004, Monthly Notices of the Royal Astronomical Society, 355, 694
- Mannings et al. (2020) Mannings, A. G., Fong, W.-f., Simha, S., et al. 2020, arXiv e-prints, arXiv:2012.11617
- Maoz (2007) Maoz, D. 2007, MNRAS, 377, 1696
- Marvil et al. (2015) Marvil, J., Owen, F., & Eilek, J. 2015, AJ, 149, 32
- Masters et al. (2014) Masters, K. L., Crook, A., Hong, T., et al. 2014, MNRAS, 443, 1044
- McCall et al. (1985) McCall, M. L., Rybski, P. M., & Shields, G. A. 1985, ApJS, 57, 1
- McMullin et al. (2007) McMullin, J. P., Waters, B., Schiebel, D., Young, W., & Golap, K. 2007, in Astronomical Society of the Pacific Conference Series, Vol. 376, Astronomical Data Analysis Software and Systems XVI, ed. R. A. Shaw, F. Hill, & D. J. Bell, 127
- Mereghetti et al. (2020) Mereghetti, S., Savchenko, V., Ferrigno, C., et al. 2020, arXiv preprint arXiv:2005.06335
- Metzger et al. (2017) Metzger, B. D., Berger, E., & Margalit, B. 2017, ApJ, 841, 14
- Metzger et al. (2019) Metzger, B. D., Margalit, B., & Sironi, L. 2019, Monthly Notices of the Royal Astronomical Society, 485, 4091
- Michilli et al. (2020) Michilli, D., Masui, K. W., Mckinven, R., et al. 2020, arXiv e-prints, arXiv:2010.06748
- Moster et al. (2013) Moster, B. P., Naab, T., & White, S. D. M. 2013, MNRAS, 428, 3121
- Nicastro et al. (2021) Nicastro, L., Guidorzi, C., Palazzi, E., et al. 2021, Universe, 7, 76
- Nicholl et al. (2017a) Nicholl, M., Williams, P. K. G., Berger, E., et al. 2017a, ApJ, 843, 84
- Nicholl et al. (2017b) —. 2017b, ApJ, 843, 84
- Ocker et al. (2020) Ocker, S. K., Cordes, J. M., & Chatterjee, S. 2020, ApJ, 897, 124
- Oke (1974) Oke, J. B. 1974, ApJS, 27, 21
- Oke (1990) —. 1990, AJ, 99, 1621
- Osterbrock & Ferland (2006) Osterbrock, D. E., & Ferland, G. J. 2006, Astrophysics of gaseous nebulae and active galactic nuclei (University Science Books)
- Palmer et al. (2005) Palmer, D. M., Barthelmy, S., Gehrels, N., et al. 2005, Nature, 434, 1107
- Pilyugin & Grebel (2016) Pilyugin, L. S., & Grebel, E. K. 2016, MNRAS, 457, 3678
- Planck Collaboration et al. (2016) Planck Collaboration, Ade, P. A. R., Aghanim, N., et al. 2016, A&A, 594, A13
- Platts et al. (2018) Platts, E., Weltman, A., Walters, A., et al. 2018, arXiv e-prints, arXiv:1810.05836
- Rajwade et al. (2020) Rajwade, K. M., Mickaliger, M. B., Stappers, B. W., et al. 2020, MNRAS, 495, 3551
- Ravi et al. (2021) Ravi, V., Law, C. J., Li, D., et al. 2021, arXiv e-prints, arXiv:2106.09710
- Rengelink et al. (1997) Rengelink, R., Tang, Y., De Bruyn, A., et al. 1997, Astronomy and Astrophysics Supplement Series, 124, 259
- Resmi et al. (2020) Resmi, L., Vink, J., & Ishwara-Chandra, C. H. 2020, arXiv e-prints, arXiv:2010.14334
- Ridnaia et al. (2020) Ridnaia, A., Svinkin, D., Frederiks, D., et al. 2020, arXiv preprint arXiv:2005.11178
- Robitaille & Bressert (2012) Robitaille, T., & Bressert, E. 2012, APLpy: Astronomical Plotting Library in Python, , , ascl:1208.017
- Salo et al. (2015) Salo, H., Laurikainen, E., Laine, J., et al. 2015, ApJS, 219, 4
- Schlafly & Finkbeiner (2011) Schlafly, E. F., & Finkbeiner, D. P. 2011, ApJ, 737, 103
- Schneider et al. (1992) Schneider, S. E., Thuan, T. X., Mangum, J. G., & Miller, J. 1992, ApJS, 81, 5
- Scholz et al. (2020) Scholz, P., Cook, A., Cruces, M., et al. 2020, arXiv preprint arXiv:2004.06082
- Serenelli et al. (2009) Serenelli, A. M., Basu, S., Ferguson, J. W., & Asplund, M. 2009, ApJ, 705, L123
- Simha et al. (2014) Simha, V., Weinberg, D. H., Conroy, C., et al. 2014, arXiv e-prints, arXiv:1404.0402
- Tanoglidis et al. (2021) Tanoglidis, D., Drlica-Wagner, A., Wei, K., et al. 2021, ApJS, 252, 18
- Tauris et al. (2013) Tauris, T. M., Sanyal, D., Yoon, S. C., & Langer, N. 2013, A&A, 558, A39
- Taylor et al. (2014) Taylor, M., Cinabro, D., Dilday, B., et al. 2014, ApJ, 792, 135
- Tempel et al. (2016) Tempel, E., Kipper, R., Tamm, A., et al. 2016, A&A, 588, A14
- Tendulkar et al. (2017) Tendulkar, S. P., Bassa, C., Cordes, J. M., et al. 2017, The Astrophysical Journal Letters, 834, L7
- The CHIME/FRB Collaboration et al. (2021) The CHIME/FRB Collaboration, :, Amiri, M., et al. 2021, arXiv e-prints, arXiv:2106.04352
- Thornton et al. (2013) Thornton, D., Stappers, B., Bailes, M., et al. 2013, Science, 341, 53
- Tody (1986) Tody, D. 1986, in Instrumentation in astronomy VI, Vol. 627, International Society for Optics and Photonics, 733–748
- Tody (1993) Tody, D. 1993, in Astronomical Society of the Pacific Conference Series, Vol. 52, Astronomical Data Analysis Software and Systems II, ed. R. J. Hanisch, R. J. V. Brissenden, & J. Barnes, 173
- Truemper (1982) Truemper, J. 1982, Advances in Space Research, 2, 241
- Tully (2015) Tully, R. B. 2015, AJ, 149, 171
- Tully et al. (2016) Tully, R. B., Courtois, H. M., & Sorce, J. G. 2016, AJ, 152, 50
- Tumlinson et al. (2017) Tumlinson, J., Peeples, M. S., & Werk, J. K. 2017, ARA&A, 55, 389
- Ueda et al. (2001) Ueda, Y., Ishisaki, Y., Takahashi, T., Makishima, K., & Ohashi, T. 2001, ApJS, 133, 1
- van den Bergh et al. (2005) van den Bergh, S., Li, W., & Filippenko, A. V. 2005, PASP, 117, 773
- von Kienlin et al. (2020) von Kienlin, A., Meegan, C. A., Paciesas, W. S., et al. 2020, ApJ, 893, 46
- Williams & Berger (2016) Williams, P. K. G., & Berger, E. 2016, ApJ, 821, L22
- Worthey (1994) Worthey, G. 1994, ApJS, 95, 107
- Yamasaki & Totani (2020) Yamasaki, S., & Totani, T. 2020, The Astrophysical Journal, 888, 105
- Yao et al. (2017) Yao, J., Manchester, R., & Wang, N. 2017, The Astrophysical Journal, 835, 29
- Yaron et al. (2020) Yaron, O., Ofek, E., Gal-Yam, A., & Sass, A. 2020, Transient Name Server AstroNote, 70, 1
- Yi et al. (2014) Yi, S.-X., Gao, H., & Zhang, B. 2014, The Astrophysical Journal Letters, 792, L21
- Zhou et al. (2020) Zhou, P., Zhou, X., Chen, Y., et al. 2020, ApJ, 905, 99
- Zou et al. (2019) Zou, H., Gao, J., Zhou, X., & Kong, X. 2019, ApJS, 242, 8
Appendix A MCMC Simulation
We performed an MCMC simulation to estimate the maximum redshift of FRB 20181030A. We used a likelihood defined by the relation, DMFRB = DMhost/(1+z) + DMMW + DMMW,halo + DMIGM, where DMFRB = 103.5 0.3 pc cm-3. Table 8 summarizes the individual DM components and their respective priors. Similar to Keane et al. (2016) and Williams & Berger (2016), we modelled the Milky Way disk DM (DMMW) as a Gaussian with a mean equal to the minimum of the two Galactic DM model predictions = 33 pc cm-3 (see Table 2; the maximum redshift estimate would be larger, and so more conservative), and a standard deviation () = 20% of the mean DMMW value, a commonly assumed uncertainty for both the models (Cordes & Lazio, 2002; Yao et al., 2017). Moreover, this is in agreement with the maximum DM estimate of the Milky Way disk along the FRB sight-line using the estimate from Ocker et al. (2020) (see §2.1). For DMMW,halo, we assumed a Gaussian distribution such that at 3, the DMMW,halo is either 0 or 80 pc cm-3. This choice is motivated to account for the large uncertainty in the Milky Way halo DM contribution (Keating & Pen, 2020).
For DMhost, we assumed a log-normal probability distribution as suggested by Macquart et al. (2020),
| (A1) |
with e = 68.2 pc cm-3 and = 0.88. Similarly, for DMIGM, we use a semi-analytical model that Macquart et al. (2020) computed to quantify the uncertainty in DMIGM at a given redshift (z):
| (A2) |
where , C0 is the normalization constant, = 0.2 z-0.5 , , , and is the average DMIGM estimate which is a function of redshift and assumed cosmology999We adopt the Planck cosmological parameters (Planck Collaboration et al., 2016)., defined in Equation 2 of Macquart et al. (2020).
For the MCMC sampling, we used the emcee package (Foreman-Mackey et al., 2013), which implements an affine-invariant sampling algorithm proposed by Goodman & Weare (2010). We use 256 walkers of 20,000 samples after discarding 1000 burn-in samples from each walker, and thinned the samples by a factor of 100. To assess the convergence of the samplings, we estimated the mean proposal acceptance fraction = 42%, and the chain autocorrelation length 1.43. Both of the estimates are within the acceptable range. Lastly, we also estimated convergence criterion for the redshift parameter, which implies good convergence of the MCMC (Gelman et al., 2013).
From the MCMC analysis, we marginalized the redshift posterior over all other priors and calculated a one-sided 95% Bayesian credible upper limit = 0.05. This is the maximum redshift of FRB 20181030A used in our analysis.
| Parameter | Symbol | Units | Prior |
|---|---|---|---|
| Host galaxy redshift | z | U(10-4,1) | |
| Host galaxy DM | DMhost | pc cm-3 | LN(e68.2,0.88) |
| Milky way DM | DMMW | pc cm-3 | N(33, 20%33 ) |
| Milky way halo DM | DMMW,halo | pc cm-3 | N(40,33.33%40) |
| IGM DM | DMIGM | pc cm-3 | Equation 4 from Macquart et al. (2020) |
Appendix B Long-slit spectroscopy of NGC 3252
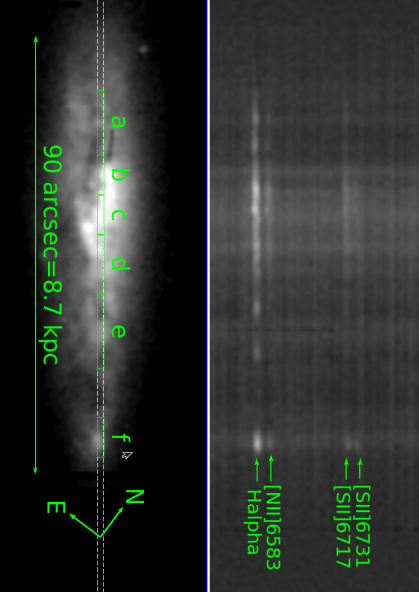
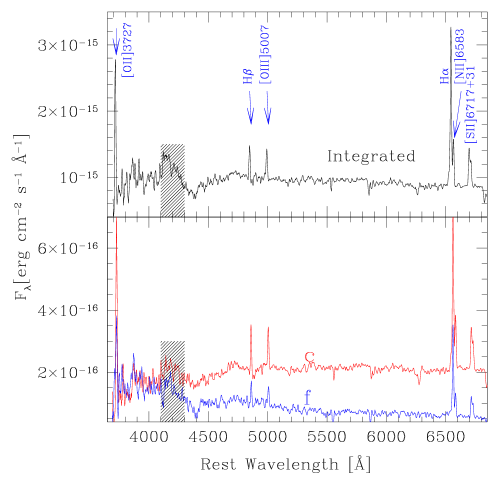
We acquired the long-slit data of NGC 3252 in order to estimate the physical properties of NGC 3252, such as nebular metallicity and dust extinction. Here we discuss the steps for reducing the NGC 3252 longslit spectroscopy data. In Figure 7, we show the zones used for the extraction of spectra along the long-slit. H and other nebular lines are traced over a zone of 90″ (8.7 kpc) which covers the entire bright optical extent of the galaxy. Several emission knots are seen along the slit, especially in the H spectral image. Each knot represents an Hii region in the host galaxy. The presence of these Hii regions allows us to obtain physical quantities along the slit using the physics of photoionized nebulae (Osterbrock & Ferland, 2006). In order to maximize the S/N ratio of the extracted spectra, we defined six zones, identified by letters a–f, in such a way that each zone contains at least one of the emission knots. The zone c spectrum contains the nucleus, and the zone f spectrum corresponds to a bright Hii region to the south-west of the nucleus. This Hii region lies almost at the center of the 90% localization ellipse of the FRB source shown in Figure 2. In the right panel, we show the extracted spectrum for these two regions. Each extracted spectrum was analyzed to measure the fluxes of bright nebular lines using the Gaussian fitting technique of the splot task in iraf, which also performs a measurement and subtraction of continuum flux. The prominent lines in the spectrum were identified and are shown in the top panel. A deblending algorithm was used to extract accurate fluxes of [NII]6548 and [NII]6583 lines in the presence of the bright H line and also to resolve the [SII] doublet.
The measured line fluxes in each spectrum are given in Table 9. The spectra were first corrected for Doppler shift using a mean of the recessional velocities measured using the H, H and [OIII]5007 lines in each spectrum. The measured velocities are also given in Table 9. All the six rest frame spectra were summed to get an integrated spectrum of the galaxy, which is shown in the top-right panel in Figure 7. Values measured for the integrated spectrum are given in the last column of Table 9. The mean of the velocities of the six extracted spectra was taken as the velocity of the integrated spectrum, which agrees very well with the systemic velocity of 11566 km s-1 reported in NED (Schneider et al., 1992). The H and H emission line fluxes stated in Table 9 are used to obtain the visual extinction experienced in each zone, shown in Figure 7, following the Balmer decrement method for case B recombination of a typical photo-ionized nebula ( =10000 K, =100 cm-3; Osterbrock & Ferland, 2006) and the reddening curve of Cardelli et al. (1989). We corrected the observed H and H fluxes for the effects of the underlying stellar absorption by assuming an absorption equivalent width of 2 Å following McCall et al. (1985). The resulting values vary between 0.8–1.6 mag in the zones along the slit. The line fluxes were corrected for the measured extinction and are given as ratios with respect to the flux of the H line, which is multiplied by 100 following the normal convention.
Electron temperature-sensitive Auroral lines were not detected in any of the extracted spectra. However, nebular lines for the determination of the oxygen and nitrogen abundances using the strong-line method are detected with S/N 10. We used the calibrations of Pilyugin & Grebel (2016) for this purpose (their Equations 4 and 13). The resulting values of 12+(O/H) are given in Table 9 for each zone as well as that measured in the integrated spectrum.
| Quantitya | a | b | c | d | e | f | Integrated |
|---|---|---|---|---|---|---|---|
| R.A.(J2000) | 10:34:25.50 | 10:34:23.94 | 10:34:22.73 | 10:34:21.27 | 10:34:19.26 | 10:34:16.11 | |
| Dec.(J2000) | +73:46:05.0 | +73:45:56.4 | +73:45:49.7 | +73:45:41.6 | +73:45:30.5 | +73:45:13.1 | |
| Area[] | 13.31.2 | 8.21.2 | 8.21.2 | 12.31.2 | 15.31.2 | 8.21.2 | 65.51.2 |
| I([OII]3727) | 38.5 4.6 | 556.7 3.7 | 498.2 11.1 | 769.8 9.5 | 412.4 8.2 | 168.7 0.3 | 437.0 4.5 |
| I(H) | 100.0 | 100.0 | 100.0 | 100.0 | 100.0 | 100.0 | 100.0 |
| I([OIII]5007) | 79.8 0.1 | 51.7 4.0 | 84.2 2.8 | 89.3 1.3 | 51.4 5.6 | 74.0 0.5 | 77.4 1.0 |
| I(H) | 287.0 53.1 | 287.0 66.3 | 287.0 29.8 | 287.0 38.8 | 287.0 75.0 | 287.0 37.4 | 287.0 32.2 |
| I([NII]6583) | 96.1 14.1 | 82.7 16.1 | 89.9 7.6 | 87.7 9.3 | 69.0 8.2 | 61.9 4.1 | 80.6 7.0 |
| I([SII]6717) | 53.8 5.9 | 61.7 9.5 | 62.2 4.1 | 67.8 6.7 | 58.2 2.9 | 63.5 3.0 | 60.6 3.7 |
| I([SII]6731) | 25.1 0.1 | 42.5 4.6 | 47.4 2.1 | 45.9 3.2 | 44.9 1.2 | 41.6 0.1 | 45.0 0.3 |
| logF(H)[erg cm-2 s-1] | 14.500.20 | 14.25 0.19 | 14.25 0.11 | 14.020.14 | 14.28 0.29 | 14.62 0.16 | 13.50 0.11 |
| [mag] | 0.9 0.4 | 1.4 0.4 | 0.9 0.2 | 1.6 0.2 | 1.6 0.4 | 0.8 0.3 | 1.3 0.2 |
| EW(H)[Å] | 12.4 | 11.1 | 7.3 | 3.3 | 2.9 | 8.6 | 5.8 |
| Velocity [km s | 1073 43 | 1105 49 | 1056 35 | 1125 15 | 1166 57 | 1274 50 | 1133 79 |
| 12+log(O/H) | 8.64 0.05 | 8.38 0.05 | 8.46 0.05 | 8.38 0.05 | 8.37 0.05 | 8.49 0.05 | 8.44 0.05 |
a In the first block, center coordinates of the rectangular zones (named a to f; see Figure 3) chosen for the extraction of spectra are given. The next block contains the extinction corrected fluxes of prominent nebular lines relative to the flux of the H line, i.e. I()=100 F()/F(H). The last block contains the extinction-corrected H flux and physical quantities derived from the diagnostics of the nebular lines.
Appendix C Stellar Population Synthesis Using Prospector
We infer several physical properties of NGC 3252 (at 20 Mpc) using a python-based Bayesian inference code, Prospector (Leja et al., 2017; Johnson et al., 2019), which estimates galaxy properties using stellar population synthesis models defined within the framework of the Flexible Stellar Populations Synthesis (FSPS) stellar populations code (Conroy et al., 2009). Prospector provides an MCMC framework via emcee to fit observed spectral energy distributions (SEDs) and estimate posterior distribution for each free-parameters. In this paper, we use Prospector to estimate the stellar mass, metallicity, and mass-weighted stellar population age of NGC 3252. We use 17 broadband filters from the GALEX FUV filter at 1549 Å through the Herschel telescope bands that provide coverage at far-infrared wavelengths as shown in Figure 4 and Table 11.
| Parameter | Description | Prior |
|---|---|---|
| log(M/M⊙) | total stellar mass formed | uniform: min=8, max=11 |
| log(Z/Z⊙) | stellar metallicity | Gaussian: mean=-0.25, =0.21 |
| dust2 | diffuse V-band dust optical depth | top-hat: min=0.0, max=3.0 |
| t | stellar population age of NGC 3252 | top-hat: min=0.01, max=13.6 |
| e-folding time of the SFH | uniform: min=0.1, max=30 |
| Instrumentc | Filter | Effective Wavelength | Flux densitya,b |
|---|---|---|---|
| Å | maggies | ||
| GALEX | FUV | 1549 | 4.38 |
| NUV | 2304 | 5.56 | |
| DESId | g | 4670 | 4.98 |
| r | 6156 | 9.26 | |
| z | 8917 | 1.41 | |
| 2MASS | J | 12319 | 1.75 |
| H | 16420 | 1.79 | |
| Ks | 21567 | 1.67 | |
| WISE | W1 | 33461 | 9.75 |
| W2 | 45952 | 6.33 | |
| W3 | 115526 | 1.99 | |
| W4 | 220783 | 2.50 | |
| Herschel | PACS(Green) | 979036 | 8.40 |
| PACS(RED) | 1539451 | 1.13 | |
| SPIRE(PSW) | 2428393 | 5.87 | |
| SPIRE(PMW) | 3408992 | 3.00 | |
| SPIRE(PLW) | 4822635 | 1.27 |
a Note that 1 maggie is defined as the flux density in Janskys divided by 3631. Fluxes at Å are corrected for Galactic extinction according to the prescription of Schlafly & Finkbeiner (2011).
b All broadband fluxes are assigned a 20% fractional uncertainty.
c Except for the DESI survey, all instruments’ flux densities are obtained from the aperture-matched photometry catalog of nearby galaxies by Clark et al. (2018).
d For DESI filter magnitudes, we used the photometric redshift catalog by Zhou et al. (2020).
All flux densities are estimated after correcting for the Milky Way extinction. We fit a delayed- star formation history model (Simha et al., 2014; Carnall et al., 2019) with five free parameters metallicity, mass-weighted stellar population age, star formation timescale, and V-band optical extinction (= 1.086 dust2), which are described in Table 10. In this model, the star-formation history is proportional to t), where t is the time since the formation epoch of the galaxy, and is the characteristic decay time of our star-formation history. Additionally, we enabled nebular emission (Byler et al., 2017) and dust emission (Draine & Li, 2007) models in the FSPS framework along with a standard dust attenuation model from Calzetti et al. (2000). Finally, all five parameters are given standard Prospector priors, except log(Z/Z⊙), which is informed by the constraints derived in §2.4. This is included to reduce the effect of the age-metallicity degeneracy (Worthey, 1994). We used a Gaussian prior to model log(Z/Z⊙) with mean derived in §2.4 using optical spectral lines. However, we increased the value by a factor of three to account for any potential bias in converting the oxygen abundance to nebular metallicity, a conservative choice given that the conversion error is typically (Serenelli et al., 2009), which is less than one sigma error on the , i.e. 0.07 (see Table 6).
Using this framework, we derived a metallicity fraction, = , and the present-day stellar mass of the galaxy = . To estimate the best-fitted mass-weighted stellar population age value, we used Equation 5 of Carnall et al. (2019) and found it to be 4.8 Gyr. All these values are provided in Table 6. Note that the quoted uncertainties in all cases are 1 values.