Cooling Delays from Iron Sedimentation and Iron Inner Cores in White Dwarfs
Abstract
Do white dwarfs have inner cores made of iron? Neutron rich nuclei like 56Fe experience a net gravitational force and sediment toward the core. Using new phase diagrams and molecular dynamics simulations, we show that 56Fe should separate into mesoscopic Fe-rich crystallites due to its large charge relative to the background.
1 Introduction
Recent observations of Galactic white dwarfs (WD) with Gaia, such as those resolving the latent heat released by core crystallization and the discovery of the Q-branch, have renewed interest in the physics of core crystallization and sedimentation of neutron rich nuclei (Cheng et al., 2019; Tremblay et al., 2019). While 22Ne (mass fraction ) is the dominant sedimentary heat source, 56Fe () may be important at early times, as the greater neutron excess gives twice the heating per nucleus and a faster sedimentation timescale (Isern et al., 1991; Bildsten & Hall, 2001).
At a fixed electron density, nuclei with higher charges experience stronger Coulomb interactions and thus generally separate and crystallize first in a mixture. For example, Horowitz & Caplan (2021) argue that actinides may separate into microgram-scale crystallites in the cores of WDs at roughly twice the C/O crystallization temperature. Consider the coupling parameter as an effective temperature (nuclear charge , Wigner-Seitz radius with electron number density , and temperature ). Iron, with will be strongly supercooled in the C/O background long before the onset of C/O crystallization.
Recently, Bauer et al. (2020) showed that single particle diffusion of 22Ne is insufficient to produce the observed Q-branch heating assuming solar metallicity, but 22Ne ‘clusters’ of to nuclei can enhance the sedimentation rate to appropriate timescales. However, Caplan et al. (2020) showed that 22Ne does not strongly separate from the C/O background, as only nuclei with a larger charge (relative to the background) can strongly separate due to the entropy of mixing. Nevertheless, Bauer et al. (2020) laid the framework to seriously consider precipitates and their sizes in WDs, which we are motivated to consider in more detail in this work.
Existing phase diagrams suggest that strong eutectic separation occurs in binary mixtures with charges , with two solid phases available: (1) a nearly pure phase of nuclei, and (2) an alloy of and nuclei which is enhanced in nuclei relative to the background (Ogata et al., 1993; Segretain & Chabrier, 1993; Medin & Cumming, 2010, 2011). As , it is clear that we should expect Fe to separate despite its low number abundance. Crystallites, once formed, grow quickly as Fe nuclei from the background adsorb onto the surface. While such crystallites have enhanced sedimentation (Bauer et al., 2020), they may also encounter each other and combine to form aggregations which rapidly precipitate to the core. Thus, sedimentation may proceed quickly after the onset of crystallization.
In this work we consider the precipitation of 56Fe crystals, and show that they will reach mesoscopic sizes, collecting in the center of the star to form an Fe core of order 100 km and , with broad implications for cosmochronology (from the cooling delay from sedimentary heating) and asteroseismology (from the stratification of the WD).
While we consider only the separation of Fe from C/O mixtures, given the large charge ratio the discussion generalizes to higher mass O/Ne/Mg WDs. In sec. 2 we present the ternary C/O/Fe phase diagram which we verify with molecular dynamics in sec. 3. We discuss the implications for WD structure in secs. 4 and 5.
2 C/O/Fe phase diagram
We begin by calculating a ternary phase diagram to determine what Fe-alloys coexist with a C/O liquid. We use the method of Medin & Cumming (2010), which has been used extensively to predict the separation of ternary mixtures in our past work (Caplan et al., 2018, 2020, code available online111https://github.com/andrewcumming/phase_diagram_3CP). This method is based on analytic fits to the free-energies of mixtures (Ogata et al., 1993), and uses the double tangent construction, which identifies points on the minimum free energy surfaces that share a tangent plane.
In Fig. 1 we show a C/O/Fe phase diagram at one temperature, reported in units of the carbon , ). The composition of the liquid WD can be found in the orange region on the right side, corresponding to a mixture of C/O with trace Fe.
On the C/O axis we observe the expected behavior for C/O separation in the absence of Fe, as liquid coexists with solid , roughly consistent with the two-component C/O phase diagrams from Medin & Cumming (2010) and Blouin et al. (2020). While only the most O-rich C/O mixtures freeze at this temperature, at higher we find three Fe-rich alloys in coexistence with C/O liquids.
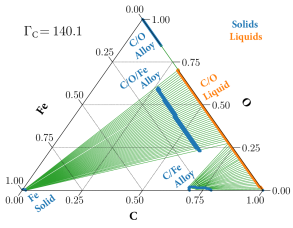
Mixtures with comparable amounts of C and O show coexistence between a C/O liquid with trace Fe and two solid phases. As expected, the charge ratio between the Fe and C/O is between about 3 and 4, depending on the C/O ratio, and such a mixture is known to strongly separate (Caplan et al., 2018). The ‘island’ with Fe abundances near 15% is analogous to the ‘island’ seen in the two-component phase diagrams in Fig. 1 of Medin & Cumming (2011), which uses . Note that by analogy with the two-component system the ‘island’ for the C/O/Fe alloy is actually a loop and so each coexistence line intersects two similar alloys. At , we also observe the formation of a roughly C/Fe alloy that is depleted in O and does not coexist with the pure Fe.
For a realistic WD with and trace Fe, this suggests that two Fe-enhanced solid phases can form in equilibrium with the liquid in the core well before the background begins to crystallize: (1) a pure Fe solid and (2) a 15% Fe alloy. This is in stark contrast with 22Ne, which does not strongly separate from C/O when (Caplan et al., 2020).
The phase diagrams are agnostic about which of these two phases may nucleate as the fluid cools. It is not obvious which is more likely; nucleation of crystals in mixtures is an interesting question and should be explored in future work. While the C/O/Fe alloy has abundant C and O to draw from the liquid, their higher mobility at such low may inhibit growth. Furthermore, the C/O/Fe may need to form a more complicated lattice structure than a simple body-centered cubic (bcc) and may favor very specific ratios of components; e.g. Engstrom et al. (2016) predicts a hexagonal FeO3C2 crystal is stable. For the pure Fe phase to nucleate it may require a rare thermal fluctuation where a large number of Fe come together, though this number may be small given the high . In either case, the solid phase has a neutron excess relative to the background and will sink. While the discussion that follows focuses on the pure Fe, a C/O/Fe alloy with an equivalent number of Fe nuclei would be roughly twice as massive but produce the same sedimentary heating.
3 Molecular Dynamics
Our method is the same as in Caplan et al. (2018). Nuclei are point particles with separation in a periodic cubic volume interacting through a Coulomb potential with electron screening length evolved using velocity Verlet.
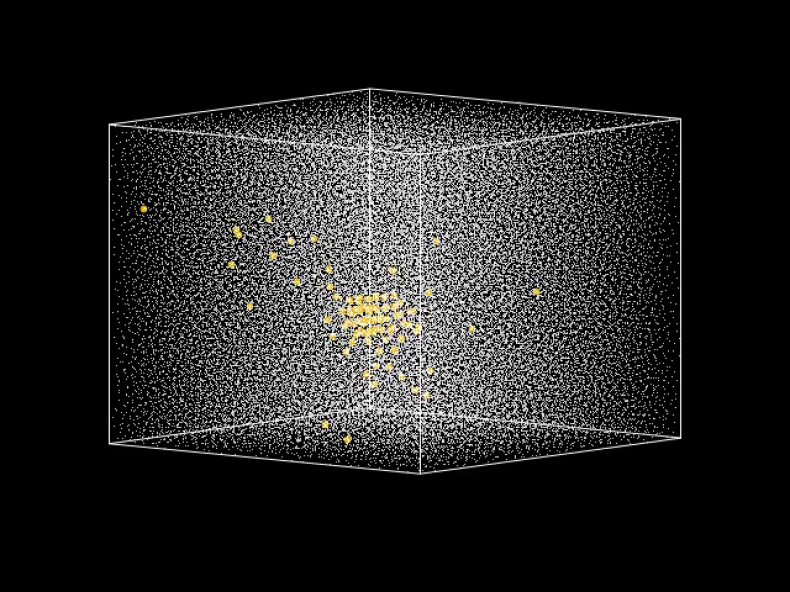
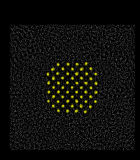
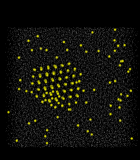
We report on MD simulations with (with nuclei) and (). As nucleation can take a long time, we begin with all of the Fe in a bcc lattice surrounded by equal amounts of C and O, as in Caplan et al. (2018) and Fig. 2. When evolved, nuclei desorb from the crystal into the gas until equilibrium concentrations are found. As MD runtimes scale with it is difficult to run simulations with realistic Fe abundances () for sufficiently many timesteps to reliably equilibrate.
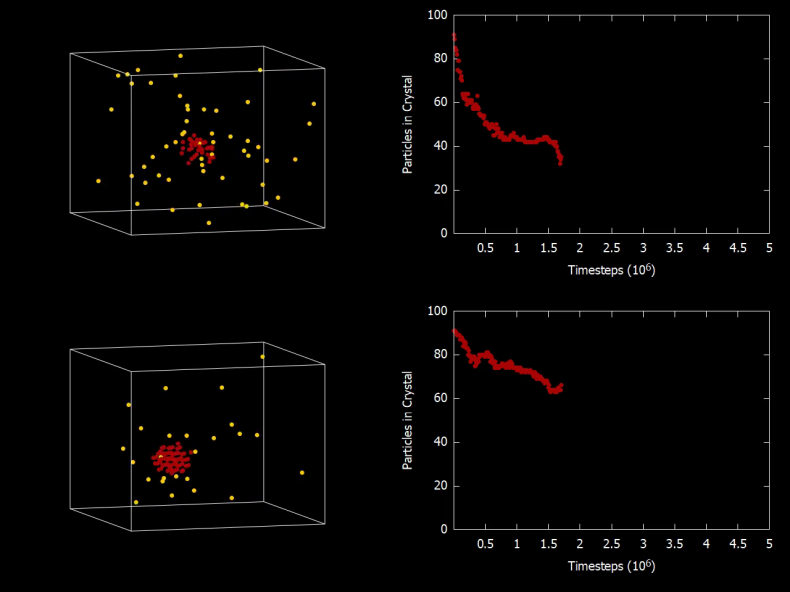
Simulations were evolved at constant temperature until either the crystal melted (indicating ), or until the size of the crystal remained constant for MD timesteps (indicating equilibrium). The size of the crystal was determined with a cluster algorithm and the ratio of the number of Fe in the crystal to the total number of Fe in the simulation allows us to estimate the fraction that precipitates . The cluster size fluctuates due to stochastic adsorption and desorption; has about uncertainty. Animations of these simulations are available in the supplemental materials.222Supplemental material for this preprint available online at
https://www.phy.ilstu.edu/~mcaplan/iron-wd-cores/.
Table 1 summarizes our results.
| ID | |||
| 1 | (0.499, 0.499, 0.001) | 183 | 0.63 |
| 2 | (0.499, 0.499, 0.001) | 166 | 0.62 |
| 3 | (0.499, 0.499, 0.001) | 152 | 0.00 |
| 4 | (0.499, 0.499, 0.001) | 141 | 0.00 |
| 5 | (0.492, 0.492, 0.015) | 185 | 0.77 |
| 6 | (0.492, 0.492, 0.015) | 168 | 0.63 |
| 7 | (0.492, 0.492, 0.015) | 154 | 0.59 |
| 8 | (0.492, 0.492, 0.015) | 143 | 0.00 |
| 9 | (0.738, 0.246, 0.015) | 143 | 0.00 |
| 10 | (0.246, 0.738, 0.015) | 143 | 0.63 |
Our MD finds fair quantitative agreement with the phase diagram above. Simulations at find that the crystal melts rapidly while reach an equilibrium with coexistence. While runs 3 () and 4 () do melt, the crystal survived for many millions of MD timesteps as nuclei slowly desorbed from the surface; this metastability suggests these systems were only weakly superheated and only slightly above the melting temperature. The melting here could also be a consequence of finite size effects, and larger simulations with greater may be stable.
Simulations at constant varying also allow us to probe the robustness of this separation with respect to the background. While the Fe solid persists at , (run 10) it melts quickly in a background of , (run 9). Equivalent runs were also performed using an enhanced with the same results. This is consistent with the prediction from the phase diagram that at high the C/Fe alloy does not coexist with the pure Fe.
In summary, the MD finds some sensitivity to the exact , , and which should be explored in future work. Nevertheless, these simulations show that the phase diagram above is qualitatively accurate and that solids strongly enhanced in Fe may form before conventional C/O crystallization begins.
4 Discussion
Crystallite Growth: We now calculate the characteristic size of the Fe crystallites. Once nucleated, crystals grow through adsorption of Fe diffusing in the background. For simplicity we again consider the pure Fe solid. If nucleation is slow, Fe undergoing Brownian motion in the background encounters the cluster and adsorbs on a diffusive timescale given by , where is the single particle Fe diffusion coefficient, the size of the volume the Fe is taken from, and the growth time. Growth ceases when the cluster falls out of the fluid on a sedimentation timescale given by the cluster sedimentation velocity and the height it falls (e.g. the WD radius),
| (1) |
with being the net gravitational force, the cluster diffusion coefficient, and the temperature (Bauer et al., 2020). Equating timescales, we find the cluster size is independent of and the crystallites fall out with a characteristic number of Fe nuclei
| (2) | ||||
with a density at height of formation with precipitation fraction , using typical scales for a solar mass WD.
If nucleation is fast and many small crystallites form simultaneously then they instead grow by aggregation. Aggregations grow more slowly because diffusion of crystallites is slower than single particle diffusion, so their size is calculated using ,
| (3) | ||||
If the timescales for nucleation and precipitation are comparable, we may expect clusters with between and nuclei which deplete their surroundings of Fe through single-particle diffusion at early times and aggregate later.
These are only rough order-of-magnitude scales. Regardless, it is clear that growth proceeds quickly and mesoscopic clusters with masses between and grams that sink with speeds between a few cm/s and a few m/s are typical. This precipitation timescale is fast; while single-particle sedimentation takes order gigayears, precipitation is faster by and has timescales of days to years, depending on cluster sizes. These clusters accumulate in the core forming an inner core of Fe or a C/O/Fe alloy.
Core mass and radius: We can estimate the size of this inner core by determining what volume of the star will have precipitated its iron when traditional C/O crystallization begins. This will depend on the exact C/O ratio; using the Blouin et al. (2020) C/O phase diagram, we can expect a mixture to begin crystallizing at . Given that Fe precipitation occurs at , a core density of at (assuming an isothermal WD) suggests that precipitation has occurred out to densities of . This density is found 1450 km above the core in a WD, coincidentally at a third the radius of the star and containing a third of the mass of the star. Assuming solar metallicity () and precipitation fraction , we find an inner core mass of if pure Fe precipitates. At average densities of , this inner core is approximately 150 km in diameter. If an alloy of 15-20% Fe forms, we may expect an inner core two to three times more massive, depending on the exact composition.
This estimate may be a lower limit as other processes may transport more Fe into the region where it precipitates before the background freezes and stalls the growth of the inner core. For example, as increases may increase, so clusters may continue to grow while falling through partially depleted regions. Single-particle sedimentation from the upper layers of the star will also enhance the core Fe abundance, which should be possible to model with stellar evolution codes such as MESA. . This may further enhance the abundance of 56Fe in the core, as well as 22Ne which might be expected to form a shell as a sort of ‘outer core’ when it begins to crystallize (Fig. 3).

The onset of C/O crystallization around the Fe core (or, more likely, a Ne-alloy shell), does not necessarily stop the sedimentation process, as Fe precipitation will proceed above. For the purposes of estimating total heating, one should consider the entire Fe content of the star. These crystallites may produce mesoscopic inclusions in whatever crystal surrounds the Fe inner core. It is traditionally assumed that the composition is frozen in once crystallization occurs, but Hughto et al. (2011) finds single-particle diffusion coefficients are only two to three orders of magnitude lower in crystals at than in the strongly-coupled liquid. Even though diffusion in the lattice is exponentially suppressed with temperature, given the fast timescales for sedimentation calculated above it is possible that some of these inclusions could migrate through the shell to reach the Fe core before this process is quenched. Viscoelastic creep and diffusion at crystal grain boundaries is an interesting question which could be studied with MD. Though beyond the scope of this work, assumptions about the behavior of solid phases in WDs should be revisited (see also Mckinven et al. (2016) sec. 3.1).
Cooling Delay: Precipitation may release of order ergs while forming an inner core of . This is obviously sensitive to the metallicity and mass of the WD, so we consider this a rough energy scale. Latent heat from freezing may be comparable to the sedimentation energy and scales with the crystallized mass, and thus is larger for alloys.
We estimate the cooling delay from the luminosity of the WD at the onset of precipitation. The () cooling model of Renedo et al. (2010) reaches core at after 3.3 Gyr. At this luminosity we expect a delay of order 1 Gyr from Fe precipitation prior to traditional C/O crystallization; the luminosity does not change significantly over the course of precipitation ( at core ). Their () cooling model reaches core at in 0.9 Gyr and may produce an order 0.1 Gyr cooling delay. Though perhaps an order of magnitude smaller than the 22Ne delay, this mechanism is rapid and the heat release is large at early times and may be important to include for precision cosmochronology.
5 Summary
Mesoscopic crystallites of Fe should precipitate to the center of WDs to form a macroscopic Fe inner core. This precipitation is a natural consequence of the high charge of Fe relative to C/O which causes it to separate. Solids with high Fe concentrations relative to the background form at temperatures above the C/O crystallization point. This inner core may be either a nearly pure Fe crystal or a C/O/Fe alloy, depending on the exact composition of the star and the nucleation physics. Because this mechanism is efficient, rapidly transporting approximately half the Fe in the star to the core, it is a powerful source of gravitational potential energy to delay cooling and should be modeled with stellar evolution codes like MESA (Paxton et al., 2019; Bauer et al., 2020).
An Fe core could be detectable with asteroseismology. WDs have been observed for decades to pulsate with internal gravity waves ( modes) of low radial order that are roughly evenly spaced in period (see, e.g., Córsico, 2020, for a review). Precise measurements of these periods have been used to estimate their mass, including the mass of their crystal cores, as well as their internal composition profiles (e.g., Metcalfe et al., 2004; Giammichele et al., 2018; Timmes et al., 2018; Córsico et al., 2019). Montgomery & Winget (1999) studied the effect of core crystallization on WD pulsations, and found that modes are unable to penetrate the crystal core. Consequently, the inner boundary of the oscillations moves outward as the crystal core grows, causing an increased mean period spacing with increasing crystal mass fraction. Therefore, at the same luminosity and effective temperature, a WD with a crystal Fe core would exhibit a markedly different oscillation spectrum than one without. In a similar vein, Chidester et al. (2021) recently showed that the g-mode pulsations of low-mass WDs are measurably different when a constant profile of 2% 22Ne is included due to the sensitivity of the equation of state to the electron fraction . A similar (but weaker) effect could be expected with the inclusion of Fe, which is traditionally neglected in WD models. Finally, transitions in the abundances between the non-crystallized zones are well-known to cause “bumps” in the Brunt–Väisälä profile, which causes modulation of -mode periods (e.g., Montgomery & Winget, 1999; Chidester et al., 2021). It may even be possible to determine the composition of the background; greater background charges will decrease the Fe precipitation fraction and also the equilibrium concentrations of Fe in an alloy, and requires future work on phase diagrams of mixtures such as O/Ne/Fe. This motivates including sedimentation, precipitation, and modern phase diagrams in evolutionary models in order to study the core structure of these WDs.
Fe inner cores, if present, may impact the ignition of supernova. As pure Fe does not burn, the ignition would be off-center. A C/O/Fe alloy meanwhile may have abundant C/O available for burning at slightly higher matter densities (and screening) due to the presence of Fe and burning could easily be explored in 2D supernova codes. Similarly, precipitation increases the core density and electron Fermi energy; the most massive WDs may explode in supernova if this effect is large enough to initiate electron capture reactions (Caplan, 2020; Caiazzo et al., 2021).
This mechanism also generalizes to other high nuclei. Despite their low abundance, some high nuclei may separate and precipitate (such as the actinide crystallites considered in Horowitz & Caplan (2021)). Though 56Fe and 22Ne are dominant, there may be several smaller concentric shells ordered radially by decreasing charge.
References
- Bauer et al. (2020) Bauer, E. B., Schwab, J., Bildsten, L., & Cheng, S. 2020, ApJ, 902, 93
- Bildsten & Hall (2001) Bildsten, L., & Hall, D. M. 2001, The Astrophysical Journal Letters, 549, L219
- Blouin et al. (2021) Blouin, S., Daligault, J., & Saumon, D. 2021, ApJ, 911, L5
- Blouin et al. (2020) Blouin, S., Daligault, J., Saumon, D., Bédard, A., & Brassard, P. 2020, A&A, 640, L11. http://dx.doi.org/10.1051/0004-6361/202038879
- Caiazzo et al. (2021) Caiazzo, I., Burdge, K. B., Fuller, J., et al. 2021, Nature, 595, 39
- Camisassa et al. (2020) Camisassa, M. E., Althaus, L. G., Torres, S., et al. 2020, arXiv e-prints, arXiv:2008.03028
- Caplan (2020) Caplan, M. 2020, Monthly Notices of the Royal Astronomical Society, 497, 4357
- Caplan et al. (2018) Caplan, M. E., Cumming, A., Berry, D. K., Horowitz, C. J., & Mckinven, R. 2018, The Astrophysical Journal, 860, 148. https://doi.org/10.3847%2F1538-4357%2Faac2d2
- Caplan et al. (2020) Caplan, M. E., Horowitz, C. J., & Cumming, A. 2020, The Astrophysical Journal, 902, L44. https://doi.org/10.3847/2041-8213/abbda0
- Cheng et al. (2019) Cheng, S., Cummings, J. D., & Ménard, B. 2019, The Astrophysical Journal, 886, 100
- Chidester et al. (2021) Chidester, M. T., Timmes, F. X., Schwab, J., et al. 2021, ApJ, 910, 24
- Córsico (2020) Córsico, A. H. 2020, Frontiers in Astronomy and Space Sciences, 7, 47
- Córsico et al. (2019) Córsico, A. H., De Gerónimo, F. C., Camisassa, M. E., & Althaus, L. G. 2019, A&A, 632, A119
- Engstrom et al. (2016) Engstrom, T. A., Yoder, N. C., & Crespi, V. H. 2016, ApJ, 818, 183
- Giammichele et al. (2018) Giammichele, N., Charpinet, S., Fontaine, G., et al. 2018, Nature, 554, 73
- Horowitz & Caplan (2021) Horowitz, C. J., & Caplan, M. E. 2021, Phys. Rev. Lett., 126, 131101. https://link.aps.org/doi/10.1103/PhysRevLett.126.131101
- Hughto et al. (2011) Hughto, J., Schneider, A. S., Horowitz, C. J., & Berry, D. K. 2011, Phys. Rev. E, 84, 016401
- Isern et al. (1991) Isern, J., Hernanz, M., Mochkovitch, R., & Garcia-Berro, E. 1991, A&A, 241, L29
- Mckinven et al. (2016) Mckinven, R., Cumming, A., Medin, Z., & Schatz, H. 2016, ApJ, 823, 117
- Medin & Cumming (2010) Medin, Z., & Cumming, A. 2010, Phys. Rev. E, 81, 036107
- Medin & Cumming (2011) —. 2011, ApJ, 730, 97
- Metcalfe et al. (2004) Metcalfe, T. S., Montgomery, M. H., & Kanaan, A. 2004, ApJ, 605, L133
- Montgomery & Winget (1999) Montgomery, M. H., & Winget, D. E. 1999, ApJ, 526, 976
- Ogata et al. (1993) Ogata, S., Iyetomi, H., Ichimaru, S., & van Horn, H. M. 1993, Phys. Rev. E, 48, 1344
- Paxton et al. (2019) Paxton, B., Smolec, R., Schwab, J., et al. 2019, The Astrophysical Journal Supplement Series, 243, 10. http://dx.doi.org/10.3847/1538-4365/ab2241
- Renedo et al. (2010) Renedo, I., Althaus, L. G., Miller Bertolami, M. M., et al. 2010, ApJ, 717, 183
- Segretain & Chabrier (1993) Segretain, L., & Chabrier, G. 1993, A&A, 271, L13
- Timmes et al. (2018) Timmes, F. X., Townsend, R. H. D., Bauer, E. B., et al. 2018, ApJ, 867, L30
- Tremblay et al. (2019) Tremblay, P.-E., Fontaine, G., Fusillo, N. P. G., et al. 2019, Nature, 565, 202. https://doi.org/10.1038/s41586-018-0791-x
- Xu & van Horn (1992) Xu, Z. W., & van Horn, H. M. 1992, ApJ, 387, 662
Appendix A Supplemental Materials