Nanoconfined fluids: Uniqueness of water compared to other liquids
Abstract
Nanoconfinement can drastically change the behavior of liquids, puzzling us with counterintuitive properties. Moreover, it is relevant in applications, including decontamination and crystallization control. However, it still lacks a systematic analysis for fluids with different bulk properties. Here we fill this gap. We compare, by molecular dynamics simulations, three different liquids in a graphene slit pore: (A) A simple fluid, such as argon, described by a Lennard-Jones potential; (B) An anomalous fluid, such as a liquid metal, modeled with an isotropic core-softened potential; (C) Water, the prototypical anomalous liquid, with directional hydrogen bonds. We study how the slit-pore width affects the structure, thermodynamics, and dynamics of the fluids. We check that all the liquids, as expected, have a) free-energy minima—hence mechanical stability—for widths that are optimal to accommodate fluid layers, b) mechanically-unstable free-energy maxima for intermediate widths, c) an effective wall-wall repulsion at sub-optimal widths, i.e., for under-sized slit-pores, d) a fluid-mediated attraction for over-sized slit-pores, e) oscillations in diffusion, proportional to those in free-energy, between slower (at the free-energy minima) and faster diffusion (at the free-energy maxima). However, the nature of the free-energy minima for the three fluids is quite different. In particular, i) only for the simple liquid all the minima are energy-driven, while the structural order in the minima increases with decreasing slit-pore width; ii) only for the isotropic core-softened potential all the minima are entropy-driven, while the energy in the minima increases with decreasing slit-pore width; iii) only the water has a changing nature of the minima: the monolayer minimum is entropy-driven, at variance with the simple liquid, while the bilayer minimum is energy-driven, at variance with the other anomalous liquid. Also, water diffusion has a large increase for sub-nm slit-pores, becoming faster than bulk. Instead, the other two fluids have diffusion oscillations much smaller than water. Both the isotropic liquids slow down for decreasing slit-pore width, with the simple liquid near freezing at sub-nm confinement. Our results clarify that nanoconfined water is unique compared to other (simple or anomalous) fluids under similar confinement, and are possibly relevant in nanopores applications, e.g., in water purification from contaminants.
keywords:
Put keywords here1 Introduction
Fluids under nanoconfinement are challenging for understanding because they can show properties that are quite different compared to their bulk counterpart 1, 2, 3, 4, 5, 6, 7, 8, 9, 10, 11. For example, they form layers parallel to the confining surfaces 12, and, when the confinement width is ultrathin, the layers can solidify in peculiar structures 13. In the case of nanoconfined water, freezing can happen both above 14, 15, 16 or below 17, 18 the bulk melting temperature depending on the confining system. Simulations of a monoatomic water model nanoconfined to form only two layers show even dynamical oscillations between the liquid phase and ice 19. Nanoconfined fluids are relevant for their implications in life science and nanotechnology 20, 21, 22, 23, 24, 25, 26, 27, 28, 5, 29, 30, 31, 32, 33, 34, 35, 36, 37, and for applications such as purification of fluids forced through microporous carbon materials 38, 39, 40 nano-lubrication 41, or isotope separation in nuclear power technology 42. The fabrication of nanoscale membranes 43 allow to investigate transport properties at the molecular level, revealing fast permeation of water through carbon nanotubes 44, 45, 46 and through graphene oxide membranes 47, which can be used for filtration of complex mixtures and water disinfection and desalination.
Confined fluids have been studied extensively by numerical simulations in various geometries, including slit, tubular, and cubic pores, with flat or rough walls or with different wall permeabilities, finding relationships between pore size and selectivity 48. In particular, computer simulations show that nano-confinement may influence the dynamical properties of fluids. For example, liquid films of nonpolar molecules, confined between two solid walls, undergo an abrupt change in the diffusion constant and support shear 49, 50, or freeze to a solid as the structured wall 51, when the confinement reduces to a few molecular layers. Experiments confirm the liquid-to-solid transition for simple organic solvents (cyclohexane, octamethylcyclotetrasiloxane, and toluene) under confinement when decreasing from seven to six molecular layers 52, 53.
Molecular dynamics (MD) simulations of a Lennard-Jones (LJ) liquid in slit pores, with widths from 2 to 12 molecular diameters and structureless walls, show a weak increase of the local parallel diffusion for the particles initially within the first layer near the wall 54. By varying pore width at constant chemical potential, both parallel diffusion coefficient and solvation force oscillate and saturate to the bulk value for widths greater than 10 molecular diameters 55, 56. Moreover, both for a LJ liquid 57 and a LJ binary equimolar mixture 58, the self-diffusion coefficient reduces when the confining scale decreases or the interaction of the fluid with the walls increases. However, these results are at variance with those for simple gases confined in carbon nanotubes, where the diffusion coefficient is larger for smaller nanotube diameters 59, 60, 61, 62.
Also, for anomalous liquids 63 and water in carbon nanotubes, the diffusion coefficient changes in a non-monotonic way and the flow can be enhanced 64, 65, 66 with decreasing nanotube diameters 67, especially for diameters below 1 nm 21, 68, 69, 70. On the other hand, previous simulations of water confined in nanotube of different diameters show that the diffusion along the axes decreases for smaller diameters 71.
Contraddictory results have been found also for the shear viscosity of water confined in a graphene nonotube. It monotonically increases for increasing channel diameter 72, 73 or oscillates and decreases for increasing slit pore width, depending on the specific water model 74.
It is, therefore, worth asking how these varieties of different results depend on the details of the fluid interactions or the confining geometry. For example, Striolo finds a relevant difference between the diffusion of simple fluids and water in molecular sieves 75. While the first is dominated by concerted events in which multiple molecules move simultaneously due to the spatial mismatches between pore-fluid and fluid-fluid attractive interactions, the ballistic diffusion of water clusters is a consequence of long-lasting hydrogen bonds (HBs) 75.
Here, we deepen this question and ask which property of water nanoconfined in a graphene-like slit pore is unique and which is shared with other anomalous liquids, or even normal liquids. To this end, we perform MD simulations of the LJ fluid and the Continuous Shouldered Well (CSW) anomalous fluid 76, 77, 78, 79, 80 under slit-pore confinement. The CSW fluid is a coarse-grained model for fluids, including liquid metals or complex liquids 81, with water-like properties associated to the presence of two length scales 77, 78, such as the hydrophobic effect 82. It is used, also, to model hydroxyl groups interactions in methanol 83, 84, 85, and water-hydroxyl groups interactions in water/methanol mixtures 86. A potential similar to the CSW has been used to study the effect of macromolecular crowders in biological media with high concentration of proteins, polysaccharides or nucleic acids 87, 88. Yet, the CSW fluid has not a water-like entropy behavior, as all the other two-length scales isotropic potential, because it has no directional interactions 81, 89. We compare the behavior of these two liquids with that of TIP4P/2005 water, in which, instead, the specific geometry of four charges induce the electrostatic interactions responsible for the HBs along preferred directions.
The TIP4P/2005 water in a graphene slit-pore has free-energy extrema determining diffusion oscillations, with free-energy/diffusion minima for wall-wall distances fitting complete layers, down to one, and maxima at intermediate distances 90. In particular, the free-energy minimum for a monolayer originates from an increase of water disorder, despite the corresponding water internal energy increases. For the bilayer, instead, the free-energy minimum is dominated by a minimum in internal energy per water molecule with a larger order 90. The latter, with a full HB network, is the minimum with the largest mechanical stability 90, rising the question if it would be so also in a fluid without HBs.
2 Results and discussion
We perform MD simulations (see Methods section for details) of three different fluids surrounding a graphene slit-pore (Fig. 1): (A) A simple fluid, described by a LJ potential; (B) An anomalous fluid, with water-like properties but different from water, modeled with the isotropic CSW potential; (C) TIP4P/2005 water. For each fluid, we simulate a box, with periodic boundary conditions, with a slit-pore, centered at the origin of the reference system, made of two parallel graphene sheets of fixed area , separated by a distance and positioned a . We consider nanoscopic slit-pores of width ranging from Å to Å, with Å increments. To reduce the edge effects of the walls, we compute the properties only of the confined fluids with coordinates , and , i.e., within a central sub-volume , where , with Å for the isotropic potentials (A) and (B) and 15 Å for the TIP4P/2005 water (C).
(a)  (b)
(b) 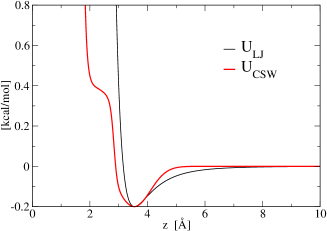
2.1 Structure
We first analyze how the confinement affects the structure of the isotropic liquids. As other confined liquids, the LJ and CSW fluids form layers parallel to the walls, displaying peaks in their density profiles along the normal direction (Figs. S1, S2). The number of layers increases with the distance Å Å between the plates, going from 1 to 4 for the LJ , and from 1 to 5 for the CSW. The presence of two characteristic length scales in the CSW potential leads to the formation of complex patterns 79 and structured peaks, especially at higher densities (not shown), that are absent in the LJ.
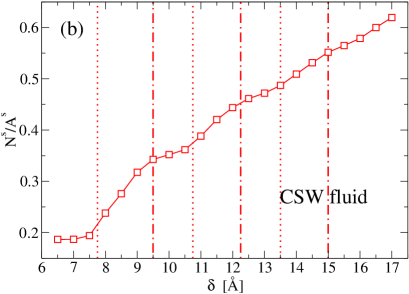
We find that the slit-pore acceptance capacity, defined as the number of confined particles normalized by the sub-volume area , for both fluids has a steplike behavior as a function of (Fig.2 a, c). These steps resemble what has been found for water under similar confinement 91, 90 and it is a result of the layering.
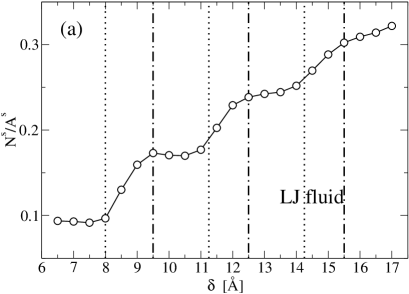

Indeed, the comparison with Figs. S1 and S2 shows that a step starts at values of where a new layer appears (e.g., for the LJ: Å, 11.25 Å, 14.25 Å; for the CSW: Å, 10.75 Å, 13.5 Å). The steps smoothen for larger as the confined fluid becomes less structured.
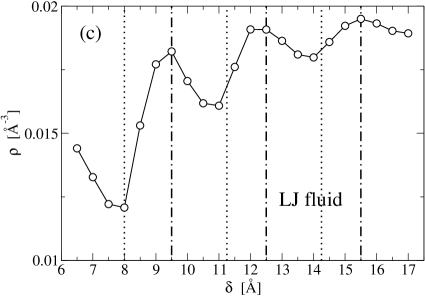
We can emphasize this behavior by analyzing how the mean density of the fluid within the pore changes with (Fig.2 c, d). It shows oscillations, approaching the bulk value for increasing . The mean density reaches minima at those separations where, for an increase of , the fluid starts a new layer and the particles are sucked inside the pore from the reservoir.
For intermediate separations both liquids fill the layers up to reach maxima in , corresponding to optimal plates distances (e.g., for the LJ: Å, 12.5 Å, 15.5 Å; for the CSW: Å, 12.25 Å, 15 Å) where the density profiles display well-formed peaks, sharper and higher than those for slightly different (Figs. S1, S2). A further increase of , up to the value for a new layer, does not increase the acceptance capacity (plateaus in Fig. 2 a, b), leading to a new minimum in . For the CSW fluid, the plateaus of the acceptance capacity and the oscillation in are less pronounced and shifted towards smaller values of (Fig.2 b, d) as a consequence of the interaction soft-core.
As we will discuss in the following sections, these steps and oscillations are associated to oscillatory behaviors in dynamics (vertical lines in Fig.2), hydration forces and thermodynamics. In particular, the relation between structure and entropy can be emphasized by calculating the translational order parameter 92, 93 in each layer , defined as
| (1) |
where is the longitudinal distance , parallel to the walls, in units of the mean interparticle separation , is the fluid density in the layer , and is the longitudinal radial distribution function. For an ideal gas, , hence there is no translational order ().

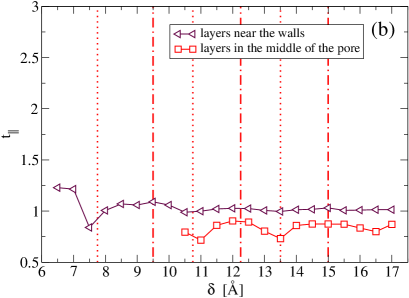
We calculate the parameter separately for the layers in contact with the walls and for the other layers (Fig. 3), finding that both oscillate with and that the contact layers are always more ordered than the inner layers. However, they have maxima and minima at the same values of , showing that the plate separation can regulate the order in the whole confined fluid.
In particular, the layers are more ordered when the mean density of the confined fluid is maximum, i.e., when the is optimal for well-formed layers. The fluid order decreases when the mean density is minimum, corresponding to the appearance/disappearance of a new layer.
For small , when the slit-pore contains only one or two layers of the fluid, has larger oscillations, although for the CSW liquid the variation is weaker, as a consequence of its soft-core. In general, the CSW is always less ordered than the LJ at the same plate separation . However, for both isotropic fluids, the structural oscillations, due to the layering, are determining the translational order, hence the entropy, of the confined liquid and are correlated to its dynamics (vertical lines in Fig. 3). In the next section we show how we locate the vertical lines marking the extrema in the dynamics.
2.2 Dynamics
Next, we analyze how the confinement affects the thermal motion, in the direction parallel to the plates, by calculating the longitudinal diffusion coefficient, , for our three prototypical liquids, as a function of the plates inter-distance , with
| (2) |
where
| (3) |
is the longitudinal mean square displacement, with , is the time spent in the confined sub-region by a particle entering at , and is the average over 10 time-intervals, each made of MD steps (Fig.4).

We observe that the three fluids share three properties:
-
(i)
is not monotonic as a function of ,
-
(ii)
-oscillations are larger for smaller , and
-
(iii)
is not monotonic as a function of the average density (Fig. S4 in Supplementary Material), indicating anomalous behavior.
Because only the water 94 and the CSW fluid 77 can show anomalous diffusion in the bulk, while the LJ fluid cannot, we conclude that these three properties are not necessarily related to the bulk anomalies.
The property (iii) resembles recent results for other confined anomalous-fluid models where it was attributed to the competition of two interaction length-scales 10, 95, the appearance of amorphous phases 95 or the reentrance of the melting line 96. However, here we find it also for the simple fluid without competing length-scales, amorphous phases or reentrant melting, showing that the presence of confinement is enough to get the property (iii), as well as the (i) and (ii), in the three fluids.
Nevertheless, there are relevant differences among the three cases.
-
(iv)
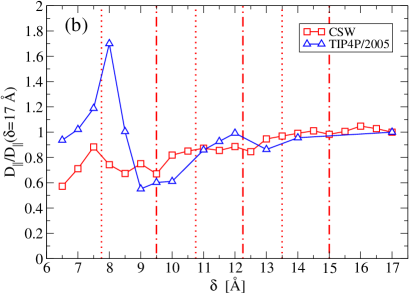
For both isotropic (LJ and CSW) fluids, oscillates but it is always smaller than its bulk value, with a decreasing trend for decreasing . In the case of water, instead, the fastest diffusion is reached at Å, between one and two confined layers 90.
-
(v)
Although both the isotropic fluids have, for the selected state-point, a diffusion coefficient 23 nm2/ns for Å ( times larger than the value for water), the oscillations of in the three fluids are quite different: % for LJ, % for CSW, and % for water.
-
(vi)
For sub-nm confinement ( Å), the minima and maxima of the -oscillations are approximately located at the same separations for the three liquids. However, the oscillations mismatch for Å, being opposite at Å especially comparing LJ and water.
The sub-nm correspondence is better between LJ and water because the size of the LJ particles is equal to that of the LJ-component of the water model, while the CSW soft-core reduces the effective size of the particles and smoothens out the effect. The matching of the oscillations for Å confirms 90 that the steric hindrance (layering) has a major role in determining the dynamics under confinement of a simple liquid, as well as an anomalous liquid. However, this mechanism is no longer enough to rationalize the behavior for larger confinement, as emphasized by the mismatch for Å and the differences highlighted in (iv) and (v). This observation calls for an alternative explanation for the peculiar dynamics of confined water. As we will show in the following, it is related to the unique properties of the water HBs.
2.3 Thermodynamics
2.3.1 Hydration Pressure
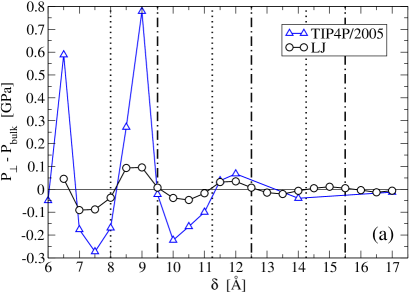
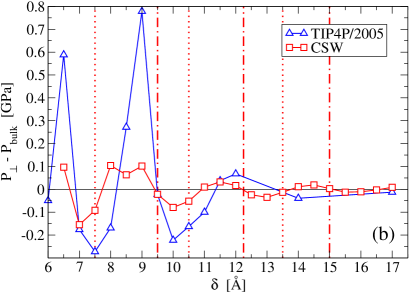
To better understand the differences between the three confined fluids, we calculate the hydration pressure, , as a function of . Here, is the normal pressure that the confined fluid exerts on the plates (Fig.5).
Over the entire range of explored here, we find that oscillates for the three fluids and approaches zero at Å. Hence, at large plates separation the confined fluids behave as in the bulk. When there is an effective repulsion between the plates, while when there is a fluid-mediated attraction. In both cases, the walls are kept fixed in their position by our simulation constraints. The constraint is not necessary when, instead, the walls are at equilibrium, with .
We observe that, for LJ and CSW fluids, the equilibrium -values, at which , coincide, within our numerical precision, with the extrema of . Hence, the system is in equilibrium, not only when the thermal diffusion is minimal, but also when it is maximal. This suggests that the two equilibrium positions have a very different origin, as already observed in the case of water 90.
In particular, if and are the shortest distances for a maximum and a minimum , respectively, displacing the pore-size from induces a change in pressure that tends to restore the wall-to-wall distance. Hence, corresponds to a distance of stable mechanical equilibrium. The opposite occurs around , hence it corresponds to a distance of unstable mechanical equilibrium.
By decreasing from to , increases up to a maximum and, at intermediate distances, decreases toward . Hence, squeezing the fluid toward implies a speedup of the thermal diffusion and a work against the effective wall-wall repulsion.
At the fluid has maximum diffusion at unstable mechanical equilibrium, . Any further squeezing induces an attraction, , between the walls. In this case, the work to reduce is done by the fluid-mediated wall-wall attraction and slows down the thermal parallel diffusion.
Between the two equilibrium values and , for LJ and TIP4P/2005 liquids displays a single peak, while the CSW fluid has two close peaks. This difference can be understood as a signature of the two competing length-scales of the CSW potential. Similar considerations hold for all and , although we find only simple maxima of for the CSW.
We observe that the water has its largest maximum (repulsion) around Å, corresponding to a confined bilayer, with a smaller maximum for the monolayer at Å and the trilayer at Å. For the isotropic fluids, instead, the maxima in for the bilayer and the monolayer are approximately equal and larger than those for more layers, at least within our resolution. This observation suggests that the work to approach the walls for a water bilayer is larger than for a monolayer, while is it approximately the same for the isotropic fluids. This is consistent with the result showing that the water bilayer is more stable than the monolayer 90, and suggests that it is not for the isotropic fluids. To deepen this understanding, we calculate, and compare, the free energy of the confined fluids in the next section.


2.3.2 Free Energy
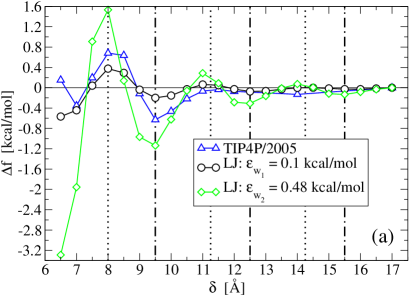
Following Refs. 97, 98, 90, we compute the macroscopic free-energy variation per particle, , as the macroscopic work done against the hydration forces to change the pore size from to , over the molecules, confined within the pore sub-volume of area , as
| (4) |
We numerically calculate from the largest plates separation Å to a generic value , by setting in Eq.(4) Å as our minimal incremental value of (Fig.6.a, b).
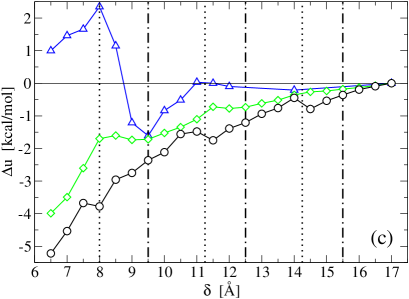
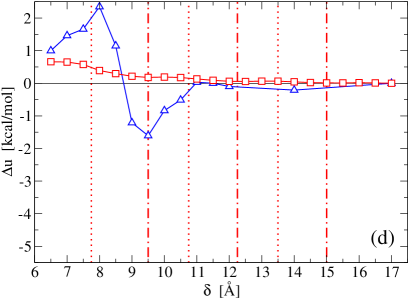
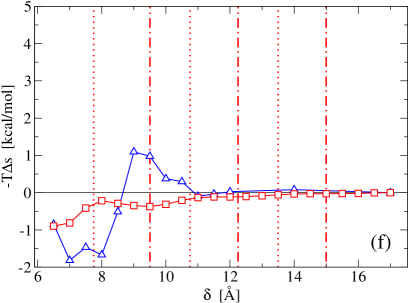
Furthermore, we calculate the variation of the internal-energy per particle of the confined fluid, , where is the internal energy of the confined fluid at plates separation (Fig.6.c, d). Finally, we estimate the variation of the entropy per particle of the confined fluid as (Fig.6.e, f).
We find that the LJ and the CSW fluid present oscillations of in phase with those for the TIP4P/2005 water 111Apart from the oscillation around Å that for water is not observed, possibly, for lack of resolution.. Furthermore, the CSW liquid and the LJ with weaker fluid-wall interaction (LJw, with kcal/mol) are qualitatively very similar, with smoother oscillations for the CSW due to its pronounced soft core, as already observed for (Fig.4). Nevertheless, we observe important differences between the two isotropic fluids and the water.
First, the internal energy, , and entropy, for the isotropic fluids oscillate but never change sign, while they do for water. In particular, for the LJw the is always negative and the is always positive, while for the CSW the signs are inverted. Nevertheless, the two contributions sum up in a similar for both isotropic fluids.
Second, for small pores the for the isotropic fluids has deeper minima. Hence, their stability increases for smaller pore sizes and is maximum for the monolayer. Instead, for water the deeper minimum of is for the bilayer 90.
Third, for the LJw the entropy variation is positive and in average increases for decreasing . Hence, the structural order of these confined liquids increases when the pore size decreases, consistent with our calculations of the longitudinal translational order (Fifg. 3a). For the CSW, is negative and is almost constant (Fifg. 3b), suggesting that the translational order has a minor effect in the calculations of for the confined CSW. For water, instead, is negative for Å for a confined monolayer, and positive for a confined bilayer, around Å 90. Hence, a confined water monolayer is less ordered than bulk water, while a water bilayer maximizes the structural order.
Hence, comparing the three models, we can state that the more stable free energy minimum for water is the bilayer and it is energy driven and more structured than bulk. The monolayer of water is less stable and it is entropy driven. For the isotropic fluids the more stable free energy minimum is for the monolayer: for the LJw it is energy driven, while for the CSW it is entropy driven.
2.3.3 Dependence of the Free Energy on Fluid-Wall Interaction
Qualitative differences in the excess free energy between (SPC/E) water and a LJ fluid have been found also with density functional theory as a function of the fluid-wall interaction, although between face centered cubic (FCC)-structured slabs 99. Hence, to understand how our results depend on the fluid-wall interaction, we consider a LJ liquid with a strong wall-attraction energy (LJs), with kcal/mol (green diamonds in left panels of Fig. 6).
We find that the free energy oscillation for the LJs are stronger than for the LJw, but the minima and maxima occurs, approximately, at the same pore sizes . In particular, the entropy oscillations of the LJs are large, showing that the stronger fluid-wall interaction has a larger structural effect with respect to the LJw case.
This is confirmed when we calculate the longitudinal diffusion coefficient for the LJs (Fig. 7). We find that, at variance with the LJw case (Fig. 4a), the LJs freezes for Å. The parallel diffusivity inside the pore goes to zero when all the fluid layers are frozen, in a distorted triangular lattice, which happens when the peaks of the density profile are completely formed and there are no particles in between (Fig. S4 in Supplementary Material).

Crystallization and dynamic freezing have been found also for water confined into a graphene slit-pore when TIP4P/2005-water is at high pressure ( bar) and a temperature ( K) below the one considered here 100. However, it occurs for a bilayer that, as seen above, is the more stable configuration for confined water. Under these conditions, TIP4P/2005-water crystallizes into a hexagonal bilayer 100 at a temperature that is much above the bulk melting temperature 101222barbar 102.. As a consequence of the large bilayer stability, the confined crystal undergoes reentrant melting when the pore size allows only a water monolayer 100.
These results show that a strong fluid-wall interaction can induce crystallization in both confined LJ and water, however, they do not rationalize the sub-nm speed-up and the bilayer strong-stability that we find in water. Hence, these properties are specific of confined water, possibly related to its unique hydrogen bonds. Indeed, the hydrogen bond network and its specific geometry are held responsible for the crystallization of sub-nm confined water into bilayer ices at ambient conditions in experiments 15, 103, 104 and simulations 105, 106, 29, 107, 108, 109, 110 and its reentrant melting by changing the slit-pore size 105, 106, 100. To understand better how it relates to the sub-nm speed-up and the bilayer strong-stability, we analyze the water hydrogen bond network in the detail in the next section.
2.3.4 The Confined Water Hydrogen Bond Network
First we calculate the average number of hydrogen bonds per molecule, , for the water in the confined subvolume, , as a function of the pore size (Fig. 8)333Vertical lines in the figure are defined for the LJ oscillations but, as discussed in the text, they approximate well the water oscillations.. We find that is almost as large as in bulk for the bilayer, where the free energy and have their absolute minima. For other values of , is smaller, with a local minimum at Å, where both and have local maxima.
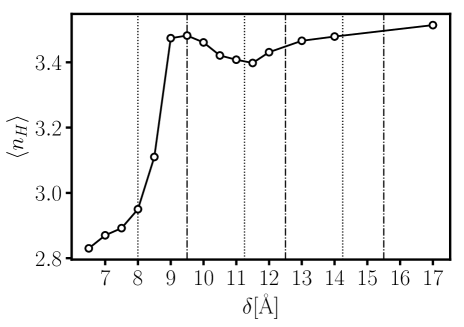
These observation suggest that both diffusion and free energy are dominated, in these range of , by the average number of hydrogen bonds. However, for Å the analysis is less intuitive. Indeed, The maximum in at Å does not correspond to a minimum in (Fig. 8). Counterintuitively, for Å, both and decrease.
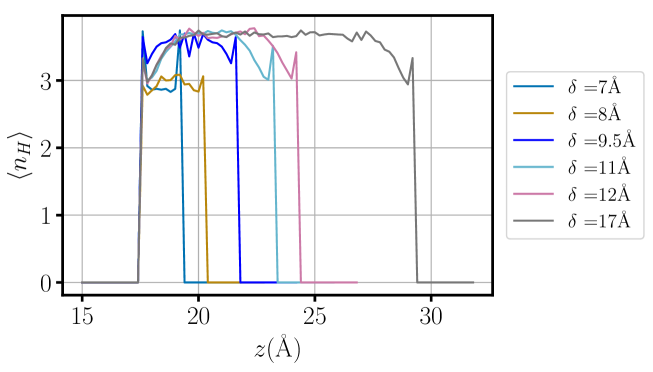
This is the range of -values where the confined-water free-energy is dominated by its entropy. In particular, its has a (structured) minimum for Å (Fig. 6.e). Although not evident from the averaged , our detailed analysis shows that, for these values of , the hydrogen-bond profile is quite different from the cases at larger . We find (Fig. 9) that the hydrogen-bond profile for Å (with two or more layers) saturates in its center to a bulk-like value within Å from the graphene wall. For Å there is not enough space in the pore to allow the water molecules to arrange in such a saturated network. As a consequence, away from the wall, the profile reaches a local value of , indicating a less connected network.
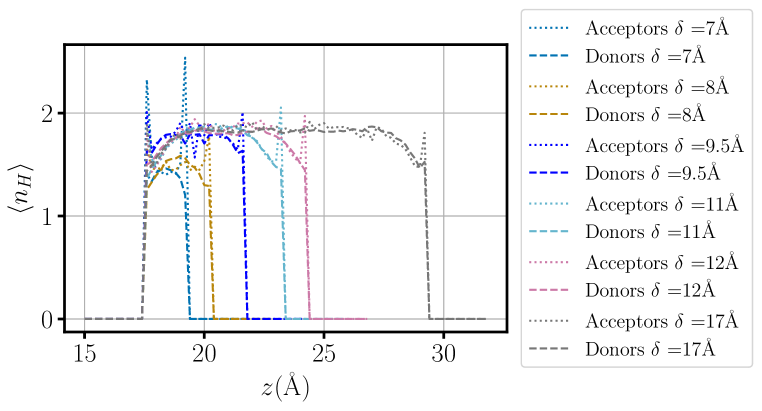
In particular, we calculate the profiles of donors and acceptors for the hydrogen bonds as a function of , for each (Fig. 10). We find that for Å (monolayer) the majority of the water molecules have their hydrogens pointing toward the center of the pore, away from the hydrophobic walls, as one would expect. This asymmetry between the donors and acceptors profiles smoothen for Å. The strong asymmetry for Å indicates that the hydrogen-bond network is hindered by the hydrophobic wall, facilitating the breaking of the Cooperative Rearranging Regions and the diffusion in confined water 111. This observation is consistent with the larger entropy of the confined water monolayer with respect to the cases with more, well formed layers (Fig. 6.e).
3 Conclusions
We compare structure, dynamics and thermodynamics of water confined in a graphene slit-pore with two isotropic liquids, a simple liquid (LJ) and an anomalous liquid (CSW), under similar conditions. We find that below nm, where only two or one layer can be accommodated, confined water is unique for, at least, the following reasons.
-
(i)
Water goes from very large to very small order changing the pore size from 0.95 nm to 0.80 nm, when compared with the bulk. The considered isotropic liquids, instead, have a structural order that, although oscillating, increases in its maxima for decreasing pore size.
-
(ii)
Water goes from less to more diffusive than bulk changing the pore size from 0.95 nm to 0.80 nm, with a maximum at nm. The isotropic liquids, instead, have a thermal diffusion oscillating with the pore size, but with an overall decreasing diffusion coefficient for decreasing pore size.
-
(iii)
Water has its maximum stability for the double layer at 0.95 nm, where it saturates its hydrogen-bond network. The monolayer at nm is less stable and more disordered, with its hydrogen-bond network hindered by the hydrophobic graphene walls. For the isotropic liquids, instead, a monolayer is more stable than two or more confined layers. While for the simple LJ the internal energy of the confined liquid is the leading contribution to the stability, for the anomalous liquid, CSW, it is the entropy, resembling more water.
Our analysis clarifies that these differences are all due to the water hydrogen-bond network. Therefore, the layering alone is not able to rationalize the properties of water under sub-nm confinement, not even if a stronger interaction with the walls is considered. We find that strong LJ-wall interaction leads to freezing and crystallization at sub-nm pore-size, with an effect similar to a decrease of temperature for confined water 90 and opposite to increase in diffusion or disorder.
Nevertheless, it is intriguing to observe that the differences with isotropic liquids fade out for pore with more than two layers (> 1nm). This is especially true for the CSW anomalous liquid, that in its bulk version, has some water-like properties 77, 79, 80, although not the entropy balance observed in water 78, 81. However, the differences are emphasized for monolayers and bilayers. Because water monolayers and bilayers are common in biology and nanofluidics, our results pave the way to better understand how biology takes advantage of the unique water properties and how nanotechnology could mimic, in this respect, Mother Nature.
4 Methods
4.1 Confined LJ fluid
We simulate particles interacting via a LJ potential (Fig. 1.b)
| (5) |
with Å and kcal/mol. These parameters are chosen in such a way to compare with the LJ contribution of the TIP4P/2005 potential (with same size and 0.185 kcal/mol as LJ energy) 112. In order to reduce the computational cost, we impose a cutoff for the interaction potential at a distance Å.
The slit-pore is composed of two parallel graphene sheets. Each sheet is a honeycomb lattice made of frozen particles, with inter-particle distance Å, lateral sizes Å, Å, and an area nm2. The graphene particles of the walls interact with the fluid particles through a LJ potential as in Eq.(5) 113 with size Å, and energy kcal/mol (case 1, weaker than the fluid-fluid interaction), or kcal/mol (case 2, stronger than the fluid-fluid interaction). The two choices, and , allow us to study the effects of the fluid-wall interaction strength. In particular, we chose to compare our results with those by Gao et al. 97, 98.
We perform NPT simulations at constant number of LJ particles, constant temperature K, and constant bulk pressure atm, leaving the box volume, with , free to change 444At this state point, corresponding to a bulk number density Å-3, i.e., a reduced density , the bulk is liquid and the confined region is filled with fluid..
We simulate the system with LAMMPS, adopting the Nose-Hoover thermostat and barostat 114, with relaxation time and MD steps, respectively, and with MD steps of relaxation, enough to reach equilibrium in the bulk and within the confined sub-region. Next we compute the observables for more MD steps, recording each quantity every MD steps.
4.2 Confined CSW fluid
We describe the anomalous fluid with the CSW potential (Fig. 1.b) 76, 77, 78, 79, 80
| (6) |
where is the diameter of the particles, and are the distance of the attractive minimum and the repulsive radius, respectively, and are the energies of the attractive well and the repulsive shoulder, respectively, is the variance of the Gaussian centered in and is the parameter which controls the slope between the shoulder and the well at . We choose the CSW parameters in such a way that the resulting potential compares at the best with LJ potential (Fig. 1.b): kcal/mol, Å, Å, , , , , and a cutoff at a distance Å.
We adopt the same slit-pore as for the LJ fluid with the weak fluid-wall interaction, kcal/mol, simulating the system with LAMMPS and Nose-Hoover thermostat 114, with the same equilibration and production statistics as for the LJ. We perform the simulations at constant number of CSW particles, constant temperature , and constant box volume , leaving the bulk pressure free to change 555Simulations at constant for the CSW fluid at the same , same and same as for the LJ fluid would require a much larger box for the CSW than the LJ in order to get a comparable number of particles inside the sub-volume .. We consider different values of temperature, K=60, 80, 100, and we vary , changing the box section parallel to the slit-pore plates, to control the bulk number density as Å 0.027, 0.036, 0.045, 0.054, i.e., reduced densities 0.15, 0.2, 0.25, 0.30, all corresponding to the bulk liquid phase 78 (Fig. S1 ans S2 in Supplementary Material). We focus on the state point at Å-3 and K because it shows a dynamics comparable to the confined LJ, as discussed in the main text.
4.3 Confined TIP4P/2005 water
For the confined TIP4P/2005 water 112, we use the data and the parameters as described in Ref.90. Specifically, the system has water molecules in a box with constant volume nm3 and constant K, corresponding to atm and a density g/cm3, i.e., a number density Å-3. The graphene slit-pore has two Å Å rigid plates, and water-carbon interactions modeled as LJ potential as in the CHARMM27 force field, adopting the Lorentz-Berthelot rules, a cut off of the Van der Waals interactions at 12 Å, a smooth switching function starting at 10 Å, and the particle mesh Ewald method 115, with a grid space of Å, for the calculation of the long-range electrostatic forces. As for the fluids (A) and (B), also in this case, the observables are calculated in a confined sub-volume , at constant , and constant chemical potential . Further details are given in Ref.90.
We acknowledge support from the Spanish grant PGC2018-099277-B-C22 (MCIU/AEI/ERDF). G.F. acknowledges support from the ICREA Foundation (ICREA Academia prize).
References
- Schoen and Diestler 1998 Schoen, M.; Diestler, D. J. Analytical treatment of a simple fluid adsorbed in a slit-pore. J. Chem. Phys. 1998, 109, 5596–5606
- Truskett et al. 2001 Truskett, T. M.; Debenedetti, P. G.; Torquato, S. Thermodynamic implications of confinement for a waterlike fluid. J. Chem. Phys. 2001, 114, 2401–2418
- Mittal et al. 2008 Mittal, J.; Truskett, T. M.; Errington, J. R.; Hummer, G. Layering and Position-Dependent Diffusive Dynamics of Confined Fluids. Phys. Rev. Lett. 2008, 100, 145901–
- De Virgiliis et al. 2008 De Virgiliis, A.; Vink, R. L. C.; Horbach, J.; Binder, K. From capillary condensation to interface localization transitions in colloid-polymer mixtures confined in thin-film geometry. Phys. Rev. E 2008, 78, 041604–
- Rzysko et al. 2010 Rzysko, W.; Patrykiejew, A.; Sokolowski, S.; Pizio, O. Phase behavior of a two-dimensional and confined in slitlike pores square-shoulder, square-well fluid. J. Chem. Phys. 2010, 132, 164702–11
- Schnell et al. 2011 Schnell, S. K.; Vlugt, T. J. H.; Simon, J.-M.; Bedeaux, D.; Kjelstrup, S. Thermodynamics of a small system in a muT reservoir. Chem. Phys. Lett. 2011, 504, 199–201
- Schnell et al. 2011 Schnell, S. K.; Vlugt, T. J. H.; Simon, J.-M.; Bedeaux, D.; Kjelstrup, S. Thermodynamics of small systems embedded in a reservoir: a detailed analysis of finite size effects. Mol. Phys. 2011, 110, 1069–1079
- Paul 2012 Paul, D. R. Creating New Types of Carbon-Based Membranes. Science 2012, 335, 413–414
- Stewart and Evans 2012 Stewart, M. C.; Evans, R. Phase behavior and structure of a fluid confined between competing (solvophobic and solvophilic) walls. Phys. Rev. E 2012, 86, 031601–
- Krott and Barbosa 2013 Krott, L. B.; Barbosa, M. C. Anomalies in a waterlike model confined between plates. J. Chem. Phys. 2013, 138, 084505–12
- Karan et al. 2012 Karan, S.; Samitsu, S.; Peng, X.; Kurashima, K.; Ichinose, I. Ultrafast Viscous Permeation of Organic Solvents Through Diamond-Like Carbon Nanosheets. Science 2012, 335, 444–447
- Bhushan et al. 1995 Bhushan, B.; Israelachvili, J. N.; Landman, U. Nanotribology: friction, wear and lubrication at the atomic scale. Nature 1995, 374, 607
- Jones and Bergman 1972 Jones, R.; Bergman, R. G. p-Benzyne. Generation as an intermediate in a thermal isomerization reaction and trapping evidence for the 1,4-benzenediyl structure. J. Am. Chem. Soc. 1972, 94, 660
- Zangi and Mark 2003 Zangi, R.; Mark, A. E. Monolayer Ice. Phys. Rev. Lett. 2003, 91, 025502
- Algara-Siller et al. 2015 Algara-Siller, G.; Lehtinen, O.; Wang, F. C.; Nair, R. R.; Kaiser, U.; Wu, H. A.; Geim, A. K.; Grigorieva, I. V. Square ice in graphene nanocapillaries. Nature 2015, 519, 443–445
- He et al. 2019 He, L.-L.; Li, Y.; Zhao, D.-X.; Yu, L.; Zhao, C.-L.; Lu, L.-N.; Liu, C.; Yang, Z.-Z. Structure and Phase Behavior of the Confined Water in Graphene Nanocapillaries Studied by ABEEM Polarizable Force Field. J. Phys. Chem. C 2019, 123, 5653–5666
- Das et al. 2010 Das, A.; Jayanthi, S.; Deepak, H. S. M. V.; Ramanathan, K. V.; Kumar, A.; Dasgupta, C.; Sood, A. K. Single-File Diffusion of Confined Water Inside SWNTs: An NMR Study. ACS Nano 2010, 4, 1687–1695
- Verhagen et al. 2020 Verhagen, T.; Klimes, J.; Pacakova, B.; Kalbac, M.; Vejpravova, J. Anomalous Freezing of Low-Dimensional Water Confined in Graphene Nanowrinkles. ACS Nano 2020, 14, 15587–15594
- Kastelowitz and Molinero 2018 Kastelowitz, N.; Molinero, V. Ice-Liquid Oscillations in Nanoconfined Water. ACS Nano 2018, 12, 8234–8239
- Bellissent-Funel et al. 1995 Bellissent-Funel, M.-C.; Chen, S. H.; Zanotti, J.-M. Single-particle dynamics of water molecules in confined space. Phys. Rev. E 1995, 51, 4558–4569
- Mashl et al. 2003 Mashl, R. J.; Joseph, S.; Aluru, N. R.; Jakobsson, E. Anomalously Immobilized Water: A New Water Phase Induced by Confinement in Nanotubes. Nano Lett. 2003, 3, 589–592
- Mallamace et al. 2008 Mallamace, F.; Corsaro, C.; Broccio, M.; Branca, C.; González-Segredo, N.; Spooren, J.; Chen, S. H.; Stanley, H. E. NMR evidence of a sharp change in a measure of local order in deeply supercooled confined water. Proc. Natl. Acad. Sci. U.S.A. 2008, 105, 12725–12729
- Cicero et al. 2008 Cicero, G.; Grossman, J. C.; Schwegler, E.; Gygi, F.; Galli, G. Water Confined in Nanotubes and between Graphene Sheets: A First Principle Study. J. Am. Chem. Soc. 2008, 130, 1871–1878
- Giovambattista et al. 2009 Giovambattista, N.; Rossky, P. J.; Debenedetti, P. G. Effect of Temperature on the Structure and Phase Behavior of Water Confined by Hydrophobic, Hydrophilic, and Heterogeneous Surfaces†. J. Phys. Chem. B 2009, 113, 13723–13734
- Castrillón et al. 2009 Castrillón, S. R.-V.; Giovambattista, N.; Aksay, I. A.; Debenedetti, P. G. Evolution from Surface-Influenced to Bulk-Like Dynamics in Nanoscopically Confined Water. J. Phys. Chem. B 2009, 113, 7973
- Castrillón et al. 2009 Castrillón, S. R.-V.; Giovambattista, N.; Aksay, I. A.; Debenedetti, P. G. Effect of Surface Polarity on the Structure and Dynamics of Water in Nanoscale Confinement. J. Phys. Chem. B 2009, 113, 1438
- Mancinelli et al. 2009 Mancinelli, R.; Imberti, S.; Soper, A. K.; Liu, K. H.; Mou, C. Y.; Bruni, F.; Ricci, M. A. Multiscale Approach to the Structural Study of Water Confined in MCM41. J. Phys. Chem. B 2009, 113, 16169–16177
- Gallo et al. 2010 Gallo, P.; Rovere, M.; Chen, S.-H. Anomalous dynamics of water confined in MCM-41 at different hydrations. J. Phys. Condens. Matter 2010, 22, 284102
- Han et al. 2010 Han, S.; Choi, M. Y.; Kumar, P.; Stanley, H. E. Phase transitions in confined water nanofilms. Nat Phys 2010, 6, 685–689
- de los Santos and Franzese 2011 de los Santos, F.; Franzese, G. Understanding Diffusion and Density Anomaly in a Coarse-Grained Model for Water Confined between Hydrophobic Walls. J. Phys. Chem. B 2011, 115, 14311–14320
- Giovambattista et al. 2012 Giovambattista, N.; Rossky, P.; Debenedetti, P. Computational Studies of Pressure, Temperature, and Surface Effects on the Structure and Thermodynamics of Confined Water. Annu. Rev. Phys. Chem. 2012, 63, 179–200
- Nair et al. 2012 Nair, R. R.; Wu, H. A.; Jayaram, P. N.; Grigorieva, I. V.; Geim, A. K. Unimpeded Permeation of Water Through Helium-Leak–Tight Graphene-Based Membranes. Science 2012, 335, 442–444
- Ferguson et al. 2012 Ferguson, A. L.; Giovambattista, N.; Rossky, P. J.; Panagiotopoulos, A. Z.; Debenedetti, P. G. A computational investigation of the phase behavior and capillary sublimation of water confined between nanoscale hydrophobic plates. J. Chem. Phys. 2012, 137, 144501–21
- Schirò et al. 2009 Schirò, G.; Cupane, A.; Vitrano, E.; Bruni, F. Dielectric Relaxations in Confined Hydrated Myoglobin. J. Phys. Chem. B 2009, 113, 9606–9613
- Biedermann et al. 2013 Biedermann, F.; Vendruscolo, M.; Scherman, O. A.; De Simone, A.; Nau, W. M. Cucurbit8uril and Blue-Box: High-Energy Water Release Overwhelms Electrostatic Interactions. Journal of the American Chemical Society 2013, 135, 14879–14888
- Franzese and Bianco 2013 Franzese, G.; Bianco, V. Water at Biological and Inorganic Interfaces. Food Biophys. 2013, 8, 153–169
- Martelli et al. 2020 Martelli, F.; Crain, J.; Franzese, G. Network Topology in Water Nanoconfined between Phospholipid Membranes. ACS Nano 2020, 14, 8616–8623
- Abraham et al. 2017 Abraham, J.; Vasu, K. S.; Williams, C. D.; Gopinadhan, K.; Su, Y.; Cherian, C. T.; Dix, J.; Prestat, E.; Haigh, S. J.; Grigorieva, I. V.; Carbone, P.; Geim, A. K.; Nair, R. R. Tunable sieving of ions using graphene oxide membranes. Nature Nanotechnology 2017, 12, 546–550
- Zhou et al. 2018 Zhou, K. G. et al. Electrically controlled water permeation through graphene oxide membranes. Nature 2018, 559, 236–240
- Hirunpinyopas et al. 2020 Hirunpinyopas, W.; Iamprasertkun, P.; Bissett, M. A.; Dryfe, R. A. W. Tunable charge/size selective ion sieving with ultrahigh water permeance through laminar graphene membranes. Carbon 2020, 156, 119–129
- Zhao et al. 2021 Zhao, X.; Qiu, H.; Zhou, W.; Guo, Y.; Guo, W. Phase-dependent friction of nanoconfined water meniscus. Nanoscale 2021, 13, 3201–3207
- Jiao et al. 2013 Jiao, Y.; Du, A.; Hankel, M.; Smith, S. C. Modelling carbon membranes for gas and isotope separation. Phys. Chem. Chem. Phys. 2013, 15, 4832–4843
- Geim and Grigorieva 2013 Geim, A. K.; Grigorieva, I. V. Van der Waals heterostructures. Nature 2013, 499, 419
- Hummer et al. 2001 Hummer, G.; Rasaiah, J. C.; Noworyta, J. P. Water conduction through the hydrophobic channel of a carbon nanotube. Nature 2001, 414, 188
- Majumder et al. 2005 Majumder, M.; Chopra, N.; Andrews, R.; Hinds, B. J. Enhanced flow in carbon nanotubes. Nature 2005, 438, 44
- Holt et al. 2006 Holt, J. K.; Park, H. G.; Wang, Y.; Stadermann, M.; Artyukhin, A. B.; Grigoropoulos, C. P.; Noy, A.; Bakajin, O. Fast mass transport through sub-2-nanometer carbon nanotubes. Science 2006, 312, 1034
- Joshi et al. 2014 Joshi, R. K.; Carbone, P.; Wang, F. C.; Kravets, V. G.; Su, Y.; Grigorieva, I. V.; Wu, H. A.; Geim, A. K.; Nair, R. R. Precise and Ultrafast Molecular Sieving Through Graphene Oxide Membranes. Science 2014, 752, 343
- Murad et al. 1993 Murad, S.; Ravi, P.; Powles, J. G. A computer simulation study of fluids in model slit, tubular, and cubic micropores. J. Chem. Phys. 1993, 98, 9771–9781
- Thompson et al. 1992 Thompson, P. A.; Grest, G. S.; Robbins, M. O. Phase transitions and universal dynamics in confined films. Phys. Rev. Lett. 1992, 68, 3448–3451
- Diestler et al. 1993 Diestler, D. J.; Schoen, M.; Cushman, J. H. On the Thermodynamic Stability of Confined Thin Films Under Shear. Science 1993, 262, 545–547
- Rhykerd et al. 1987 Rhykerd, C. L.; Schoen, M.; Diestler, D. J.; Cushman, J. H. Epitaxy in simple classical fluids in micropores and near-solid surfaces. Nature 1987, 330, 461–463
- Klein and Kumacheva 1995 Klein, J.; Kumacheva, E. Confinement-Induced Phase Transitions in Simple Liquids. Science 1995, 269, 816–819
- Klein and Kumacheva 1998 Klein, J.; Kumacheva, E. Simple liquids confined to molecularly thin layers. I. Confinement-induced liquid-to-solid phase transitions. J. Chem. Phys. 1998, 108, 6996–7009
- Winkler et al. 1996 Winkler, R. G.; Schmid, R. H.; Gerstmair, A.; Reineker, P. Molecular dynamics simulation study of the dynamics of fluids in thin films. J. Chem. Phys. 1996, 104, 8103–8111
- Magda et al. 1985 Magda, J. J.; Tirrell, M.; Davis, H. T. Molecular dynamics of narrow, liquid-filled pores. J. Chem. Phys. 1985, 83, 1888–1901
- Ghosh and Krishnamurthy 2018 Ghosh, K.; Krishnamurthy, C. V. Molecular dynamics of partially confined Lennard-Jones gases: Velocity autocorrelation function, mean squared displacement, and collective excitations. Phys. Rev. E 2018, 98, 052115
- Zhang et al. 2011 Zhang, C.; Chen, Y.; Yang, L.; Shi, M. Self-diffusion for Lennard-Jones fluid confined in a nanoscale space. Int. J. Heat Mass Transfer 2011, 54, 4770–4773
- Hannaoui et al. 2013 Hannaoui, R.; Galliero, G.; Hoang, H.; Boned, C. Influence of confinement on thermodiffusion. J. Chem. Phys. 2013, 139, 114704
- Mao and Sinnott 2000 Mao, Z.; Sinnott, S. B. A Computational Study of Molecular Diffusion and Dynamic Flow through Carbon Nanotubes. J. Phys. Chem. B 2000, 104, 4618–4624
- Mao and Sinnott 2001 Mao, Z.; Sinnott, S. B. Separation of Organic Molecular Mixtures in Carbon Nanotubes and Bundles: Molecular Dynamics Simulations. J. Phys. Chem. B 2001, 105, 6916–6924
- Skoulidas et al. 2002 Skoulidas, A. I.; Ackerman, D. M.; Johnson, J. K.; Sholl, D. S. Rapid Transport of Gases in Carbon Nanotubes. Phys. Rev. Lett. 2002, 89, 185901
- Bhatia et al. 2005 Bhatia, S. K.; Chen, H.; Sholl, D. S. Comparisons of diffusive and viscous contributions to transport coefficients of light gases in single-walled carbon nanotubes. Mol. Sim. 2005, 31, 643–649
- Bordin et al. 2012 Bordin, J. R.; de Oliveira, A. B.; Diehl, A.; Barbosa, M. C. Diffusion enhancement in core-softened fluid confined in nanotubes. J. Chem. Phys. 2012, 137, 084504–7
- Thomas and McGaughey 2008 Thomas, J. A.; McGaughey, A. J. H. Reassessing Fast Water Transport Through Carbon Nanotubes. Nano Lett. 2008, 8, 2788–2793
- Thomas and McGaughey 2009 Thomas, J. A.; McGaughey, A. J. H. Water Flow in Carbon Nanotubes: Transition to Subcontinuum Transport. Phys. Rev. Lett. 2009, 102, 184502–
- Qin et al. 2011 Qin, X.; Yuan, Q.; Zhao, Y.; Xie, S.; Liu, Z. Measurement of the Rate of Water Translocation through Carbon Nanotubes. Nano Lett. 2011, 11, 2173–2177
- Allen et al. 1999 Allen, T. W.; Kuyucak, S.; Chung, S.-H. The effect of hydrophobic and hydrophilic channel walls on the structure and diffusion of water and ions. J. Chem. Phys. 1999, 111, 7985–7999
- Ye et al. 2011 Ye, H.; Zhang, H.; Zheng, Y.; Zhang, Z. Nanoconfinement induced anomalous water diffusion inside carbon nanotubes. Microfluid Nanofluidics 2011, 10, 1359–1364
- Barati Farimani and Aluru 2011 Barati Farimani, A.; Aluru, N. R. Spatial Diffusion of Water in Carbon Nanotubes: From Fickian to Ballistic Motion. J. Phys. Chem. B 2011, 115, 12145–12149
- Zheng et al. 2012 Zheng, Y.-g.; Ye, H.-f.; Zhang, Z.-q.; Zhang, H.-w. Water diffusion inside carbon nanotubes: mutual effects of surface and confinement. Phys. Chem. Chem. Phys. 2012, 14, 964–971
- Martí and Gordillo 2002 Martí, J.; Gordillo, M. C. Microscopic dynamics of confined supercritical water. Chem. Phys. Lett. 2002, 354, 227–232
- Ye et al. 2011 Ye, H.; Zhang, H.; Zhang, Z.; Zheng, Y. Size and temperature effects on the viscosity of water inside carbon nanotubes. Nanoscale Res. Lett. 2011, 6, 87
- Babu and Sathian 2011 Babu, J. S.; Sathian, S. P. The role of activation energy and reduced viscosity on the enhancement of water flow through carbon nanotubes. J. Chem. Phys. 2011, 134, 194509
- Neek-Amal et al. 2016 Neek-Amal, M.; Peeters, F. M.; Grigorieva, I. V.; Geim, A. K. Commensurability Effects in Viscosity of Nanoconfined Water. ACS Nano 2016, 10, 3685–3692
- Striolo 2006 Striolo, A. The Mechanism of Water Diffusion in Narrow Carbon Nanotubes. Nano Lett. 2006, 6, 633–639
- Franzese 2007 Franzese, G. Differences between discontinuous and continuous soft-core attractive potentials: The appearance of density anomaly. J. Mol. Liq. 2007, 136, 267–273
- de Oliveira et al. 2008 de Oliveira, A. B.; Franzese, G.; Netz, P. A.; Barbosa, M. C. Waterlike hierarchy of anomalies in a continuous spherical shouldered potential. J. Chem. Phys. 2008, 128, 064901
- Vilaseca and Franzese 2010 Vilaseca, P.; Franzese, G. Softness dependence of the anomalies for the continuous shouldered well potential. J. Chem. Phys. 2010, 133, 084507
- Leoni and Franzese 2014 Leoni, F.; Franzese, G. Structural behavior and dynamics of an anomalous fluid between attractive and repulsive walls: Templating, molding, and superdiffusion. The Journal of Chemical Physics 2014, 141, 174501
- Leoni and Franzese 2016 Leoni, F.; Franzese, G. Effects of confinement between attractive and repulsive walls on the thermodynamics of an anomalous fluid. Physical Review E 2016, 94, 062604–
- Vilaseca and Franzese 2011 Vilaseca, P.; Franzese, G. Isotropic soft-core potentials with two characteristic length scales and anomalous behaviour. J. Non-Cryst. Solids 2011, 357, 419 – 426
- Hus and Urbic 2013 Hus, M.; Urbic, T. Core-softened fluids as a model for water and the hydrophobic effect. J. Chem. Phys. 2013, 139, 114504–8
- Huš and Urbic 2014 Huš, M.; Urbic, T. Existence of a liquid-liquid phase transition in methanol. Phys. Rev. E 2014, 90, 062306–
- Huš et al. 2014 Huš, M.; Munaò, G.; Urbic, T. Properties of a soft-core model of methanol: An integral equation theory and computer simulation study. J. Chem. Phys. 2014, 141, 164505
- Desgranges and Delhommelle 2018 Desgranges, C.; Delhommelle, J. Communication: Existence and control of liquid polymorphism in methanol under shear. J. Chem. Phys. 2018, 149, 111101
- Marques et al. 2020 Marques, M. S.; Hernandes, V. F.; Lomba, E.; Bordin, J. R. Competing interactions near the liquid-liquid phase transition of core-softened water/methanol mixtures. J. Mol. Liq. 2020, 320, 114420
- Blanco et al. 2018 Blanco, P. M.; Garces, J. L.; Madurga, S.; Mas, F. Macromolecular diffusion in crowded media beyond the hard-sphere model. Soft Matter 2018, 14, 3105–3114
- Blanco et al. 2021 Blanco, P. M.; Madurga, S.; Garcés, J. L.; Mas, F.; Dias, R. S. Influence of macromolecular crowding on the charge regulation of intrinsically disordered proteins. Soft Matter 2021, 17, 655–669
- Russo et al. 2021 Russo, J.; Leoni, F.; Martelli, F.; Sciortino, F. The physics of Empty Liquids: from Patchy particles to Water. Rep. Prog. Phys. 2021,
- Calero and Franzese 2020 Calero, C.; Franzese, G. Water under extreme confinement in graphene: Oscillatory dynamics, structure, and hydration pressure explained as a function of the confinement width. J. Mol. Liq. 2020, 317, 114027
- Engstler and Giovambattista 2018 Engstler, J.; Giovambattista, N. Temperature Effects on Water-Mediated Interactions at the Nanoscale. The Journal of Physical Chemistry B 2018, 122, 8908–8920
- Torquato et al. 2000 Torquato, S.; Truskett, T. M.; Debenedetti, P. G. Is Random Close Packing of Spheres Well Defined? Phys. Rev. Lett. 2000, 84, 2064
- Truskett et al. 2000 Truskett, T. M.; Torquato, S.; Debenedetti, P. G. Towards a quantification of disorder in materials: Distinguishing equilibrium and glassy sphere packings. Phys. Rev. E 2000, 62, 993
- Agarwal et al. 2011 Agarwal, M.; Alam, M. P.; Chakravarty, C. Thermodynamic, Diffusional, and Structural Anomalies in Rigid-Body Water Models. J. Phys. Chem. B 2011, 115, 6935–6945
- Krott and Bordin 2013 Krott, L. B.; Bordin, J. Distinct dynamical and structural properties of a core-softened fluid when confined between fluctuating and fixed walls. The Journal of Chemical Physics 2013, 139, 154502
- Bordin and Barbosa 2018 Bordin, J. F.; Barbosa, M. C. Phys. Rev. E 2018, 97, 022604
- Gao et al. 1997 Gao, J.; Luedtke, W.; Landman, U. Origins of solvation forces in confined films. J. Phys. Chem. B 1997, 101, 4013–4023
- Gao et al. 1997 Gao, J.; Luedtke, W. D.; Landman, U. Layering Transitions and Dynamics of Confined Liquid Films. Phys. Rev. Lett. 1997, 79, 705–708
- Lam and Lutsko 2018 Lam, J.; Lutsko, J. F. Solvent-mediated interactions between nanostructures: From water to Lennard-Jones liquid. J. Chem. Phys. 2018, 149, 134703
- Martí et al. 2017 Martí, J.; Calero, C.; Franzese, G. Structure and Dynamics of Water at Carbon-Based Interfaces. Entropy 2017, 19, 135
- Conde et al. 2013 Conde, M. M.; Gonzalez, M. A.; Abascal, J. L. F.; Vega, C. Determining the phase diagram of water from direct coexistence simulations: The phase diagram of the TIP4P/2005 model revisited. The Journal of Chemical Physics 2013, 139, 154505
- Conde et al. 2017 Conde, M. M.; Rovere, M.; Gallo, P. High precision determination of the melting points of water TIP4P/2005 and water TIP4P/Ice models by the direct coexistence technique. The Journal of Chemical Physics 2017, 147, 244506
- Zhou et al. 2015 Zhou, W.; Yin, K.; Wang, C.; Zhang, Y.; Xu, T.; Borisevich, A.; Sun, L.; Idrobo, J. C.; Chisholm, M. F.; Pantelides, S. T.; Klie, R. F.; Lupini, A. R. The observation of square ice in graphene questioned. Nature 2015, 528, E1–E2
- Algara-Siller et al. 2015 Algara-Siller, G.; Lehtinen, O.; Kaiser, U. Algara-Siller et al. reply. Nature 2015, 528, E3–E3
- Zangi and Mark 2003 Zangi, R.; Mark, A. E. Bilayer ice and alternate liquid phases of confined water. J. Chem. Phys. 2003, 119, 1694–1700
- Zangi 2004 Zangi, R. Water confined to a slab geometry: a review of recent computer simulation studies. Journal of Physics: Condensed Matter 2004, 16, S5371
- Wang et al. 2015 Wang, F. C.; Wu, H. A.; Geim, A. K. Wang et al. reply. Nature 2015, 528, E3–E3
- Zubeltzu et al. 2016 Zubeltzu, J.; Corsetti, F.; Fernández-Serra, M. V.; Artacho, E. Continuous melting through a hexatic phase in confined bilayer water. Physical Review E 2016, 93, 062137–
- Corsetti et al. 2016 Corsetti, F.; Zubeltzu, J.; Artacho, E. Enhanced Configurational Entropy in High-Density Nanoconfined Bilayer Ice. Phys. Rev. Lett. 2016, 116, 085901
- Zubeltzu and Artacho 2017 Zubeltzu, J.; Artacho, E. Simulations of water nano-confined between corrugated planes. The Journal of Chemical Physics 2017, 147, 194509
- de los Santos and Franzese 2012 de los Santos, F.; Franzese, G. Relations between the diffusion anomaly and cooperative rearranging regions in a hydrophobically nanoconfined water monolayer. Physical Review E 2012, 85, 010602–
- Abascal and Vega 2005 Abascal, J. L. F.; Vega, C. A general purpose model for the condensed phases of water: TIP4P/2005. J. Chem. Phys. 2005, 123, 234505–12
- Vanommeslaeghe et al. 2010 Vanommeslaeghe, K.; Hatcher, E.; Acharya, C.; Kundu, S.; Zhong, S.; Shim, J.; Darian, E.; Guvench, O.; Lopes, P.; Vorobyov, I.; et al., CHARMM general force field: A force field for drug-like molecules compatible with the CHARMM all-atom additive biological force fields. J. Comput. Chem. 2010, 31, 671–690
- 114 http://lammps.sandia.gov
- U.Essmann et al. 1995 U.Essmann,; L.Perera,; M.L.Berkowitz,; T.Darden,; H.Lee,; L.G.Pedersen, J. Chem. Phys. 1995, 103, 8577