-PVDF Based Flexible Nanogenerator
Abstract
Delta () phase comprising polyvinylidene fluoride (PVDF) nanoparticles are fabricated through electrospray technique by applying 0.1 MV/m electric field at ambient temperature and pressure, which is 103 times lower than the typical value, required for -phase transformation. The X-ray diffraction (XRD) and selected area electron diffraction (SAED) patterns are clearly indicating the -phase formation. The piezo- and ferro- electric response of the -PVDF nanoparticles has been demonstrated through scanning probe microscopic technique based on piezoresponse force microscopy (PFM). The vertical piezoelectric response, indicated by d33 coefficient, is found -11 pm/V. Kink propagation model is adopted to justify the -phase conversion in electrospray system. The electrical response from -PVDF nanoparticle comprised nanogenerator under the external impacts and acoustic signal indicates that molecular ferroelectric dipoles responsible for piezoelectric responses, are poled in-situ during nanoparticle formation, thus further electrical poling is not necessary.
The piezoelectric polymers have been extensively explored due to their potential applications as transducers, actuators, sensors and energy harvesters. Won et al. (2015); Reece et al. (2003); Singh et al. (2014); Ghosh and Mandal (2017); Martins, Lopes, and Lanceros-Mendez (2014); Ghosh and Mandal (2016); Wang, Wang, and Yang (2016); Ranjan et al. (2007); Mandal, Yoon, and Kim (2011); Müller et al. (2008) PVDF is one of such piezoelectric semi-crystalline polymer that has been widely investigated and considered to have at least five distinct crystalline phases. Lovinger (1983) These phases have different chain conformations designated as all trans (TTTT) planar zigzag -phase (form I), T3GT3G´ -phase (form III), -phase (form V), TGTG´ (trans-gauche-trans-gauche) -phase (form II) and -phase (form IV). Banik et al. (1979); Furukawa (1989) Despite of the same chain conformations of and -phase, the -phase is non-polar and paraelectric in nature due to its centro-symmetric Broadhurst et al. (1978); Lovinger (1981a); Li et al. (2013a); Hasegawa et al. (1972); Hasegawa, Kobayashi, and Tadokoro (1972) (P21/c) unit cell. The marcomolecular chain of PVDF (chemical formula, -(-CH2-CF2-)n-) consists of repeated units of -CH2-CF2- as a monomer. The electronegative F and electropositive H atoms are the basis of molecular dipoles, (i.e. -CH2- and -CF2- dipoles) perpendicular to molecular c-axis. The dipole moments inside the unit cell of -phase are aligned in anti-parallel direction, resulting a non-polar state of PVDF. Lovinger (1983) In contrast, -phase exhibiting a non centro-symmetric (P21cn) unit cell Bachmann et al. (1980) that gives rise to piezoelectric, pyroelectric and ferroelectric properties. In case of -phase, every second chain along c-axis is rotated about 180 degrees, as a result the dipole moments in unit cell of -phase are aligned parallel to each other and perpendicular to molecular axis, giving rise to a polar state of PVDF. Dvey-Aharon, Taylor, and Hopfinger (1980) Also, the X-ray diffraction (XRD) studies have shown that the -phase has the similar interplanar d-spacing as of -phase but with the significant changes in their relative intensities for the specific set of h, k, l values. In a -phase unit cell, with an n glide perpendicular to c-axis, hk0 reflections are absent for h + k = 2n + 1. Bachmann et al. (1980); Naegele, Yoon, and Broadhurst (1978) Theoretically, the most accepted mechanism to achieve -phase is, to rotate the each of second polymer chain about its c-axis of -phase unit cell.Naegele, Yoon, and Broadhurst (1978) Experimentally, in 1978, the pioneer group, Davis et al. had shown that -phase could be achieved from -phase by applying a strong electrical field of 170 MV/m. Davis et al. (1978) In subsequent years, many other groups Naegele, Yoon, and Broadhurst (1978); Lovinger (1981b); Costa and Giacometti (1993); Anwar and Asadi (2019); Davies and Singh (1979) has also demonstrated the formation of -phase by applying higher electric field, with the coercive field of more than 100 MV/m. In addition, there have been also reported a very few different techniques such as electroforming Li et al. (2013a); Davis et al. (1978); Li et al. (2013b), solid state processing Martín et al. (2017) and quenching to achieve the -phase Gan, Abd Majid, and Furukawa (2016); Servet and Rault (1979); Qian et al. (2018); García-Zaldívar et al. (2017) in PVDF (Discussion S1 and Fig. S1, supplementary material). Apart from thick and thin films of PVDF different types of structures such as rods, tubes, particles, flakes have also gained the interest due to their technological importance. Fu et al. (2020)
In this work, we are reporting the formation of piezoelectric -phase comprising PVDF (henceforth, abbreviated as -PVDF) nanoparticles, at the lowest possible electric field reported till date (Table SI, supplementary material). The application of lower electric field gives an advantage over the dielectric fatigue and electrical breakdown of the polymer samples in comparison to higher electrical poling field. In this process, we have used the electrospray technique Wilm and Mann (1994) to achieve the -PVDF nanoparticles at room temperature (Discussion S2 and Fig. S2, supplementary material).
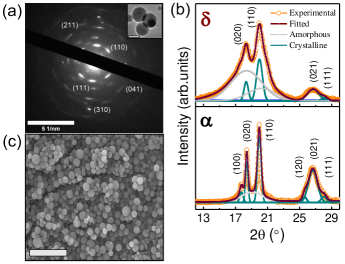
The SAED pattern (Fig. 1(a)) obtained in transmission electron microscope (TEM) (Discussion S3, supplementary material) confirms the diffraction pattern of -PVDF nanoparticles (inset of Fig. 1(a)) with similar interplanar spacing (d) values as obtained in XRD. The d-spacing of 0.441 nm corresponding to peak for (110) shows the brightest ring in electron diffraction. The (110) plane is consistent with the highest intensity peak in XRD. The reflections of plane (020) has not observed in the SAED, since the (110) and (020) are very closely originated and cannot be distinguished in bright rings as diffraction angles are close for these two planes. The next diffraction ring is observed for plane (111). Since (021) and (111) planes are closely spaced and have lesser intense rings due to structure factors dependency of these reflections, so only (111) was observed. The diffraction rings for plane (041), (211) and (310) was also observed in SEAD which belongs to -phase PVDF Bachmann et al. (1980) with much smaller d-spacing, for higher 2 values above 40º. The XRD pattern of PVDF nanoparticles at room temperature (RT) in Fig. 1(b) (upper panel, marked as ), resembles precisely with the -phase represented XRD patterns, having similar d-spacing Bachmann et al. (1980) and interplanar reflections of (020), (110), (021) and (111) at 2 peak positions of 18.3º, 19.9º, 26.7º and 28.1º respectively, as earlier reported by pioneer groups Naegele, Yoon, and Broadhurst (1978); Davis et al. (1978) with lattice parameters of a = 4.96 Å, b = 9.64 Å, c = 4.62 Å. It confirms the presence of -phase in these PVDF nanoparticles fabricated through the electrospray system. Further, we have demonstrated the reverse phase transformation of PVDF from -phase to -phase in nanoparticles. In this case, higher temperature treatment (170ºC) was given to the -PVDF nanoparticles. The XRD pattern of the PVDF nanoparticles after heat treatment at 170ºC (Fig. 1(b) lower panel, marked as ) shows the -phase PVDF characteristic diffraction peaks, appeared at (2) 17.6º, 18.3º, 19.9º, 25.6º, 26.7º and 28.1º attribute to lattice planes of (100), (020), (110), (120), (021) and (111), respectively. Hasegawa, Kobayashi, and Tadokoro (1972); Ince-Gunduz et al. (2010) This phase change from to -phase has occurred due to the temperature treatment above the melt crystallization of PVDF, that destroys dipolar alignments of -phase (ferroelectric) and converts it to non-polar -phase (paraelectric). The comparative study of both phases (Fig. 1(b)) shows that the only significant change has observed as decrease in the peak intensities of reflections (100) and (120) at 2 position 17.6º and 25.6º in -phase, compared to the -phase PVDF, with the same d-spacing and lattice parameters. So, it can be concluded that there is no disordering, contraction or change in lattice shape and size. Then the only possible changes in both the phases could be due to symmetry change of the unit cell lattice. Gan, Abd Majid, and Furukawa (2016); Naegele, Yoon, and Broadhurst (1978) This conclusion is consistent with basic unit cell structure of and -phase. That reconfirms the -phase formation in electrospray system. The crystallite size of the -phase and -phase crystalline lamella was calculated to be 6 nm and 13 nm, respectively (Discussion S4, supplementary material). Also, the degree of crystallinity () of -phase and -phase, from XRD pattern, was found to be 47% and 52%, respectively (Discussion S4, supplementary material). The fourier transform infrared spectroscopy (FTIR) study of the nanoparticles (Fig. S3 (marked as ), supplementary material) shows the IR absorption bands of -PVDF as reported by K. Tashiro et al.Tashiro et al. (2021). The vibrational bands at 1182 cm-1 and 1209 cm-1 are one of the conclusive way to identify the -phase through FTIR. The IR exposure causes the symmetric () and anti-symmetric () stretching of -CF2- dipoles at 1182 cm-1 and 1209 cm-1, respectively. The transition dipoles of (CF2) at 1182 cm-1 are in the same direction in and -phase unit cell and hence results no change in intensity at 1182 cm-1 and it remains constant. While the transitional dipole moments of (CF2) at 1209 cm-1, are in the opposite direction in unit cell of -phase as compared to unit cell -phase. Thus, as a result 1209 cm-1 absorption band does not appear in IR spectra of -phase. Tashiro et al. (2021) This observation is consistent with FTIR spectra of PVDF nanoparticles processed via electrospray. Additionally, the FTIR spectra (Fig. S3 (marked as ), supplementary material) also confirms the phase change, occurring from initial -phase to the -phase due to the heat treatment at 170ºC. The scanning electron microscopy (SEM) of the -PVDF nanoparticles is illustrated in Fig. 1(c), shows the formation of nanoparticles, ranges between 60 - 250 nm. The 2D and 3D AFM topography image (Fig. S4(a) and Fig. S4(b), supplementary material) displays the particles are spherical in shape with typical diameter around 90 nm.
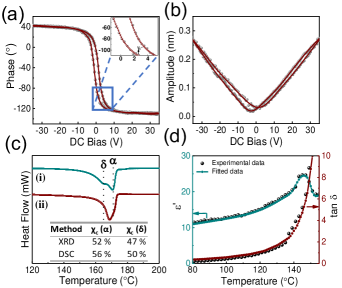
To study the piezoelectric and ferroelectric properties of -PVDF nanoparticles, piezoresponse force microscopy (PFM) was performed. An AC modulating voltage was applied between the conductive probe and ITO coated substrate to induce the mechanical oscillation normal to the surface in contact mode. The lock-in drive frequency of 12 kHz with drive amplitude of 8 V was employed to get the proper amplitude (A) and phase response () of -PVDF nanoparticles. The DC bias voltage of +35 V to -35 V was applied to obtain the corresponding phase and amplitude response of -PVDF nanoparticles. The hysteresis plot (phase response) in Fig. 2(a) shows that the dipoles of the -PVDF nanoparticles are reorienting itself under the application of external bias voltage. As the positive bias voltage is applied, the dipoles inside the crystalline lamella of -PVDF nanoparticles are being aligned in the opposite direction of applied electric field as negative phase response. The maximum reorientation takes place until the bias voltage reaches to +35 V, with maximum dipole switching with phase of -130º and therefore saturation takes place. Now, as the bias voltage starts decreasing and it crosses the coercive voltage (Vc), the dipoles start reorienting itself and keeps reorienting till it saturates to other end with bias voltage of -35 V at 180º phase difference from the earlier phase. The coercive voltage (Vc) was found to be 2.5 V. This final hysteresis plot verifies the ferroelectric nature of these -PVDF nanoparticles. The butterfly loop (amplitude response) shown in Fig. 2(b), is the evidence of piezoelectric response. As the bias voltage crosses the coercive voltage, the crystal lattice expansion takes place and it attains the maximum deformation of 0.27 nm at +35 V bias. As the applied DC voltage decreases, then it starts contracting itself until it reaches the minimal amplitude position, and start further expanding after increase in the magnitude of negative bias voltage above Vc and reaches to almost similar maximum deformation amplitude, before it start decreasing with decrease in the magnitude of negative bias voltage. In this case, nanoparticle attains minimal position lower than the previous amplitude. The butterfly loop confirms the piezoelectric response of ferroelectric -PVDF nanoparticles. The magnitude of d33 value was calculated from the slope of the butterfly loop. Al-Jishi and Taylor (1985) The obtained d33 value for -PVDF nanoparticles is -11 pm/V. The negative sign in this piezoelectric coefficient is associated with the direction of applied electric field with respect to the direction of polarization arising in the material. Burkard and Pfister (1974)
The differential scanning calorimetry (DSC) was performed at the ramping rate of 1ºC /min under N2 environment (Fig. 2(c)). The first heating cycle (Fig. 2(c-i)) from 120ºC - 200ºC, indicates the melting of different phases of PVDF. In this cycle, two peaks arise due to presence of two different phases of PVDF García-Zaldívar et al. (2017), which could be predicated as and -phase melting at 165ºC and 170ºC, respectively. In the cooling cycle, the sample crystallization takes place. Finally, the 2nd heating cycle ((Fig. 2(c-ii)) indicates only a single melting peak at 169ºC, that belongs to a single phase of PVDF. It can be interpreted as presence of -phase only, since this observation is consistent with the XRD (Fig. 1(b)) and FTIR (Fig. S3, supplementary material) results obtained from -phase to -phase transformation when temperature is employed. The degree of crystallinity () was calculated (Discussion S5, supplementary material) from DSC thermogram and it is consistent with estimated crystallanity from XRD (Fig. 2(c) inset). The subtle difference in crystallinity value arises as compared to XRD, due to the melting enthalpy provided to polymer chain during DSC process, which results the reorientation of molecular chain and changes the overall crystalline region in polymer chain. The dielectric constant and loss tangent measurements of -PVDF nanoparticles were performed at 1 kHz frequency with a temperature range of 80 to 155ºC has shown in Fig. 2(d). At room temperature (RT) and 1 kHz, the dielectric constant () for -PVDF nanoparticle was measured 7.5, with the loss tangent (tan) 0.25. For an increasing temperature range, the dielectric constant and loss tangent decreases with increase in frequency (Fig. S5, supplementary material). On the other hand, at a constant frequency (1 kHz), the dielectric constant and loss tangent increases gradually as the temperature increases. At lower temperature, these dipole molecules do not possess the flexibility to reorient themselves in the polymer chain. However, as the temperature increases, the possibility of dipoles reorientation results the increases in dielectric constant. In this scenario, the dielectric response is governed by the anomalous behavior of the glass transition of the polymer, but in the further increase in temperature results into the intense thermal vibrations that leads to suppress the degree of reorientation, resulting the reduction in dielectric constant of the polymer. El-Sayed, Abdel-Baset, and Hassen (2014) This particular behavior in this temperature region could be explained as ferroelectric to paraelectric like phase transition in -PVDF.
The piezoelectric -PVDF nanoparticles were obtained at significantly lower electric field (0.1 MV/m) in comparison to earlier reported work. The reason for the formation of -phase nanoparticles, is majorly governed by Taylor cone Vaseashta (2007) formation in electrospray process, in the presence of applied external electric field.Ryan, Smith, and Stark (2012) However, the reason of low electric field driven -phase formation through 180º chain rotation, can be explained by kink-propagation model. Dvey-Aharon et al. (1980); Dvey-Aharon, Taylor, and Hopfinger (1980) It also demonstrates that at lower electric fields, this phase transformation is significantly dependent on the temperature and the kink propagation velocity. To explain the kink rotation mechanism of TGTG´ chain unit by 180º, the motion of the chain has been defined by the following model.
The rotational kinetic energy of the molecular chain is defined as
| (1) |
where, I is moment of inertia of monomer unit about center of mass axis of the chain; is the rotation angle of monomer unit from the a-axis of the crystal, for a given time t.
The potential energy of the molecular chain is defined as
| (2) |
where, and are constants associated with dipole moment of TGTG´ unit and is torsional constant. The first two terms (in Eq. 2) denote the combined inter-chain interaction potential with external electric field and last term appears as potential energy due to the torsional rigidity of the molecular chain.
The Hamiltonian for this modelled system can be written as
| (3) |
Taking the Brownian motion of adjacent chains and anharmonic phonon forces into consideration for energy transfer, the modelled system can be approximated to Langevin equation.Dvey-Aharon, Taylor, and Hopfinger (1980) The approximation to minimize the thermal contribution force term into the continuum limit, results a generalized double Sine - Gordon equation:
| (4) |
where, is the damping constant and c is the periodicity along chain axis. The possible solution to the above equation can be written as
| (5) |
where, d is the width of the kink. The above equation represents the motion of the soliton wave of electric polarization. For = 0 to = at any time t, (x,t) gives the probable propagation direction of kink that could travel from unpoled state to the poled state under the influence of applied electric field with kink velocity v. Eventually, resulting as a chain segment rotation by 180 degrees. i.e. the possible favorable pathway to achieve the -phase in PVDF chain by rotating its alternate second chain around c-axis.
Now, following the continuum approximation, the propagation speed of kink along c-axis is given by
| (6) |
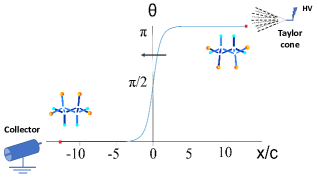
where, is the max kink velocity at larger electric field .Dvey-Aharon, Taylor, and Hopfinger (1980) As discussed by DveyAharon et al. that at larger electric fields, the kink velocity doesn’t depend on temperature. But at lower electric fields, the temperature plays a significant role to achieve the sufficient kink velocity for rotation. In our case, has been approximated to the limit to achieve a stable Taylor cone formation Kim et al. (2007), i.e. 0.1 MV/m, for -phase in electrospray system. We have predicted an approximated pathway, for -phase conversion in electrospray process (Fig. 3) by simulating the kink propagation model for a lamella size of 12 nm.Martín et al. (2017) Also, it is notable that, in Taylor cone formation, the polymer is initially present in gaseous state, associated with molecular chains having higher entropy and free energy. Eventually, leading the kink propagation at very much faster rate as compare to thin films, in presence of electric field of same strength. So, this might be further reason for even lesser field requirement to achieve the -phase in electrospray process. This theoretical model significantly predicts the phase conversion into -phase at lesser electric field that observed experimentally.
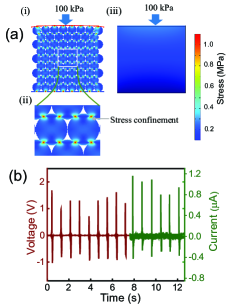
Furthermore, -PVDF nanoparticle based nanogenerator (NG) was prepared (Discussion S6, supplementary material), to show the application as an excellent piezoelectric energy harvester. The mechanical energy harvesting mechanism by the -PVDF nanoparticles made device was explored by the finite element method (FEM) based theoretical simulation. It has observed that the NG generates higher stress (Fig. 4(a)) and thus higher piezo-potential (Fig. S6, supplementary material), in comparison that of planar PVDF film based device, due to stress confinement effect under application of 100 kPa pressure. The energy harvesting performance of NG was experimentally recorded in terms of open circuit output voltage (Voc) and short-circuit current (Isc) by repetitive finger imparting motion with the applied force amplitude of 4.5 N. The peak to peak response generated (Fig. 4(b)) as Voc 2.8 V and Isc 1.4 A . The acoustic response of the NG was measured (with 40 W RMS) at 80 dB of sound pressure level (SPL) with tunable sound frequencies (40-140 Hz) (Fig. S7, supplementary material) indicating acoustic sensitivity of 2.75 V/Pa. This fact indicates that -PVDF nanoparticles are in-situ poled during the electrospray process, thus further electrical poling step is not required like typical piezoelectric based sensor, actuators and energy harvesters.
In summary, we conclude that -phase comprising PVDF nanoparticles were successfully fabricated through electrospray process under 0.1 MV/m of electric field. The ferro- and piezo- electric response of the -PVDF nanoparticle is evident from saturated phase response and from butterfly response in PFM, respectively. The piezoelectric coefficient (d33) was obtained -11 pm/V. The phase transformation study indicates that the -phase has relatively lower melting temperature of 165ºC than the -phase PVDF. Ferroelectric to paraelectric phase transition is also observed via DSC study. The -phase transformation in electrospray process can be predicated by kink propagation model and can justify the low electric field requirement. The fabricated nanogenerator has shown a very prompt response with output voltage of 2.8 V and 1.4 A current and can be useful in prospective applications for self-powered wearable electronics and sensors.
See supplementary material for experiment procedure, materials and methods.
Acknowledgements.
This work was financially supported by a grant from DST (DST/TMD/MES/2017/91), Government of India. V. G. is thankful to DST for awarding INSPIRE fellowship (IF180159).References
- Won et al. (2015) S. S. Won, M. Sheldon, N. Mostovych, J. Kwak, B.-S. Chang, C. W. Ahn, A. I. Kingon, I. W. Kim, and S.-H. Kim, Appl. Phys. Lett. 107, 202901 (2015).
- Reece et al. (2003) T. J. Reece, S. Ducharme, A. Sorokin, and M. Poulsen, Appl. Phys. Lett. 82, 142 (2003).
- Singh et al. (2014) P. Singh, H. Borkar, B. Singh, V. Singh, and A. Kumar, AIP Adv. 4, 087117 (2014).
- Ghosh and Mandal (2017) S. K. Ghosh and D. Mandal, Appl. Phys. Lett. 110, 123701 (2017).
- Martins, Lopes, and Lanceros-Mendez (2014) P. Martins, A. Lopes, and S. Lanceros-Mendez, Prog. Polym. Sci. 39, 683 (2014).
- Ghosh and Mandal (2016) S. K. Ghosh and D. Mandal, Appl. Phys. Lett. 109, 103701 (2016).
- Wang, Wang, and Yang (2016) S. Wang, Z. L. Wang, and Y. Yang, Adv. Mater. 28, 2881 (2016).
- Ranjan et al. (2007) V. Ranjan, L. Yu, M. B. Nardelli, and J. Bernholc, Phys. Rev. Lett. 99, 047801 (2007).
- Mandal, Yoon, and Kim (2011) D. Mandal, S. Yoon, and K. J. Kim, Macromol. Rapid Commun. 32, 831 (2011).
- Müller et al. (2008) K. Müller, D. Mandal, K. Henkel, I. Paloumpa, and D. Schmeisser, Appl. Phys. Lett. 93, 112901 (2008).
- Lovinger (1983) A. J. Lovinger, Science 220, 1115 (1983).
- Banik et al. (1979) N. Banik, F. Boyle, T. Sluckin, P. Taylor, S. Tripathy, and A. Hopfinger, Phys. Rev. Lett. 43, 456 (1979).
- Furukawa (1989) T. Furukawa, Phase Transit. 18, 143 (1989).
- Broadhurst et al. (1978) M. Broadhurst, G. Davis, J. McKinney, and R. Collins, J. Appl. Phys. 49, 4992 (1978).
- Lovinger (1981a) A. J. Lovinger, Macromolecules 14, 322 (1981a).
- Li et al. (2013a) M. Li, H. J. Wondergem, M.-J. Spijkman, K. Asadi, I. Katsouras, P. W. Blom, and D. M. De Leeuw, Nat. Mater. 12, 433 (2013a).
- Hasegawa et al. (1972) R. Hasegawa, Y. Takahashi, Y. Chatani, and H. Tadokoro, Polym. J. 3, 600 (1972).
- Hasegawa, Kobayashi, and Tadokoro (1972) R. Hasegawa, M. Kobayashi, and H. Tadokoro, Polym. J. 3, 591 (1972).
- Bachmann et al. (1980) M. Bachmann, W. Gordon, S. Weinhold, and J. Lando, J. Appl. Phys. 51, 5095 (1980).
- Dvey-Aharon, Taylor, and Hopfinger (1980) H. Dvey-Aharon, P. Taylor, and A. Hopfinger, J. Appl. Phys. 51, 5184 (1980).
- Naegele, Yoon, and Broadhurst (1978) D. Naegele, D. Yoon, and M. Broadhurst, Macromolecules 11, 1297 (1978).
- Davis et al. (1978) G. Davis, J. McKinney, M. Broadhurst, and S. Roth, J. Appl. Phys. 49, 4998 (1978).
- Lovinger (1981b) A. J. Lovinger, Macromolecules 14, 225 (1981b).
- Costa and Giacometti (1993) M. M. Costa and J. A. Giacometti, Appl. Phys. Lett. 62, 1091 (1993).
- Anwar and Asadi (2019) S. Anwar and K. Asadi, ACS Macro Lett. 8, 525 (2019).
- Davies and Singh (1979) G. Davies and H. Singh, Polymer 20, 772 (1979).
- Li et al. (2013b) M. Li, I. Katsouras, K. Asadi, P. W. Blom, and D. M. De Leeuw, Appl. Phys. Lett. 103, 072903 (2013b).
- Martín et al. (2017) J. Martín, D. Zhao, T. Lenz, I. Katsouras, D. M. de Leeuw, and N. Stingelin, Mater. Horiz 4, 408 (2017).
- Gan, Abd Majid, and Furukawa (2016) W. Gan, W. Abd Majid, and T. Furukawa, Polymer 82, 156 (2016).
- Servet and Rault (1979) B. Servet and J. Rault, J. Phys. 40, 1145 (1979).
- Qian et al. (2018) J. Qian, S. Jiang, Q. Wang, S. Zheng, S. Guo, C. Yi, J. Wang, X. Wang, K. Tsukagoshi, Y. Shi, and Y. Li, Sci. Rep. 8, 532 (2018).
- García-Zaldívar et al. (2017) O. García-Zaldívar, T. Escamilla-Díaz, M. Ramírez-Cardona, M. Hernández-Landaverde, R. Ramírez-Bon, J. Yañez-Limón, and F. Calderón-Piñar, Sci. Rep. 7, 1 (2017).
- Fu et al. (2020) C. Fu, H. Zhu, N. Hoshino, T. Akutagawa, and M. Mitsuishi, Langmuir 36, 14083 (2020).
- Wilm and Mann (1994) M. S. Wilm and M. Mann, Int. J. Mass Spectrom. Ion Processes 136, 167 (1994).
- Ince-Gunduz et al. (2010) B. S. Ince-Gunduz, R. Alpern, D. Amare, J. Crawford, B. Dolan, S. Jones, R. Kobylarz, M. Reveley, and P. Cebe, Polymer 51, 1485 (2010).
- Tashiro et al. (2021) K. Tashiro, H. Yamamoto, S. Kummara, T. Takahama, K. Aoyama, H. Sekiguchi, and H. Iwamoto, Macromolecules 54, 2334 (2021).
- Al-Jishi and Taylor (1985) R. Al-Jishi and P. Taylor, J. Appl. Phys. 57, 902 (1985).
- Burkard and Pfister (1974) H. Burkard and G. Pfister, J. Appl. Phys. 45, 3360 (1974).
- El-Sayed, Abdel-Baset, and Hassen (2014) S. El-Sayed, T. Abdel-Baset, and A. Hassen, AIP Adv. 4, 037114 (2014).
- Vaseashta (2007) A. Vaseashta, Appl. Phys. Lett. 90, 093115 (2007).
- Ryan, Smith, and Stark (2012) C. Ryan, K. Smith, and J. Stark, J. Appl. Phys. 112, 114510 (2012).
- Dvey-Aharon et al. (1980) H. Dvey-Aharon, T. J. Sluckin, P. L. Taylor, and A. J. Hopfinger, Phys. Rev. B 21, 3700 (1980).
- Dvey-Aharon, Taylor, and Hopfinger (1980) H. Dvey-Aharon, P. L. Taylor, and A. J. Hopfinger, J. Appl. Phys. 51, 5184 (1980).
- Kim et al. (2007) H. Kim, D. Luo, D. Link, D. A. Weitz, M. Marquez, and Z. Cheng, Appl. Phys. Lett. 91, 133106 (2007).