Near real-time streaming analysis of big fusion data
Abstract
While experiments on fusion plasmas produce high-dimensional data time series with ever increasing magnitude and velocity, data analysis has been lagging behind this development. For example, many data analysis tasks are often performed in a manual, ad-hoc manner some time after an experiment. In this article we introduce the Delta framework that facilitates near real-time streaming analysis of big and fast fusion data. By streaming measurement data from fusion experiments to a high-performance compute center, Delta allows to perform demanding data analysis tasks in between plasma pulses. This article describe the modular and expandable software architecture of Delta and presents performance benchmarks of its individual components as well as of entire workflows. Our focus is on the streaming analysis of ECEi data measured at KSTAR on NERSCs supercomputers and we routinely achieve data transfer rates of about MByte per second. We show that a demanding turbulence analysis workload can be distributed among multiple GPUs and executes in under minutes. We further discuss how Delta uses modern database systems and container orchestration services to provide web-based real-time data visualization. For the case of ECEi data we demonstrate how data visualizations can be augmented with outputs from machine learning models. By providing session leaders and physics operators results of higher order data analysis using live visualization they may monitor the evolution of a long-pulse discharge in near real-time and may make more informed decision on how to configure the machine for the next shot.
1 Introduction
Experiments and plasma diagnostics of ever increasing sophistication are used to develop magnetic fusion solutions that will power global energy demand. While current tokamaks operate in a pulsed manner, future fusion power plants need to operate in steady state or with long pulses to deliver base load electricity. At the same time sample plasma diagnostics fusion plasma with ever increasing spatial resolution and sampling frequencies, resulting in ever increasing data volumes and data rates from experiments. Get historic shot data sizes in MDS for NSTX. Under routine operation, ITER is expected to generate about two Petabytes of data per day. And while preliminary data analysis will take place on site, in-depth analysis of the measurements as well as comparison with numerical simulations will take place at computational centers operated by the individual ITER members.
Increasing data volume and data rates are met by a dichotomy of growth in compute power and growth in capacity of the storage systems at High Perfomance Computing (HPC) systems. Over the last 20 years, the floating point operations of all systems listed in the top500 list increased approximately tenfold every four years 111https://www.top500.org/statistics/perfdevel/. The performance of the I/O systems of the Top500 supercomputer has only been tracked for the last four years, and the peak bandwidth of the fastest system increased approximately four-fold. 222https://www.vi4io.org/io500/start. With abundant computing resources and more scarce I/O resources, computationally intensive data analysis and workflows that are based on that data, need to be implemented in a streaming manner in order to optimally scale with future trends in HPC. That is, dropping the requirement to wait on the data to load from the I/O systems allows streaming data analysis methods to make full use of advances in computing power. At the same time does streaming analysis offers streaming analysis a faster turnaround time for data analysis.
In this paper we are presenting a streaming data analysis framework that aims to connect fusion experiments with remote HPC resources Choi et al. [2016], Ralph Kube et al. [2020], Kube et al. [2020], Churchill et al. [2021]. The streaming paradigm implemented by this framework allows the big- and fast data generated by fusion experiments to be seamlessly analyzed using supercomputers as they are generated. Our framework also includes a component for web-based near real-time data visualization. As soon as the data is analyzed it can be visualized on a the visualization dashboard and at any place in the world connected to the internet. By combining a robust streaming protocol with near real-time analytics and visualization we aim to tie together multiple threads that are currently emerging in the analysis of fusion data. First, machine operators and session leaders may make more efficient use of machine time by having access to higher order data analysis immediately after a plasma discharge has finished. Second, interested scientists across the globe have direct access to results from experiments. And third, this approach provides means to store large sets of analyized fusion data together with descriptive meta-data, making it suitable to continuously train data-intensive machine learning models as experiments are commencing.
Current research in support of long-pulse steady state plasma operations focuses on the development of real-time analysis algorithms for camera as well as thermographic data. At Wendelstein 7-X Sitjes et al. [2018], Jakubowski et al. [2018], Pisano et al. [2020] and WEST Mitteau et al. [2021], such developments aim to protect the machine from failures of actively cooled power exhaust solutions as well as to monitor their performance. In order to do so, such systems analyze camera data and interact in real-time with a local plasma control system. Using real-time control systems as downstream consumers of the data analysis sets stringent limits on the runtime of the data analysis routines that can be performed on the camera data in this situation. At the other end of the spectrum in a fusion scientists toolbox lies integrated modeling. This describes the coupling of individual physics and engineering codes with the goal of modeling and understanding of plasma discharges Poli [2018]. Data analysis software, such as OMFIT Meneghini et al. [2015], can be used to manage integrate individual codes into flexible analysis workflows. As of now, these workflows are usually performed on local compute clusters and resort to low-fidelity or time-independent models, when they are run in between pulses. Often, more demanding modelling is run ad-hoc after an experiment has concluded. Previous research work on automatic remote post-shot data analysis and simulation is described in Kostuk et al. [2018]. Here, measurements from the DIII-D tokamak are used as input for numerical simulations that were performed on a supercomputer at the Argonne National Laboratory Leadership Compute Facility immediately after the plasma pulse. In this approach the supercomputer connected directly to the fusion experiment’s MDSplus 333http://www.mdsplus.org database and submitted simulations into a high-priority queue using the supercomputers job scheduler.
In this article describe the design and implementation details of our aDaptive nEar reaL-Time Analysis (Delta ) framework. As a use-case we focus on the remote analysis of KSTAR electron cyclotron emission imaging (ECEi) measurements using the Cori supercomputer, operated by the National Energy Research Scientific Computing Center (NERSC). KSTAR is located in the Daejeon in the Republic of Korea and NERSC is located in Berkeley, California. Both sites are about 9,000 kilometers apart and are connected through a network link with 100 GB/sec bandwidth, carried by Kreonet 444https://www.kreonet.net/eng and the Energy Sciences Network (ESnet) 555https://www.es.net/. Besides high-performance computing resources, NERSC operates container orchestration services that allow to run web-based services to support scientific projects. Furthermore accommodates Cori’s job scheduler real time quality of service for processing needs with external real-time constraints. These amenities available at NERSC make it a useful target to deploy near real-time analysis capabilities for remote experiments. With Delta we aim to develop a framework that makes these kind of approaches easy to implement and available for broader applications, more diagnostics.
The remainder of this article is structured as follows: In sec. 2 we describe the design approaches and choices made for Delta . Sec. 3 describes in detail two example applications that Delta allows to routinely perform during tokamak operations. Sec. 4 presents performance benchmarks of Delta and sec. 5 describes details of the implemented web-based visualization system. Finally, sec. 6 gives conclusions and pointers for future work.
2 The adaptable near real-time analysis framework
Delta aims to connect fusion experiments, HPC resources, and scientists by facilitating near real-time streaming analysis of big fusion data and provide immediate visualization of the results. This description can be translated into the following requirements on the system. First, to move big and fast data from experiment to HPC, a robust network link is required. Second, a streaming protocol, optimized for the needs of scientific data should be used. Third, it should be easy to perform user-defined data analysis kernels on the incoming data stream. Fourth, once a data packet has been analyzed it should immediately be made available to data visualization or other downstream consumers. And finally, access to data visualization should be readily accessible. The first requirement is a hardware constraint. The work discussed in this contribution focuses on measurements of KSTAR plasmas on Cori, located at the National Energy Research Scientific Compute Center. These sites are connected through the Energy Sciences Network and data transfer rate benchmarks are reported in Churchill et al. [2021]. Second, Delta uses ADIOS2 Godoy et al. [2020] as a streaming library. This library, which is part of the United States Department of Energy Exascale Computing Project (ECP) software technology stack for data and visualization, allows to effortlessly transport data in a peer-to-peer manner across Wide-Area-Networks. It implements a time-step abstractions which mimics the time-sample production cycle of measurements at fusion experiments. Addressing the third prong, Delta is implemented in python and implements a streaming architecture, where data kernels are applied to individual data packets. This allows to readily include user-written kernels in any workflow. After applying a data analysis kernel on a data packet, the results are immediately stored. This satisfies the fourth requirement. And addressing the final requirement, Delta features a web-based visualization dashboard, which can be accessed from anywhere.
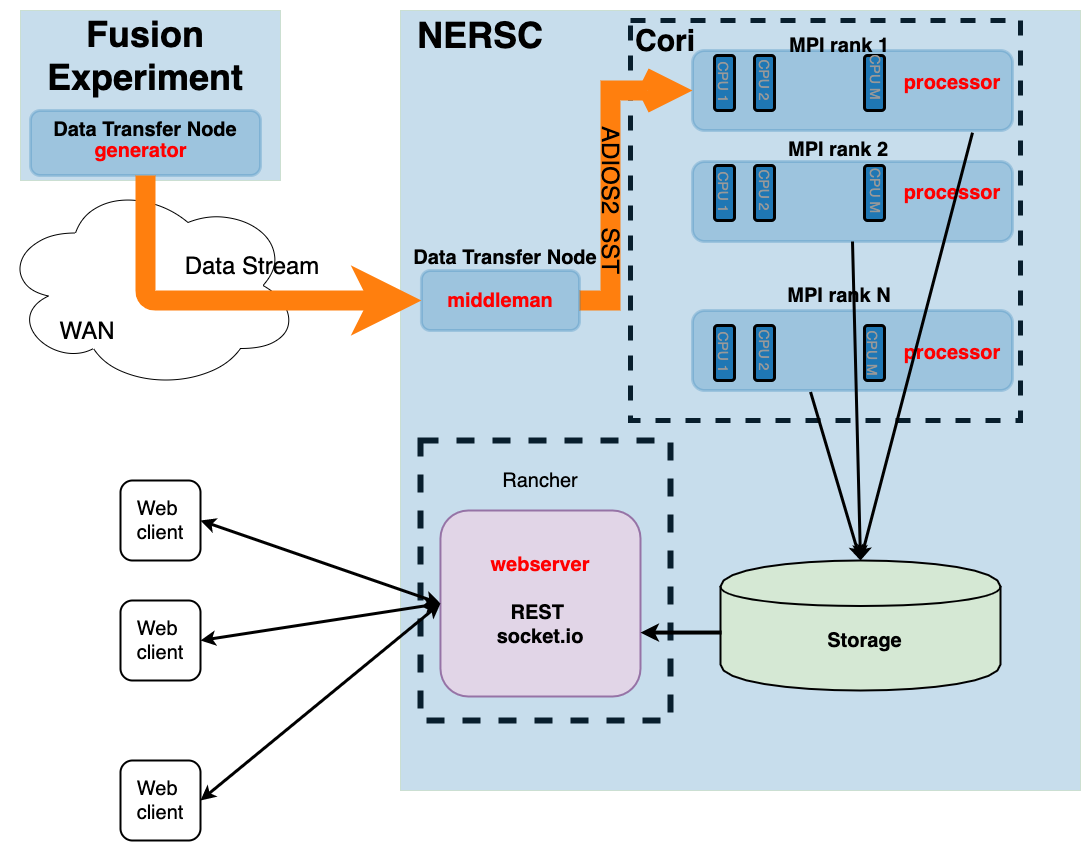
To connect fusion experiments with HPC resources, Delta is implemented as a distributed system. Fig. 1 presents an overview of the systems that Delta couples. At the site of the fusion experiment, a generator runs on a Data Transfer Node (DTN). A DTN is a server that is optimized for WAN data transfers. After an experiment has finished, the generator loads the measurement data, stages it for streaming, and transmits it. For this section of the route we are using the DataMan streaming protocol implemented by ADIOS2. At a DTN of the target HPC center, a middleman relays the data stream to the target HPC resource. Employing a relay node enables to receive the stream using the high performance network interface of the DTN. It also enables to forward the stream to the target HPC resource using the SST protocol which is designed for use in HPC environments. The processor runs as an MPI program on the target HPC resource. It receives the data stream and executes data analysis code using distributed compute resources. The analyzed data is stored in a database immediately after it has been calculated. This database is accessible by both, the HPC resource and externally facing services. At NERSC, the web-based dashboard runs on Spin, a container orchestration service based on Rancher666https://www.rancher.com.
While the overall architecture of Delta is flexible and its different components may run at systems that are networked together, it benefits from the resources available at NERSC. For one, it makes use of distributed storage solutions that are available from both, the used HPC resource and the externally facing container orchestration service. And it uses the container orchestration service to host the web-based visualization service on-site. Deploying Delta at HPC centers without such infrastructure is possible, but with the additional burden of having to implement a service that moves data analysis results to the visualization service.
2.1 Software architecture and abstractions
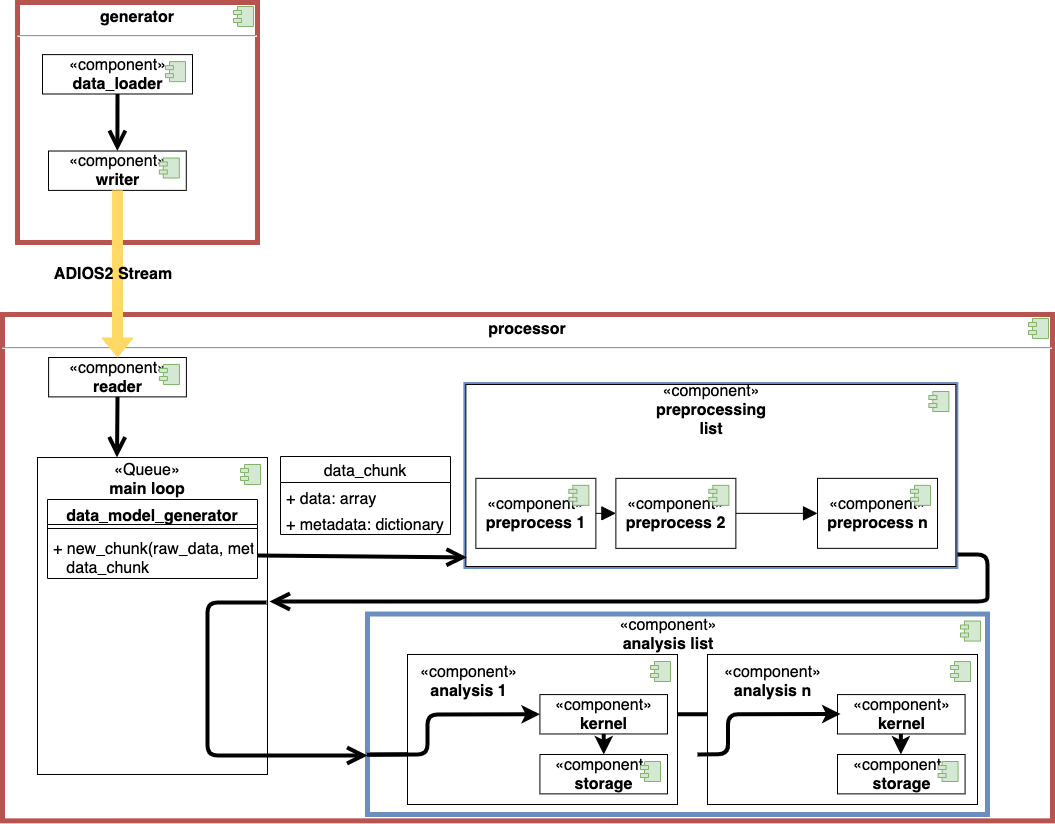
To perform data analysis, Delta moves data from an experiment to a HPC resource. Figure 2 illustrates the software architecture that facilitates this task. The goals of the architecture are to provide abstractions to handle data from various plasma diagnostics, for data streaming, and for data analysis workflows. These abstractions are implemented as an object-oriented design.
Data loading and staging for streaming is implemented through a data_loader. Methods of this class load the measurement data together with relevant metadata from storage, such as files or local databases into memory. Once loaded in memory, the data_loader exposes that data as a low-dimensional time series through an iterator interface. The metadata of the measurements, for example sample frequency or parameters of the diagnostic, are exposed as class attributes. At each iteration a chunk consisting of a fixed number of consecutive samples is returned, starting from the beginning of the time series. And once the iterator is exhausted, the entire measurement time series has been iterated over.
A reader and writer implement data streaming. In particular, the reader sends data chunks, produced by the data_loader, as individual time-steps through an ADIOS stream. These chunks include both, time series data as well as metadata. Once received by the reader, the processor instantiates an appropriate data_chunk object from the time-step data, which includes both time series data as well as metadata. This metadata may be used as parameters for the follow pre-processing and data analysis tasks.
Delta implements a linear two-stage data analysis workflow that is commonly used for the analysis of fusion data. In the first pre-processing stage, the data is subject to filters, such as smoothing or bandpass filters. These operations are performed when measurements are subject to noise or the phenomena of interest are restricted to certain frequency bands. A series of filters, which mutate the data in a data_chunk are succesively applied. Following the pre-processing, the data analysis stage applies data analysis kernels to the chunks. These transformations act as sinks, by storing the transformed data and returning nothing. Without downstream dependencies, the data analysis kernels are performed in parallel.
This linear two-stage workflow model is static and stateless, i.e. each data_chunk will be transformed in exactly the same way. Delta implements this workflow in a data-parallel mode by implementing a master-worker pattern in the generator, centered around the incoming data stream. The main thread receives the data stream and inserts each chunk into a first-in-first-out (FIFO) queue. Simultaneously, a group of worker threads pop chunks from the queue. A given thread then submits its chunk into the pre-processing queue, waits for it to return, and then to data analysis kernels. The pre-processing and data analysis is performed on the distributed compute resources, using the mpi4py library Dalcin and Fang [2021]. In particular, Delta implements the execution of the pre-processing workflow and the analysis kernels as a callable. This allows the the worker threads to run the workflow tasks on a pool of worker processed exposed by mpi4py through a PEP-3148 777https://github.com/python/peps/blob/master/pep-3148.txt compatible interface.
This architecture of Delta allows to perform the entire data analysis chain, starting by reading measurements from file and ending when the data analysis results are stored, completely in memory, across multiple computer systems. By performing in-memory streaming, Delta does not use any file-based I/O and thus avoids performance issues caused by I/O variability Xie et al. [2017]. Another design choice is that Delta uses a process pool to access distributed compute resources. Making this design choice trades simplicity for customizability as all available MPI ranks are divided evenly among the processes. There is no way to designate additional compute resources to more demanding analysis tasks. Finally, the run-time configuration for Delta is defined in a central configuration file. This configuration file defines what data to load, parameters for the data streaming, the pre-processing and analysis pipelines as well as the storage backend to be sued. All components that make use of this configuration file are denoted with a green square in Fig. 2. Given a configuration file and the exact version of Delta that was used, any data analysis can be reproduced as long as the original measurement data are available.
A web-server that is running on NERSCs Spin service 888https://www.nersc.gov/systems/spin/ serves dashboards with plots. While Spin is an external facing service with no direct access to HPC resources, it has access to the database into which the data analysis kernels write. With knowledge of the database scheme, the web server can fetch the data requested by clients and render a plot on a web site which is then delivered to the client. As the data analysis workflow, the web-based visualization allows for multiple servers to run at the same time. Spin can seamlessly scale this service by adding web server instances on demand. And the limiting factor for the visualization are the bandwidth from Spin to the database that stores the analysis results.
3 Applications
Operating Delta along side plasma experiments allows to automatically perform large-scale data analysis and present informative data visualizations. This section describes two example applications for Delta , one that make use of the available compute power of the Cori supercomputer and one that uses machine learning to augment data visualizations. Both of these applications use data produced by the KSTAR ECEi system Yun et al. [2014].
3.1 Automated turbulence analysis
The largest data producer at the KSTAR tokamak is the Electron Cyclotron Emission imaging (ECEi) system. Sampling ECE at three different toroidal views of 24 by 8 pixels on a microsecond time scale, this system produces data at a rate of about 1 GB/s. ECE data can be used to infer perturbations of the electron temperature relative to a time-average, . The KSTAR ECEi diagnostic maps the 24 by 8 array onto an approximately 10 by 40 cm large view of plasma column in the radial-poloidal plane. It is thus regularly used to visualize magneto-hydrodynamic modes, such as magnetic islands or ELM precursors Park et al. [2019]. And spectral quantities, such as the cross-power, coherence, cross-phase or cross-correlations from channel-pair combinations of the ECEi samples, are regularly used to investigate flow phenomena such as the interaction between magnetic islands and the background turbulence, or studying avalanche-like electron heat transport in the core plasma Choi et al. [2017, 2019].
Using Delta , a spectral analysis of core turbulence can be performed automatically after each plasma shot. For this we define the spectral cross-power , the coherence , the cross-phase and the cross-correlation as
| (1a) | ||||
| (1b) | ||||
| (1c) | ||||
| (1d) | ||||
where denotes angular frequency, denotes the expected value operator, † denotes complex conjugation, and and denote Fourier-transformed time series. These quantities are regularly used in analysis of turbulent heat flows in the core of fusion plasmas, and provide information on local dispersion relation and have also been used to identify avalanche-like transport events Choi et al. [2017, 2019].
The ECEi diagnostic samples cyclotron radiation using an array of by pixels so that there are possible channel pair combinations for which to calculate Eq. 1. Typical pulse lengths at KSTAR are 5 seconds, in which the ECEi samples samples. This time series is partitioned into time-chunks, of samples by the generator. In a streaming setting, any calculation is performed individually on each time-chunk. After normalizing each chunk, the chunks are streamed to the processor. There, each chunk is Fourier transformed by a pre-processing routine and subsequently analysis kernels that implement Eqs. 1 are applied to the pre-processed chunk.
This computationally demanding workflow is an exemplary workflow which can be automatically performed using Delta . It automatically provides researchers with detailed analysis of core plasma turbulence. Mining such data automatically for each plasma pulse would allow compile a large database which could be of use for pattern recognition algorithms. Alternative use-cases for Delta would be integrated modeling simulations based on time-slice measurements or tomographic inversion of bolometry data. For the remainder of the article we use the ECEi turbulence workflow as a benchmark to characterize the performance of the Delta framework and identify bottlenecks that arise as a consequence of the implemented architecture.
3.2 Automated image analysis
Automatic image analysis and visualization is another task that is readily implemented using the Delta framework. Again, we consider ECEi data, whose spatial sampling of fluctuation has been crucial to identify details of MHD instability physics in KSTAR plasmas Park et al. [2019]. For example, ECEi data has been used in combination with a simplified tearing mode model to estimate stability parameters of magnetic islands Choi et al. [2014]. As an example of how automatic image analysis and visualization may be incorporated in Delta we consider the task of identifying magnetic island structures in ECEi data.
Magnetic islands are located around rational field lines and are structures where the topology of a fusion plasma is not a set of nested flux surfaces. Instead, a magnetic island appears as flux surface that has been split open into an elliptic structure, with a half-axes oriented along the radial and poloidal directions. This splitting of the field lines is associated with magnetic reconnection and magnetic islands are associated with resistive MHD instabilities, such as tearing modes Waelbroeck [2009]. With one half-axis of the magnetic island oriented along the radial direction, the perturbed magnetic field lines span a range of radial positions. Electrons that follow the perturbed field lines can then quickly transport heat across this range of radial positions. Magnetic islands can thus flatten the electron temperature profile once they are sufficiently large. The footprint of this effect in ECEi data are so-called radial phase inversion structures, quadrupole-like coherent patches in the local measurements Choi et al. [2016].
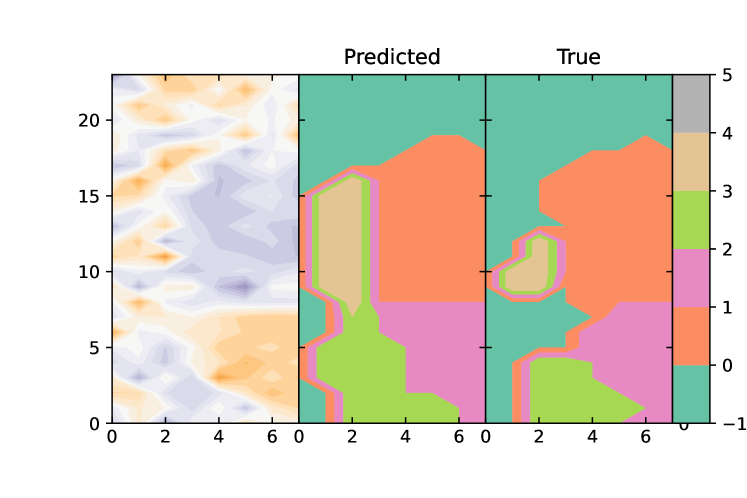
Image segmentation is a computer vision task that identifies structures in images. In particular, semantic segmentation assigns each pixel a label that identifies it with a set of pre-determined structures. This task can be applied to ECEi data to identify radial phase inversion structures associated with magnetic islands. Figure 3 illustrates this principle. The leftmost contour plot shows and the radial phase inversion structure occupies the lower 80 percent of the image. There are two prominent peaks of opposite sign spanning rows 4 to 7. Left from those peaks are structures with opposite phase, hence the name radial phase inversion structure. Segmentations of this image using 5 labels is shown in the other two. Here labels 1 through 4 denote the individual peaks of the radial phase inversion structure and background pixels are labelled with 0. Since the measurements are subject to noise the manually provided labels are always subject to biases.
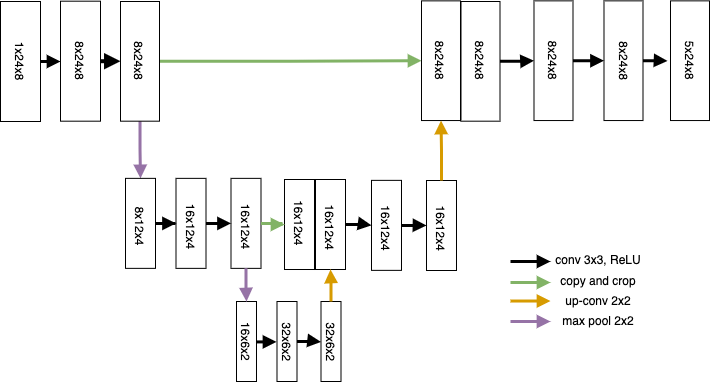
A well-established model for semantic segmentation tasks is the U-Net model Ronneberger et al. [2015]. It consists of a symmetric encoder-decoder structure where the encoder is comprised of a series of convolutional and pooling layers. This is a common architecture in convolutional neural networks. The decoder then expands the encoded information by applying the same number of transpose convolutions until the data has approximately the same size as the input. In addition, skip connections propagate information from the different stages of the encoder to stages of appropriate size in the decoder. Since ECEi data is given as 24 by 8 pixel images, the original U-Net architecture needs to be dramatically simplified in order to work with this data. The adapted architecture first applies two convolution to the data. The first convolution increases the image from to channels and is followed by applying a rectified linear unit (ReLU). After the second convolution, a max pooling operation is performed. The second and third convolutional blocks in the encoder apply the same operations and increase the number of channel from to to . In the expansive decoder part, the input is first subject to a up-convolution and then concatenated with the output of the encoder block of matching size along the channel dimensions. This data is then passed through two convolutional layers using filters and a padding of 1 in order to preserve image resolution. The final convolutional layer maps the previous layer onto the number of pixel classes, in our case. This architecture has been implemented using pytorch Paszke et al. [2019], the source code is available here Kube [2021].
We compiled a training set by manually segmenting images with visible radial phase inversion structures. To train the network we augment this set using random crops of size , , and pixels, rescaled to the original resolution, as well as with a set of duplicate images where random noise has been added. This yields in total training samples, percent of these images are used for training and % are used as a validation set. We use the ADAM optimizer Kingma and Ba [2017] to optimize a categorical cross entropy loss function Good [1952], which is commonly used for semantic segmentation tasks. This loss function calculates a per-pixel loss between the correct label and the label probabilities predicted by the network. In order to interpret the network output as a probability, a softmax function is applied pixel-wise to the final layer. Starting with a learning rate of , we find that the per sample loss on a test set is minimized after about epochs.
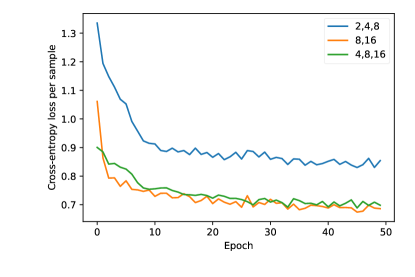
In order to identify optimal parameters for the architecture we varied the number U-Net layers, the number of channels in the convolutions, the batch size used for training, as well as the optimizer. Empirically we find that the model performs well as long as one uses at least two convolutional layers in the U-Net architecture, and at least 16 channels. More shallow U-net architectures perform worse. This is shown in Fig. 5, where we plot the per-sample loss calculated over the validation set over the training of three different U-Nets. The first one has three convolutional layers, respectively with 2, 4, and 8 channels. The second one has two convolutional layers, with 8 and 16 channels, and the third U-Net has three layers, with 4, 8, and 16 channels. Just increasingthe number of convolutional channels from 8 to 16 decreases the per-sample loss by about 30%. When varying the mini-batch size, the results in Fig. 5 are obtained using a mini-batch size of , but found only negligible effect on the loss. Stochastic gradient descent with a learning rate of performed on-par with the ADAM optimizer when we used a learning rate scheduler that divided the learning rate by two on plateaus.
The forward pass for such simple models requires only little computational power, the models discussed above have between and parameters. Thus, this model van be seamlessly integrated into the server that serves visualization dashboards, as discussed in sec. 5. Such machine learning models can also be used in the pre-processing stage. By adding image segmentation information to a chunks metadata, they could target data analysis tasks to certain parts of the image.
4 Performance Benchmarks
Delta is a complex distributed system that runs on high-performance computing resources to analyze data streams in near real-time. Even though it uses traditional HPC libraries and follows a traditional single program multiple data paradigm, their usage pattern in Delta differs from traditional HPC software, such as numerical simulation codes. Particularly, Delta implements a master-worker architecture where the main loop distributes pre-processing and analysis tasks to a large number of workers. Workers are instantiated on demand as separate threads or processes and execute user defined pre-processing and analysis tasks, which could by frequency filters, short-time Fourier transformations, coherence functions for signals, or even tomographic inversion analysis of bolometry data Ingesson et al. [1998], Montisci et al. [2021]. All of these examples have widely different algorithmic complexity, such as for the Fourier transformation, for coherence functions, assuming that the data has been Fourier transformed, and algorithms that implement such analysis often perform best using different memory access patterns. Delta aims to facilitate the performant execution of a broad range of algorithms in a streaming setting, where data analysis tasks may change from one run to another. And optimizing the framework for the execution of certain tasks may lead to performance bottlenecks for other tasks. Thus, Delta distributes all available resources equally among the workers. This is in contrast to traditional HPC software for numerical simulations, where a-priori knowledge of the algorithms, memory access patterns, sequence of operations, and the data can be used to optimize execution on any given hardware.
4.1 Individual components
As a first step in understanding the performance of Delta we evaluate the performance of its individual components in a synthetic setting. In the following we explore the performance of the network connection between KSTAR and NERSC, the filesystem on NERSC as well as implementation of Eqs.(1) for graphical processing units (GPUs).
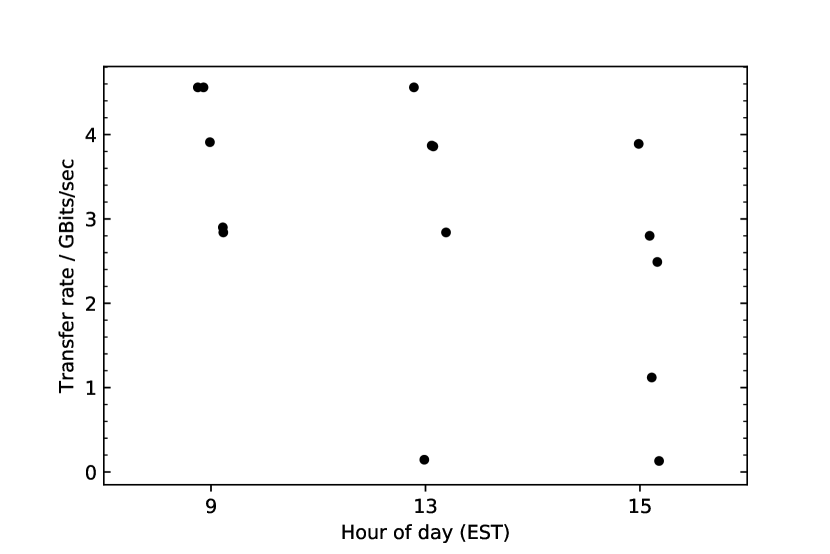
Network traffic originating from the KSTAR DTN is routed through Kreonet and ESnet to NERSC, on a shared 100 GB/sec link. As a shared link, the achievable bandwidth is subject to fluctuations between streaming events. In order to establish a baseline of the expected bandwidth and to characterize link variability we measured the achieved bandwidth in multiple runs of the iperf benchmarking tool 999https://iperf.fr/ over one week in August 2021. As shown in Fig. 6, the link consistently sustains data transfers at rates over Gbits per seconds. At several occasions we observe that the link peformance was degraded, which may be due to traffic congestion from other applications. We do no observe a dependence of the sustained data transfer rate on the time of day.
We continue by evaluating the performance of computational kernels implementing Eqs.(1). Previous work showed that kernels which implement Eqs(1) for central processing units (CPUs) can utilize multithreading and scale linearly with the numbers of threads. In this work we utilize a kernel that fuses calculations of Eq.(1a), (1b), and (1c) for a a given channel pari ) and runs on GPUs. We implement this kernel using the CUDA interface for numba Lam et al. [2015]. The kernel launch can be configured using up to 1024 hardware threads. Running on Cori we measure the kernels runtime as approximately when launching with threads. For and threads we observe changes in runtime less than and therefore set as the default number of threads used in the remainder of this article. Equation (1d) is implemented by a separate kernel and also runs on the GPU. But as it only consists of a inverse Fourier Transformation it has no free parameters and we report on its performance only in the context of a complete data analyis workflow in the following subsection.
4.2 Cori scaling and performance
To evaluate the performance of Delta , we perform the benchmark ECEI workflow described in Sec. 3 on the newly added GPU partition on Cori. This partition consists of 18 nodes, each with two 20-core Intel Xeon Gold 6148 CPUs, 384 DDR4 memory and 8 NVIDIA Tesla V100 GPUs, each with 16 GB HBM2 memory. These nodes are networked through 4 dual-port Mellanox MT27800 EDR InfiniBand HCAs. The benchmark workflow consists of calculating a short-time Fourier Transformation of each data chunk, followed by evaluating Eqs. 1. We configure Delta to execute as an MPI program where the root process executes the main loop and serves as a master process for all child processes. Spawned from the master process, a number of worker threads submit individual time chunks into a pre-processing queue and finally into a analysis queue. The pre-processing routines are executed as individual threads by the root process. While this limits the number of time chunks that can be pre-processed simultaneously it avoids MPI communication overhead as threads can access the time-chunks through shared memory. This is advantageous given the small size of the time-chunks. The analysis tasks are distributed among the MPI ranks. Each MPI rank executes a fused calculation of Eqs.(1a) - (1c) into a single kernel as well as a kernel that implements Eq.(1d) on a GPU. Table 1 lists the number of worker and pre-processing threads as well as the number of MPI ranks that were used for the analysis.
| Resource | Number of parallel execution units |
|---|---|
| Queue worker threads. | 1, 2, 4 |
| Pre-processing threads | 1, 2, 4, 8 |
| Analysis MPI ranks | 1, 2, 4, 8, 16, 32 |
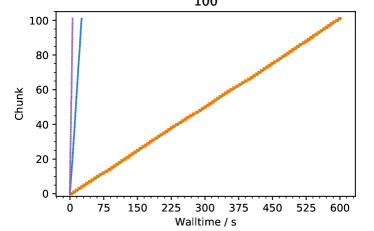
The Delta processor allows to specify the number of queue worker threads that pop time-chunks from the main-loop’s queue, the number of threads that execute pre-processing tasks, as well as the number of MPI ranks to which analysis tasks are assigned. To understand how well additional resources are used by Delta we define two resource allocation scenarios, one sparse and one plentiful. Allocation A includes a single queue worker task to pop time chunks from the main loop’s queue and submit them to the pre-processing and data analysis pipelines, a single thread to execute the pre-processing pipeline and a single MPI rank with a dedicated GPU, to execute the data analysis kernels. Allocation B includes 4 queue worker threads, 8 threads for pre-processing and 32 MPI ranks for data analysis. As shown in Figures (7a) and 7b, providing an increased number of computing resources reduces the walltime required to perform the benchmark workflow. Running within allocation A, Delta performs the benchmark workflow in about 300 seconds. While all 100 time chunks had been pre-processed after about seconds, their subsequent analysis took about 300 seconds to execute. Figure 7a also shows that all time chunks are processed in-order, that is, in the order in which the respective pre-processing and analysis tasks are submitted. Running within allocation B reduces the required walltime to about seconds, as shown in Fig. 7b. Time chunks are immediately pre-processed and data analysis does not start until about 5 seconds into the run. We observe that this causes a delay for pre-processing. And similar as with resource allocation A do all compute tasks, pre-processing and data analysis, begin execution in regularly spaced time intervals. In other words, the selected software architecture facilitates robust execution of incoming data time chunks on the allocated distributed compute resources. We do not observe any behaviour of the compute resource that blocks the execution of the streaming data analysis.
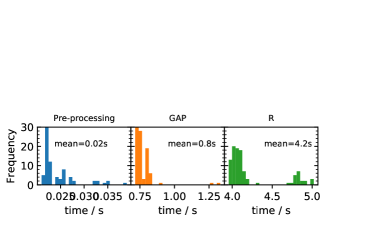
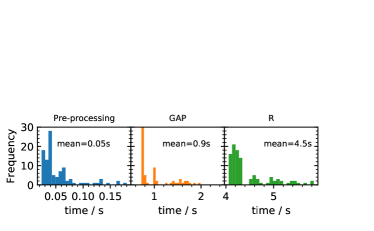
We continue by investigating the performance of the individual compute tasks, pre-processing and data analysis, when launched using resource allocations A and B. Figure 8 shows frequency counts of their measured execution time, which form a uni-modal histogram for both, allocations A and B. When executed under allocation B, we observe a larger spread in the execution time. This may be caused by circumstantial factors that arise when a compute resource is subject to higher load, such as increased network and I/O loads. But on average the execution time for individual compute tasks does not vary significantly.
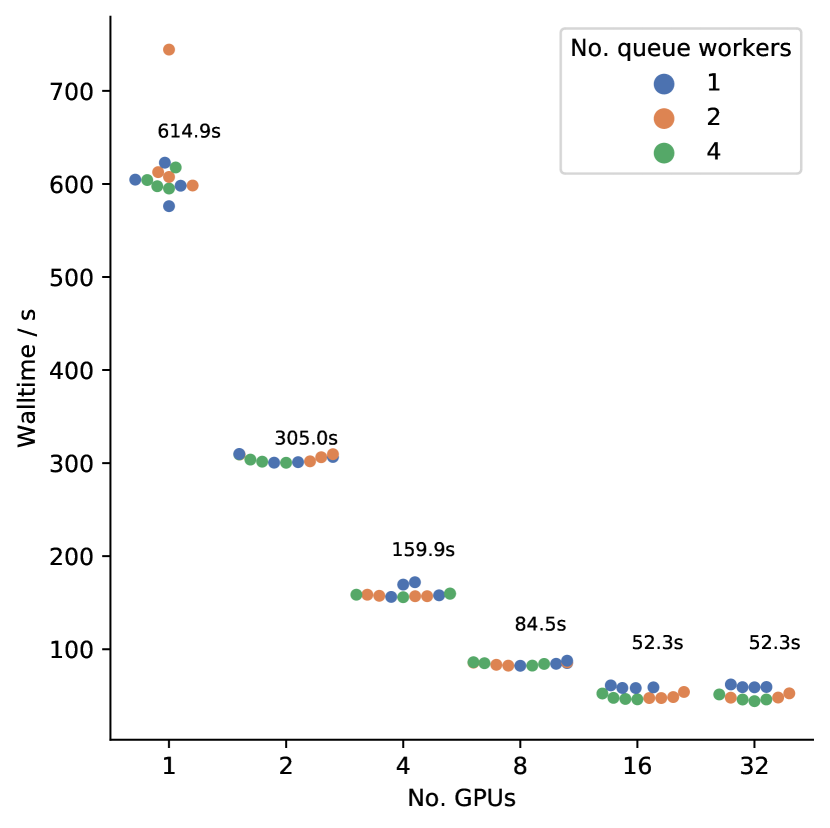
Finally, Figure 9 shows the wall time it takes to execute the benchmark workflow for resource allocations given by all possible combinations of the parameters listed in Tab. 1. The data point cloud centered around the number of GPUs available denotes runs with varying number of queue workers, also encoded in color, and number of threads available to pre-processing and the average of all walltimes is given next to each point cloud. We find that varying either affects the walltime only marginally. Running on a single GPU, Delta executes the benchmark workflow in about seconds. Doubling the allocated GPUs decreases the average walltime by half down to about seconds on allocations up to GPUs. Adding further compute resources to the allocation does not decrease the walltime any further. This limit of about seconds is due to the time it takes to pre-process the data. As configured for the benchmark runs, Delta performs pre-processing using multiple worker threads on the root node. Limited by the hardware threads of the CPU, additional hardware resources available to execute data analysis kernels idle while waiting on pre-processed data.
System dependent bottlenecks on Cori include the performance of the mpi4py library given the used MPI implementation, as well as filesystem I/O issues that arise in large-scale python application Stephey [2021]. In order to implement a master-worker architecture, Delta relies on spawning new MPI processes at runtime. The performance of these operations may differ between implementations of the MPI standard. Second, it is observed that the performance of python MPI applications degrade on Cori, caused by simultaneous file system requests Stephey [2021]. This effect can be mitigated by launching the requested resource configuration using a container image as the root partition. We investigated these effects by benchmarking the turbulence benchmark workflow with Delta running as a containerized application. For this we used NERSCs shifter service. While Delta inside the container image uses MPIch, the uncontainerized version uses OpenMPI. Scanning over all possible combinations of the parmaters listed in Tab. 1, Delta running as a containerized application using shifter only shows minor differences to the walltimes reported in Fig. 9. This implies that neither implementation details of MPI runtime process spawning nor blocking file system requests pose a significant bottleneck for Delta running on Cori.
4.3 Performance in a streaming setting
Finally, we benchmark the performance of the Delta processor in a streaming setting. Here, data is streamed from the KSTAR DTN to the NERSC DTN. There it is forwarded to the processor, which executes the turbulence benchmark workflow using resource allocations A and B as before. In our experiments we observe transfer speeds of about MByte/sec from KSTAR to NERSC, which is comparable to the maximal speeds recorded in the network link benchmark Fig. 6. Thus the ADIOS2 library uses the available network bandwidth optimally in this setting. At this rate it take about seconds to transfer the approximately GByte of data from KSTAR to NERSC.
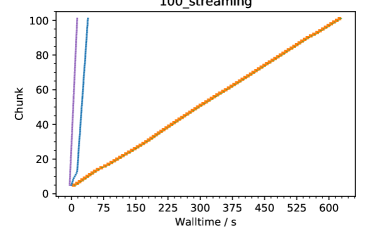
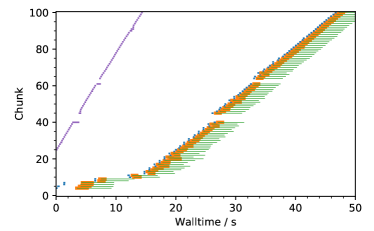
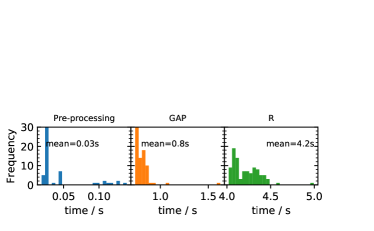
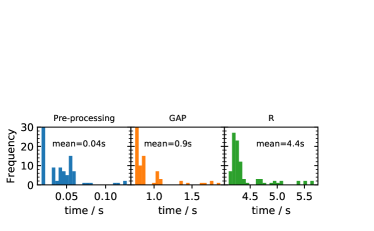
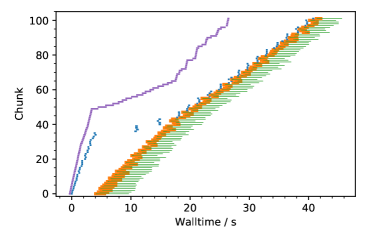
Figure 10 shows the execution timeline of the different pre-processing and data analysis kernels as well as histograms of measured wall-times when running Delta in the streaming setting. Using resource allocation A, the processor finishes the workload in about seconds, similar to the time measured in a non-streaming setting. While the total walltime to perform the benchmark workflow using resource allocation B is about 50 seconds, also the same as measured in a non-streaming setting, the time when the individual compute tasks are performed varies. First, the pre-processing of a given chunk is now performed immediately before any data analysis kernel is executed. In a non-streaming setting we observed this behaviour only after the first 40 chunks had been processed. We also observe a small delay where no data seems to be analyzed occurring after the first 10 chunks are processed. After that, pre-processing and data analysis kernels are executed at a uniform rate until the end of the data stream. Running Delta in a streaming setting does not affect the walltime required to perform individual compute tasks. As shown in the histograms 10c and 10d, the average time to execute pre-processing and data analysis kernels, as well as the observed distribution is similar to those observed in the non-streaming setting.
Overall, we observe that Delta executes the turbulence benchmark workflow with the same performance, regardless whether the data is read from disk or streamed from a fusion experiment. Pre-processing of the individual data chunks bounds the total execution time, this task is bound by on-node compute capability. The benchmark workflow is embarrassingly parallel and Delta scales strongly when increasing the number of available GPUs from 1 to 16. Adding more GPUs to the allocation exposes the pre-processing limit. Run-time of the individual compute units, pre-processing and data analysis kernels, is found to be independent of the available compute resources. As an archetypical data analysis task, the results from this benchmark may translate to other data analysis tasks performed with Delta .
5 Visualization
A primary motivation for developing Delta is to provide fusion scientists with data analysis results immediately after a discharge. Delta implements web-based visualizations, which allows to access them from across the globe. To implement this service, Delta makes use of multiple services provided at NERSC. First, the processor stores data analysis results in a locally running MongoDB 101010https://www.mongodb.com instance which is directly accessible from the compute nodes. And second, the web-server that serves the visualization dashboards runs on a container orchestration service. Running within this service, the web-server has direct access to MongoDB. In addition, container orchestration services such as Rancher allow to seamlessly meet workload demands. New instances of the web server can be instantiated if too many web clients connect at once for example. In this setup, the dashboards can visualize data as it is being analyzed by the generator. Access restriction mechanisms that can be implemented for this setup include common control mechanisms, such as user authentication handled by the web server, transport layer security such as the use of hypertext transfer protocol secure (HTTPS), or restrictions based on IP addresses.
Figure 1 illustrates how the components of Delta are used to implement the visualization service. A web server runs on NERSCs Rancher service and forwards data requests from web clients to the MongoDB instance. User clients can request individual data, or pull, data. This method is implemented using a REST API in the web server Fielding [2000]. For this, the web server translates HTTP requests into MongoDB queries, performs a query, and returns data to the clients. Alternatively, the client may wish to receive updated data continuously. To facilitate this the web-server can instantiate a so-called ChangeStream 111111https://docs.mongodb.com/manual/changeStreams/, which provides a subscription to changes in selected data. That is, the database will automatically forward certain data to the web server using the ChangeStream. The web server then forwards this data to the user client using websockets Fette and Melnikov [2011] so that it receives that data as it is updated. This way, analyzed data can be forwarded from the processor to a user client as soon as it has been written to the database.
A video that demonstrates the web based visualization is presented in the online supplemental material to this article. The demonstration shows ECEi data that has been bandpass filtered, with a pass band extending from to kHz, such that a rotating magnetic island becomes visible. The magnetic island segmentation model introduces in sec. 3 is incorporated in the dashboard and can be used on-the-fly to mark the different regions of the radial phase inversion structure. This demonstrates how information from trained machine learning models can be incorporated into data visualization workflows. Future applications of Delta may include a hot-spot detection, where a machine-learning model would overlay detected hot-spots on camera data streams. Machine operators could use such information to optimize plasma positioning for the next discharge.
6 Conclusions and future work
We have introduced the Delta framework that aims to facilitate near real-time streaming analysis and visualization of big and fast fusion data. We demonstrated that this framework allows to stream large imaging data sets from remote fusion experiments to HPC centers, perform computationally demanding data analysis tasks, and visualize data analysis results immediately after a plasma shot is done and in time before the next one.
Delta is a distributed system, designed using an object oriented architecture and implemented in python. Data analysis is performed using linear workflow, which is readily extensible with custom pre-processing and data analysis kernels and leverages distributed HPC resources using a master-worker architecture. By writing data analysis results into a networked database, the analyzed data can be ingested by visualization dashboard as it is written. Operating Delta alongside experiments allows to execute computationally demanding turbulence analysis in between shows. By incorporating machine learning models into the visualization sub-system it also allows to present augmented data visualizations on web-based dashboards immediately after data from a shot has been analyzed. Focusing on ECEi data from KSTAR, we show that even a simple U-Net architecture robustly identifies radial phase inversion structures in the images, which are footprints of magnetic islands.
We have presented extensive benchmarks of the example turbulence workflow. Executing the workflow takes the same amount of time when the data is streamed from KSTAR to NERSC and when it is loaded from local storage at NERSC. The master-worker architecture balances compute tasks across the available compute resources of the compute allocation and we find a strong scaling of the walltime with the amount of compute resources for up to 16 GPUs. For larger resource allocations we find that on-node compute power limits this range of the scaling.
Future work aims to expand the use-cases for streaming data analytics in fusion sciences. In particular we aim to include other data sources such as bolometers and Mirnov coils, both of which would motive other data analysis cases. Bolometry data could for example be used to automate bolometry inversion and possible integrate this data with on-line training for surrogate machine learning models Carvalho et al. [2019], Ferreira et al. [2020]. Another possible route to expand this work is to focus on running sophisticated integrated modelling tasks in between shots. This approach may require to utilize more fine-grained resource distribution libraries, such as Ray Liaw et al. [2018].
Acknowledgement(s)
This research used resources of the National Energy Research Scientific Computing Center (NERSC), a U.S. Department of Energy Office of Science User Facility located at Lawrence Berkeley National Laboratory, operated under Contract No. DE-AC02-05CH11231. Delta is available on github 121212https://github.com/rkube/delta.
References
- Choi et al. [2016] Jong Youl Choi, Tahsin Kurc, Jeremy Logan, Matthew Wolf, Eric Suchyta, James Kress, David Pugmire, Norbert Podhorszki, Eun-Kyu Byun, Mark Ainsworth, Manish Parashar, and Scott Klasky. Stream processing for near real-time scientific data analysis. In 2016 New York Scientific Data Summit (NYSDS), pages 1–8, 2016. doi: 10.1109/NYSDS.2016.7747804.
- Ralph Kube et al. [2020] Ralph Kube, R Michael Churchill, Jong Youl Choi, Ruonan Wang, Scott Klasky, CS Chang, Minjun J. Choi, and Jinseop Park. Leading magnetic fusion energy science into the big-and-fast data lane. In Meghann Agarwal, Chris Calloway, Dillon Niederhut, and David Shupe, editors, Proceedings of the 19th Python in Science Conference, pages 140 – 147, 2020. doi: 10.25080/Majora-342d178e-013.
- Kube et al. [2020] Ralph Kube, R Michael Churchill, Jong Choi, Ruonan Wang, Minjun Choi, Scott Klasky, and CS Chang. Near real-time analysis of big fusion data on hpc systems. In 2020 IEEE/ACM HPC for Urgent Decision Making (UrgentHPC), pages 55–63, Nov 2020. doi: 10.1109/UrgentHPC51945.2020.00012.
- Churchill et al. [2021] R. M. Churchill, C. S. Chang, J. Choi, R. Wang, S. Klasky, R. Kube, H. Park, M. J. Choi, J. S. Park, M. Wolf, R. Hager, S. Ku, S. Kampel, T. Carroll, K. Silber, E. Dart, and B. S. Cho. A framework for international collaboration on iter using large-scale data transfer to enable near-real-time analysis. Fusion Science and Technology, 77(2):98–108, 2021. doi: 10.1080/15361055.2020.1851073. URL https://doi.org/10.1080/15361055.2020.1851073.
- Sitjes et al. [2018] A. Puig Sitjes, M. Jakubowski, A. Ali, P. Drewelow, V. Moncada, F. Pisano, T. T. Ngo, B. Cannas, J. M. Travere, G. Kocsis, T. Szepesi, T. Szabolics, and W7-X Team. Wendelstein 7-x near real-time image diagnostic system for plasma-facing components protection. Fusion Science and Technology, 74(1-2):116–124, 2018. doi: 10.1080/15361055.2017.1396860. URL https://doi.org/10.1080/15361055.2017.1396860.
- Jakubowski et al. [2018] Marcin Jakubowski, Peter Drewelow, Joris Fellinger, Aleix Puig Sitjes, Glen Wurden, Adnan Ali, Christoph Biedermann, Barbara Cannas, Didier Chauvin, Marc Gamradt, Henry Greve, Yu Gao, Dag Hathiramani, Ralf König, Axel Lorenz, Victor Moncada, Holger Niemann, Tran Thanh Ngo, Fabio Pisano, and Thomas Sunn Pedersen. Infrared imaging systems for wall protection in the w7-x stellarator (invited). Review of Scientific Instruments, 89(10):10E116, 2018. doi: 10.1063/1.5038634. URL https://doi.org/10.1063/1.5038634.
- Pisano et al. [2020] Fabio Pisano, Barbara Cannas, Alessandra Fanni, Giuliana Sias, Marcin W. Jakubowski, Peter Drewelow, Holger Niemann, Aleix Puig Sitjes, Yu Gao, Victor Moncada, Glen Wurden, and W7-X Team. Tools for image analysis and first wall protection at w7-x. Fusion Science and Technology, 76(8):933–941, 2020. doi: 10.1080/15361055.2020.1819750. URL https://doi.org/10.1080/15361055.2020.1819750.
- Mitteau et al. [2021] R. Mitteau, C. Belafdil, C. Balorin, X. Courtois, V. Moncada, R. Nouailletas, and B. Santraine. West operation with real time feed back control based on wall component temperature toward machine protection in a steady state tungsten environment. Fusion Engineering and Design, 165:112223, 2021. ISSN 0920-3796. doi: https://doi.org/10.1016/j.fusengdes.2020.112223. URL https://www.sciencedirect.com/science/article/pii/S0920379620307717.
- Poli [2018] Francesca Maria Poli. Integrated tokamak modeling: When physics informs engineering and research planning. Physics of Plasmas, 25(5):055602, 2018. doi: 10.1063/1.5021489. URL https://doi.org/10.1063/1.5021489.
- Meneghini et al. [2015] O. Meneghini, S.P. Smith, L.L. Lao, O. Izacard, Q. Ren, J.M. Park, J. Candy, Z. Wang, C.J. Luna, V.A. Izzo, B.A. Grierson, P.B. Snyder, C. Holland, J. Penna, G. Lu, P. Raum, A. McCubbin, D.M. Orlov, E.A. Belli, N.M. Ferraro, R. Prater, T.H. Osborne, A.D. Turnbull, and G.M. Staebler. Integrated modeling applications for tokamak experiments with omfit. Nuclear Fusion, 55(8):083008, 2015. URL http://iopscience.iop.org/article/10.1088/0029-5515/55/8/083008/meta.
- Kostuk et al. [2018] M. Kostuk, T. D. Uram, T. Evans, D. M. Orlov, M. E. Papka, and D. Schissel. Automatic between-pulse analysis of diii-d experimental data performed remotely on a supercomputer at argonne leadership computing facility. Fusion Science and Technology, 74(1-2):135–143, 2018. doi: 10.1080/15361055.2017.1390388. URL https://doi.org/10.1080/15361055.2017.1390388.
- Godoy et al. [2020] William F. Godoy, Norbert Podhorszki, Ruonan Wang, Chuck Atkins, Greg Eisenhauer, Junmin Gu, Philip Davis, Jong Choi, Kai Germaschewski, Kevin Huck, Axel Huebl, Mark Kim, James Kress, Tahsin Kurc, Qing Liu, Jeremy Logan, Kshitij Mehta, George Ostrouchov, Manish Parashar, Franz Poeschel, David Pugmire, Eric Suchyta, Keichi Takahashi, Nick Thompson, Seiji Tsutsumi, Lipeng Wan, Matthew Wolf, Kesheng Wu, and Scott Klasky. Adios 2: The adaptable input output system. a framework for high-performance data management. SoftwareX, 12:100561, 2020. ISSN 2352-7110. doi: https://doi.org/10.1016/j.softx.2020.100561. URL http://www.sciencedirect.com/science/article/pii/S2352711019302560.
- Dalcin and Fang [2021] L. Dalcin and Y. L. Fang. mpi4py: Status update after 12 years of development. Computing in Science and Engineering, 23(04):47–54, jul 2021. ISSN 1558-366X. doi: 10.1109/MCSE.2021.3083216.
- Xie et al. [2017] Bing Xie, Yezhou Huang, Jeffrey S. Chase, Jong Youl Choi, Scott Klasky, Jay Lofstead, and Sarp Oral. Predicting output performance of a petascale supercomputer. In Proceedings of the 26th International Symposium on High-Performance Parallel and Distributed Computing, HPDC ’17, pages 181–192, New York, NY, USA, 2017. Association for Computing Machinery. ISBN 9781450346993. doi: 10.1145/3078597.3078614. URL https://doi.org/10.1145/3078597.3078614.
- Yun et al. [2014] G. S. Yun, W. Lee, M. J. Choi, J. Lee, M. Kim, J. Leem, Y. Nam, G. H. Choe, H. K. Park, H. Park, D. S. Woo, K. W. Kim, C. W. Domier, N. C. Luhmann, N. Ito, A. Mase, and S. G. Lee. Quasi 3d ece imaging system for study of mhd instabilities in kstar. Review of Scientific Instruments, 85(11):11D820, 2014. doi: 10.1063/1.4890401. URL https://doi.org/10.1063/1.4890401.
- Park et al. [2019] H.K. Park, M.J. Choi, S.H. Hong, Y. In, Y.M. Jeon, J.S. Ko, W.H. Ko, J.G. Kwak, J.M. Kwon, J. Lee, J.H. Lee, W. Lee, Y.B. Nam, Y.K. Oh, B.H. Park, J.K. Park, Y.S. Park, S.J. Wang, M. Yoo, S.W. Yoon, J.G. Bak, C.S. Chang, W.H. Choe, Y. Chu, J. Chung, N. Eidietis, H.S. Han, S.H. Hahn, H.G. Jhang, J.W. Juhn, J.H. Kim, K. Kim, A. Loarte, H.H. Lee, K.C. Lee, D. Mueller, Y.S. Na, Y.U. Nam, G.Y. Park, K.R. Park, R.A. Pitts, S.A. Sabbagh, and G.S. Yun and. Overview of KSTAR research progress and future plans toward ITER and k-DEMO. Nuclear Fusion, 59(11):112020, jul 2019. doi: 10.1088/1741-4326/ab20e2. URL https://doi.org/10.1088/1741-4326/ab20e2.
- Choi et al. [2017] M. J. Choi, J. Kim, J. M. Kwon, H. K. Park, Y. In, W. Lee, K. D. Lee, G. S. Yun, J. Lee, M. Kim, W. H. Ko, J. H. Lee, Y. S. Park, Y. S. Na, N. C. Luhmann, and B. H. Park. Multiscale interaction between a large scale magnetic island and small scale turbulence. Nuclear Fusion, 57(12):126058, 2017. doi: 10.1088/1741-4326/aa86fe. URL http://dx.doi.org/10.1088/1741-4326/aa86fe.
- Choi et al. [2019] Minjun J. Choi, Hogun Jhang, Jae-Min Kwon, Jinil Chung, Minho Woo, Lei Qi, Sehoon Ko, Taik-Soo Hahm, Hyeon K. Park, Hyun-Seok Kim, Jisung Kang, Jaehyun Lee, Minwoo Kim, and Gunsu S. Yun and. Experimental observation of the non-diffusive avalanche-like electron heat transport events and their dynamical interaction with the shear flow structure. Nuclear Fusion, 59(8):086027, jun 2019. doi: 10.1088/1741-4326/ab247d. URL https://doi.org/10.1088/1741-4326/ab247d.
- Choi et al. [2014] Minjun J Choi, Gunsu S Yun, Woochang Lee, Hyeon K Park, Young-Seok Park, Steve A Sabbagh, Kieran J Gibson, Christopher Bowman, Calvin W Domier, Neville C Luhmann, Jun-Gyo Bak, and Sang G Lee and. Improved accuracy in the estimation of the tearing mode stability parameters using 2d ECEI data in KSTAR. Nuclear Fusion, 54(8):083010, jun 2014. doi: 10.1088/0029-5515/54/8/083010. URL https://doi.org/10.1088/0029-5515/54/8/083010.
- Waelbroeck [2009] F.L. Waelbroeck. Theory and observations of magnetic islands. Nuclear Fusion, 49(10):104025, sep 2009. doi: 10.1088/0029-5515/49/10/104025. URL https://doi.org/10.1088/0029-5515/49/10/104025.
- Ronneberger et al. [2015] Olaf Ronneberger, Philipp Fischer, and Thomas Brox. U-net: Convolutional networks for biomedical image segmentation. In Nassir Navab, Joachim Hornegger, William M. Wells, and Alejandro F. Frangi, editors, Medical Image Computing and Computer-Assisted Intervention – MICCAI 2015, pages 234–241, Cham, 2015. Springer International Publishing. ISBN 978-3-319-24574-4.
- Paszke et al. [2019] Adam Paszke, Sam Gross, Francisco Massa, Adam Lerer, James Bradbury, Gregory Chanan, Trevor Killeen, Zeming Lin, Natalia Gimelshein, Luca Antiga, Alban Desmaison, Andreas Kopf, Edward Yang, Zachary DeVito, Martin Raison, Alykhan Tejani, Sasank Chilamkurthy, Benoit Steiner, Lu Fang, Junjie Bai, and Soumith Chintala. Pytorch: An imperative style, high-performance deep learning library. In H. Wallach, H. Larochelle, A. Beygelzimer, F. d'Alché-Buc, E. Fox, and R. Garnett, editors, Advances in Neural Information Processing Systems 32, pages 8024–8035. Curran Associates, Inc., 2019. URL http://papers.neurips.cc/paper/9015-pytorch-an-imperative-style-high-performance-deep-learning-library.pdf.
- Kube [2021] Ralph Kube. Ecei ml utils, August 2021. URL https://doi.org/10.5281/zenodo.5206251.
- Kingma and Ba [2017] Diederik P. Kingma and Jimmy Ba. Adam: A method for stochastic optimization, 2017.
- Good [1952] I. J. Good. Rational decisions. Journal of the Royal Statistical Society. Series B (Methodological), 14(1):107–114, 1952. ISSN 00359246. URL http://www.jstor.org/stable/2984087.
- Ingesson et al. [1998] L.C Ingesson, B Alper, H Chen, A.W Edwards, G.C Fehmers, J.C Fuchs, R Giannella, R.D Gill, L Lauro-Taroni, and M Romanelli. Soft x ray tomography during ELMs and impurity injection in JET. Nuclear Fusion, 38(11):1675–1694, nov 1998. doi: 10.1088/0029-5515/38/11/307. URL https://doi.org/10.1088/0029-5515/38/11/307.
- Montisci et al. [2021] Augusto Montisci, Sara Carcangiu, Giuliana Sias, Barbara Cannas, and Alessandra Fanni. A real time bolometer tomographic reconstruction algorithm in nuclear fusion reactors. Mathematics, 9(11), 2021. ISSN 2227-7390. doi: 10.3390/math9111186. URL https://www.mdpi.com/2227-7390/9/11/1186.
- Lam et al. [2015] Siu Kwan Lam, Antoine Pitrou, and Stanley Seibert. Numba: A llvm-based python jit compiler. In Proceedings of the Second Workshop on the LLVM Compiler Infrastructure in HPC, LLVM ’15, pages 1–6, New York, NY, USA, 2015. Association for Computing Machinery. ISBN 9781450340052. doi: 10.1145/2833157.2833162. URL https://doi.org/10.1145/2833157.2833162.
- Stephey [2021] L Stephey. Nersc shifter vs. filesystems toy python problem benchmark, August 2021. URL https://doi.org/10.5281/zenodo.5182528.
- Fielding [2000] Roy Fielding. Architectural Styles and the Design of Network-based Software Architectures. PhD thesis, University of California, Irvine, https://www.ics.uci.edu/ fielding/pubs/dissertation/top.htm, 2000.
- Fette and Melnikov [2011] I. Fette and A. Melnikov. The websocket protocol. RFC 6455, RFC Editor, December 2011. URL http://www.rfc-editor.org/rfc/rfc6455.txt. http://www.rfc-editor.org/rfc/rfc6455.txt.
- Carvalho et al. [2019] D.D. Carvalho, D.R. Ferreira, P.J. Carvalho, M. Imrisek, J. Mlynar, H. Fernandes, and JET Contributors. Deep neural networks for plasma tomography with applications to JET and COMPASS. Journal of Instrumentation, 14(09):C09011–C09011, sep 2019. doi: 10.1088/1748-0221/14/09/c09011. URL https://doi.org/10.1088/1748-0221/14/09/c09011.
- Ferreira et al. [2020] Diogo R. Ferreira, Pedro J. Carvalho, and Horacio Fernandes. Deep learning for plasma tomography and disruption prediction from bolometer data. IEEE Transactions on Plasma Science, 48(1):36–45, Jan 2020. ISSN 1939-9375. doi: 10.1109/tps.2019.2947304. URL http://dx.doi.org/10.1109/TPS.2019.2947304.
- Liaw et al. [2018] Richard Liaw, Eric Liang, Robert Nishihara, Philipp Moritz, Joseph E Gonzalez, and Ion Stoica. Tune: A research platform for distributed model selection and training. arXiv preprint arXiv:1807.05118, 2018.