Measurement of the Angular Distribution of Wavelength-Shifted Light Emitted by TPB
2Lawrence Berkeley National Laboratory
July 2020)
Abstract
We present measurements of the angular distribution of re-emitted light from tetraphenyl butadiene thin films when exposed to light, which is the peak of the liquid Argon (LAr) scintillation spectrum, in vacuum. Films ranging from to in thickness are measured. All films were fabricated by evaporation deposition on ultraviolet transmitting (UVT) acrylic substrates. Preliminary comparisons of the angular distribution to that produced by a detailed Monte Carlo model are also presented. The current shortcomings of the model are discussed and future plans briefly outlined.
1 Introduction
Noble liquid (NL) radiation detectors are a widely used tool in modern particle physics experiment. These detectors enable a variety of research programs ranging from neutrino physics [1, 2] and dark matter searches [3, 4, 5, 6, 7, 8, 9, 10, 11, 12, 13, 14, 15, 16, 17, 18, 19, 20] to other rare-event measurements [21, 22, 23, 24, 25, 26, 27, 28, 29, 30, 31]. In recent years, significant effort has been committed to exploring how large-scale NL detectors can answer pressing questions in these fields. Numerous such detectors have been proposed, and several are already operational or projected to be in the near future [1, 13, 20, 31, 26, 32]. Unsegmented monolithic NL detectors enjoy better self shielding than water or organic scintillators and have typical photon yields of , leading to excellent energy resolution and low energy thresholds. Because of the particular process by which NLs scintillate, involving excited dimer molecules, they are also highly transparent to their own scintillation light and therefore make very scalable detectors. Yet another feature are the long recombination times observed of free electrons produced when charged particles collide with and ionize atoms in an NL. These electrons can drift large distances through a liquid volume when an electric field is applied, allowing NL detectors to be used as so-called time projection chambers [1].
In concert with the research efforts mentioned above, there are pushes to better understand materials that comprise the inner volumes of NL detectors. As designs are refined, accurate modeling of the optics of these materials becomes an important limiting factor in searching for new physics. In particular, those materials which strongly affect light collection must be well-understood.
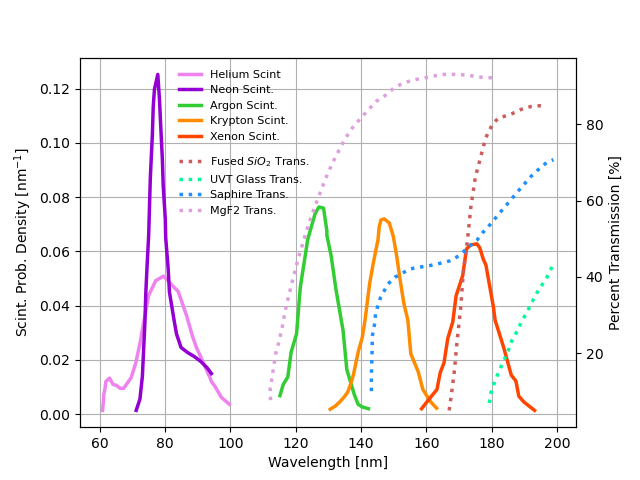
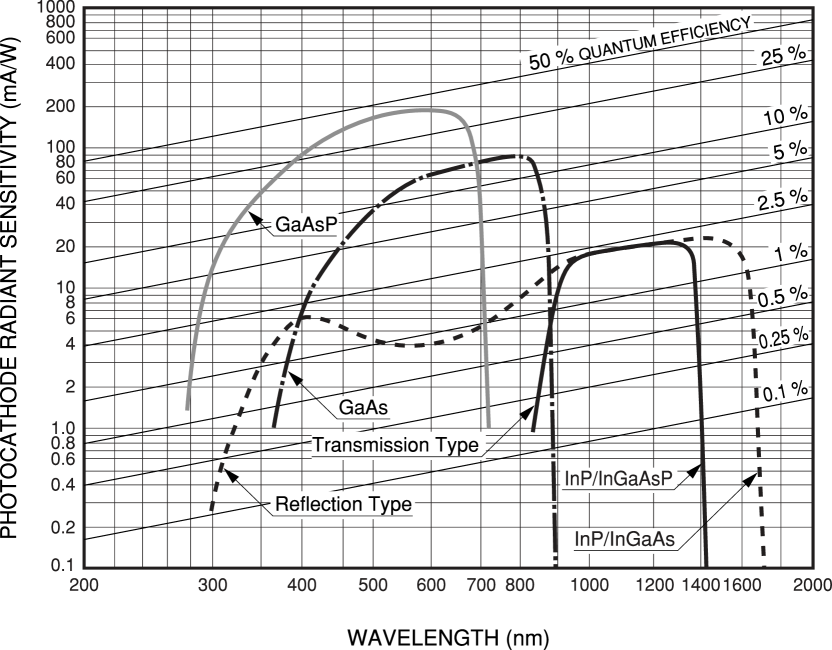
Despite their wide use, NL detectors are burdened by the fact their scintillation light is deep in the ultraviolet (UV) wavelength regime ( for Xenon and down to approximately for Helium or Neon). Figure 1 shows the scintillation emission spectra of several NLs as well as the transmittances of some materials commonly used in optical windows [35]. Light below is heavily absorbed by most optical windows and cannot be detected by typical photo-multiplier tubes (PMTs). Figure 2 shows the wavelength dependent sensitivities of some common photo-cathode materials [34]. A critical element of some NL detectors is the use of wavelength-shifting materials to absorb and re-emit scintillation light at more readily detectable wavelengths.
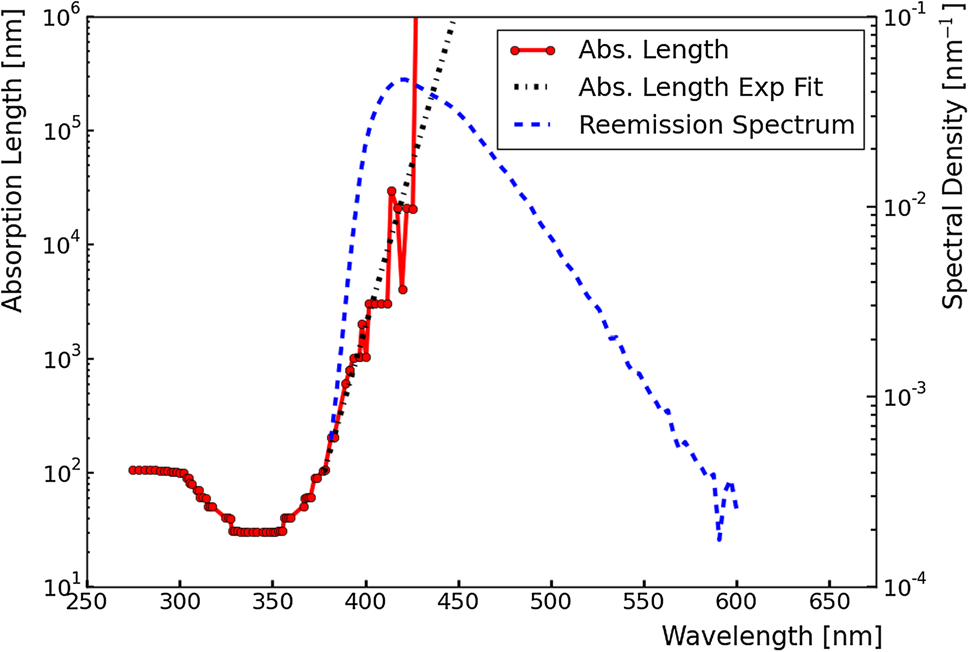
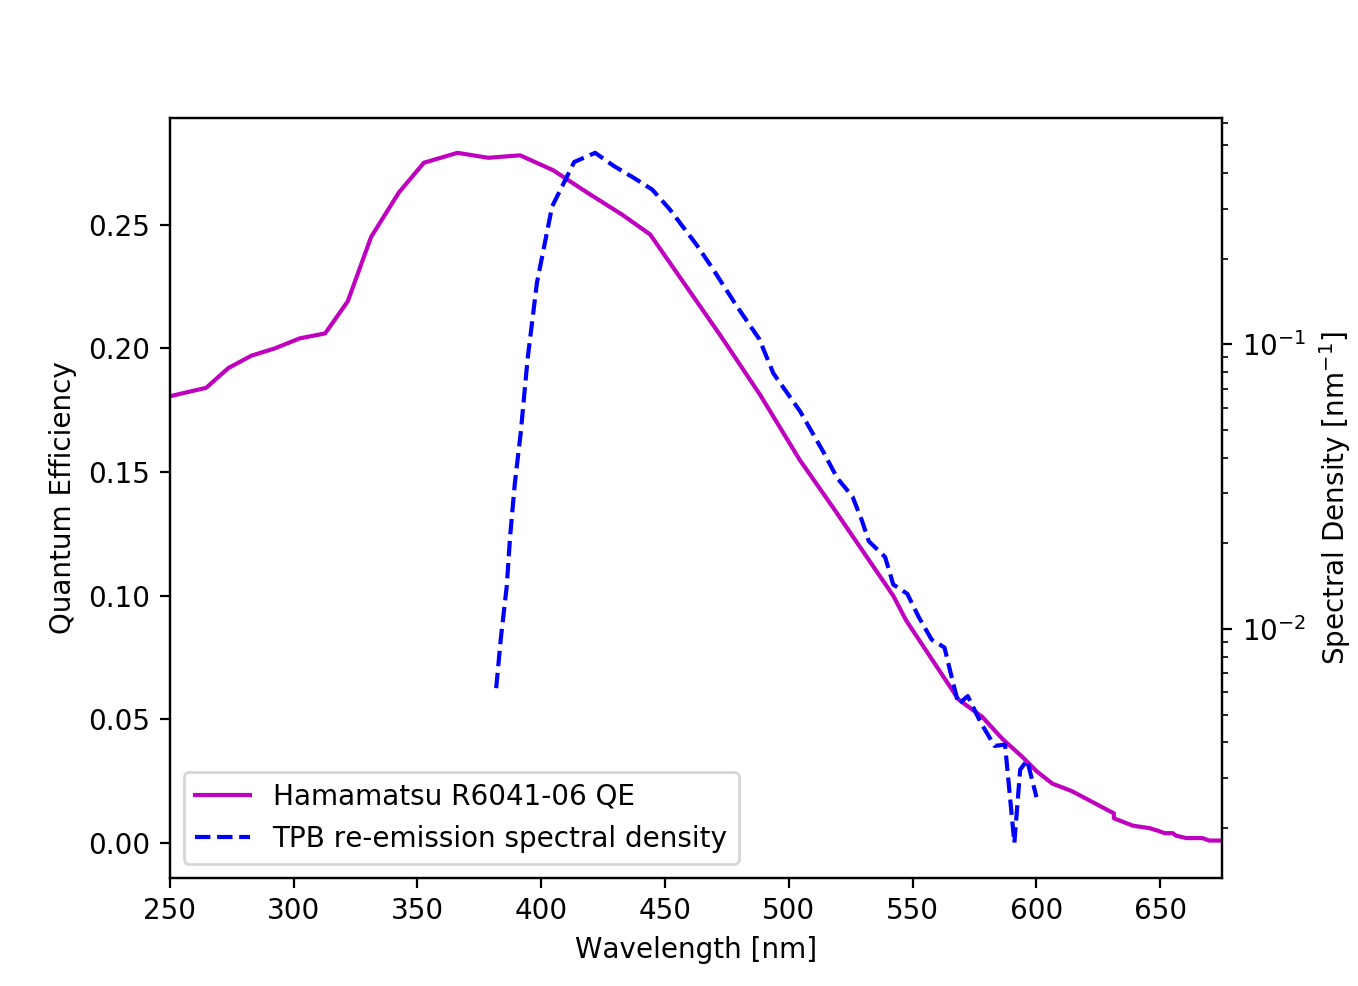
A popular wavelength shifter is tetraphenyl butadiene (TPB), which can be deployed in numerous ways in the inner volume of an NL detector. Incoming scintillation photons are absorbed by TPB and then re-emitted at detectable wavelengths before they are incident on a PMT. Figure 3 shows both the re-emission spectrum and wavelength dependent absorption length of TPB [35].
Previous studies have produced measurements of various optical properties of TPB including the absorption and emission spectra, timing of re-emitted light, and intrinsic quantum efficiency of a single TPB molecule [36, 37, 35, 33, 38, 39, 40, 41, 42, 43, 44, 45, 46, 47, 48]. However, the angular distribution of re-emitted light has not been fully explored. This paper presents the first measurement of the full angular distribution of re-emitted light from evaporation-deposited TPB films on acrylic when exposed to light, which is the peak of the liquid argon (LAr) scintillation spectrum. Past measurements of the relative intensity of transmitted and reflected light through a TPB film on a silicon substrate have been made [44], and these measurements are consistent with the data taken in this study. In this paper, measurements of the angular distribution of re-emitted light are made for multiple TPB film thicknesses ranging from to .
Both the integral of the angular distribution of re-emitted light and the ratio of transmitted and reflected light from a TPB film as functions of film thickness are of interest for those hoping to maximize the light collection efficiencies of their detectors. In a detector configuration with TPB applied to the outer surface of a PMT window, the ideal behavior of the TPB is to maximize the (shifted) transmitted light. In addition to being a useful measurement in its own right, the angular distribution of re-emitted light can in theory be used to extract important micro-physical optical properties of TPB via comparison to a detailed Monte Carlo (MC) model. Therefore these measurements can inform how TPB is modeled in future optical simulations. The methodology of such a MC study is outlined in Section 6.
Section 2 provides an overview of the hardware and basic operation of the experimental apparatus. Section 3 details the fabrication of TPB film samples. Section 4 discusses the measurements used to account for backgrounds and degradation of the optical components from UV exposure. Section 5 presents the data and results from this study. Section 6 presents preliminary comparisons of the data to the angular distributions produced by a micro-physical MC model. Sections 7 and 8 are conclusions and acknowledgments respectively.
2 Experimental Apparatus
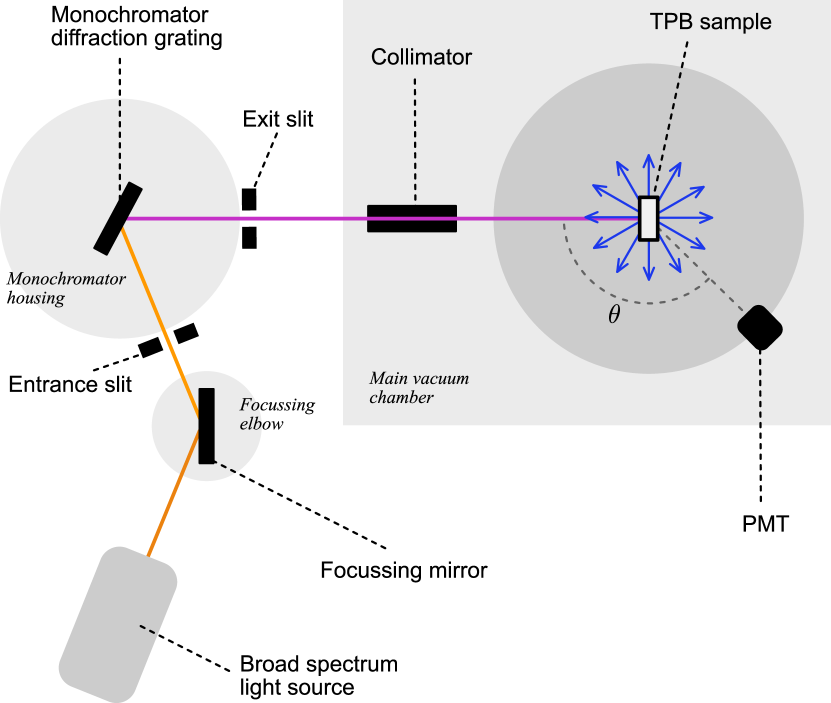
This section describes the optical elements used to produce the monochromatic light incident on the TPB samples. The apparatus used in this study builds upon two former experiments conducted at Lawrence Berkeley National Laboratory; namely a previous study of the micro-physical optical properties of TPB [35] and a more recent project known as the Immersed BRIDF (bi-directional reflectance intensity distribution function) Experiment in Xenon (IBEX), which investigated the optical reflectivity of PTFE in both vacuum and liquid xenon [32]. The apparatus used in this study is the same as that used in the latter, and the basic arrangement of the optical chain remains unchanged. Figure 4 shows a schematic of the apparatus. The optical chain begins with a McPherson Model 632 light source [49], which produces light in the wavelength range. This broad spectrum light is focused with a McPherson Model 615 focusing elbow through a vertical slit and onto a McPherson Model 234/302 Vacuum Ultraviolet Monochromator, which can be adjusted to reflect monochromatic light of a desired wavelength into the main vacuum chamber. The wavelength distribution of the resulting beam is less than full width at half maximum. In the main vacuum chamber, the monochromatic light is collimated before hitting the TPB sample housed in an aluminum sample holder. Pictures of the apparatus are provided in Kravitz (2020) [32]. The entire optical chain is housed in vacuum.
In the TPB film, the UV light may be absorbed and re-emitted. The re-emitted light is wavelength shifted and distributed according to the spectrum shown in Figure 3. This re-emitted light can then be collected by a Hamamatsu R6041-06 PMT whose viewing angle relative to the beam path can be varied from , with corresponding to the PMT facing straight into the beam if the TPB sample were removed from the optical chain. The aperture of the PMT is in diameter and subtends a solid angle of from the center of the TPB film. The quantum efficiency of the PMT is shown in Figure 5. The adjustable PMT viewing angle allows for the measurement of the angular distribution of re-emitted photons.
The TPB sample can also be rotated about the axis coming out of the page in Figure 4. While TPB films were exclusively positioned normal to the incident beam in this study, the ability to rotate the sample holder is crucial for calibration of the sample holder dial and validation of the MC geometry. The sample holder can simultaneously hold four different samples aligned vertically. It can be moved up and down to choose which sample to illuminate or to lift the entire holder out of the optical chain (all while under vacuum).
Initial amplification of the raw PMT signal is done with a Phillips Scientific Model 777 low noise amplifier. A LeCroy Model 623B discriminator defines the triggering threshold and outputs square wave trigger pulses. The trigger pulses are amplified once more and sent to a rate meter that integrates and outputs an analog voltage logarithmically proportional to the rate of the discriminator output. The signal from the rate meter output is finally digitized and piped to a LabView module. Small corrections are made to the signal in LabView to account for non-linearities between the PMT rate and signal response up to , which is roughly the maximum observed rate in this apparatus. The threshold of the discriminator was set to a constant value which attempts to minimize the number of triggers on false events and maximize counting of real photon pulses.
Of all the elements in the optical chain, only the PMT rotation axis and sample holder rotation axis are fixed in place. The beam therefore had to be aligned so as to be incident on the center of the sample holder. A discussion of the alignment procedures used in this study is found in Kravitz (2020) [32].
3 Sample Fabrication
TPB is an opaque organic material that forms small crystal domains in the solid state. High purity TPB can readily be purchased in powder form. In this study, films were fabricated on 1-inch diameter acrylic substrates by heated evaporation deposition of pure TPB powder. The thickness of the films can be controlled by varying the amount of evaporated TPB as well as the distance between the substrate and heated TPB source. In this study, a Tectra Mini Coater was used at a source-substrate distance of .
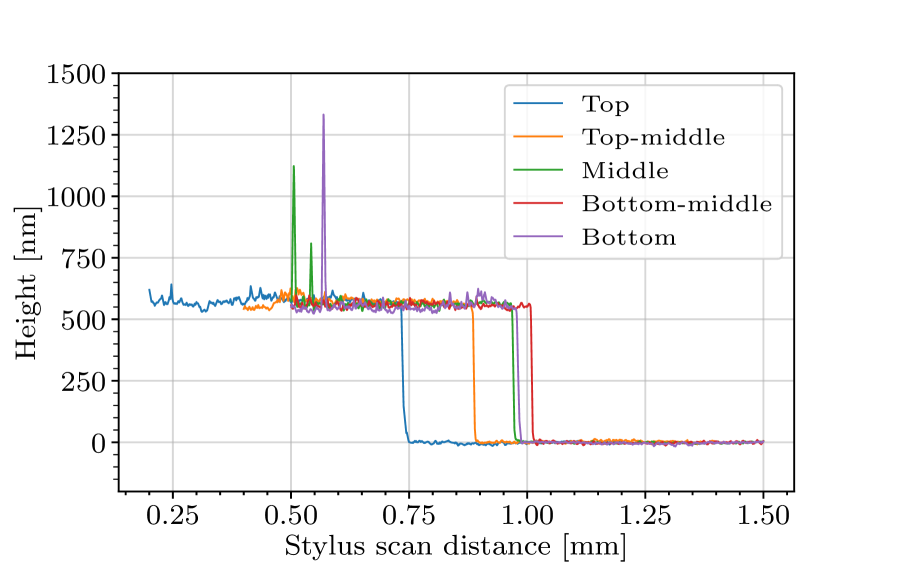
To verify the scale, uniformity, and reproducibility of sample film thicknesses, samples were scanned with a KLA-Tencor D-600 profilometer (also known as Alpha-Step) at the Marvell Nanofabrication Laboratory at UC Berkeley. The profilometer uses a stylus that is physically placed on the TPB surface and dragged across it to measure its topography. Although the surface of an acrylic substrate can vary by as much as from flat, it was found that evaporation deposition nonetheless produces films of uniform thickness. This was confirmed by fabricating a test sample with a thin strip of Kapton tape covering the middle of the substrate. The TPB was deposited and the Kapton tape removed to reveal a TPB-acrylic boundary that ran through the middle of the sample. A profilometer step-height scan was made at five locations uniformly spaced along this boundary, as shown in Figure 6, to confirm that the film thickness near the center of the sample was consistent with that near the circumference. This particular test showed a thickness of or, equivalently, a variation of .
The TPB films used for production data were coated on identical 1-inch diameter, circular UVT acrylic substrates in a 0.9-inch diameter area concentric with the substrate. No Kapton tape was used for the fabrication of the production data samples. The slightly smaller radius of the film leaves the peripheral edge of the substrate exposed so profilometer scans can be made at the TPB-acrylic boundary. These profilometer scans were performed twice for each sample at two diametrically opposite locations at the circumference of the film. The results of these two measurements were averaged to designate a single thickness for each sample. A list of TPB samples used in this study is presented in Table 1 along with their measured thicknesses.
| Sample | Thickness () | Uncertainty () |
|---|---|---|
| SN114 | ||
| SN105 | ||
| SN104 | ||
| SN107 | ||
| SN108 | ||
| SN111 | ||
| SN112 | ||
| SN113 |
The stylus force used during the profilometer scans can be adjusted. It was confirmed that using a force of or less is weak enough to prevent damage of the TPB film. This was done by comparing the angular distribution of re-emitted light from a TPB sample before and after scans using different forces. The re-emission performance of the film was unaffected to within uncertainties by the scan. All film thickness scans for samples presented in this study were performed within this permissible force range.
4 Measurements
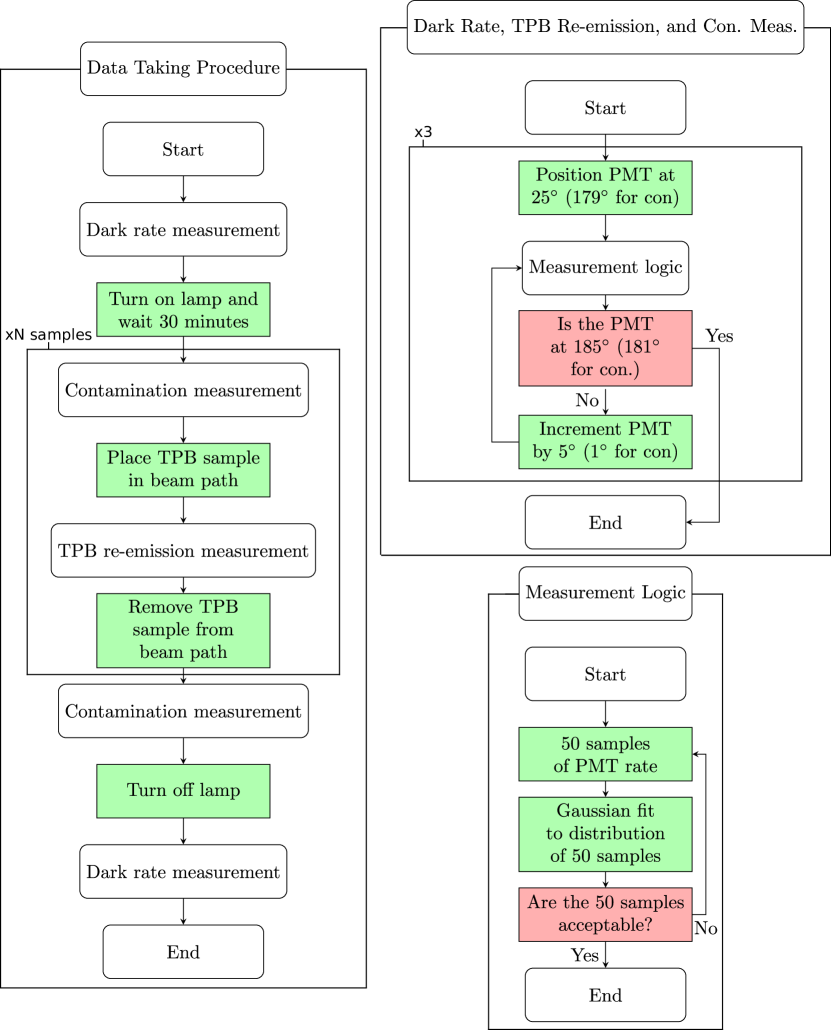
A complete measurement of the angular distribution of re-emitted light from a TPB film involves three distinct types of measurement to account for backgrounds and systematic effects. A list of the different measurements is given below. A description of the full measurement procedure follows and a flowchart summarizing this procedure is given in Figure 7.
-
•
TPB Re-emission Measurement
This is the signal measurement. The PMT rate is measured every five degrees in viewing angle from with the beam on and the TPB sample placed in front of the beam at normal incidence. Typical rates at a viewing angle near are .
-
•
Dark Rate Measurement
This is a PMT dark-rate and stray-light background measurement. The PMT rate is measured every five degrees in viewing angle from with the lamp off and the TPB sample lifted out of the main vacuum chamber. Typical rates at any given viewing angle are .
-
•
Contamination Measurement
This measures the small amount of visible “contamination” light in the UV beam and is used to monitor UV induced degradation of optical components (Sections 4.3 and 4.4). The PMT rate is measured at , , and with the beam on and the TPB sample lifted out of the main vacuum chamber. Typical rates at the viewing angle are .
4.1 Data taking procedure
Once the apparatus is under vacuum, the following steps are taken to realize a complete measurement of the angular distribution of re-emitted light from a TPB film.
First, a dark rate measurement is made at the start of any run to record the level of this background. After the dark rate measurement, the lamp is turned on and left to heat up for 30 minutes so its output is stable. With the lamp stabilized, a contamination measurement is made. After the contamination measurement, the desired TPB sample can be placed in front of the beam at normal incidence. With the TPB in front of the beam, a TPB re-emission measurement is taken. Immediately after the angular distribution measurement, the sample is removed from the beam path and another contamination measurement is made, identical to the first. The average of the integrals of the two contamination measurements is used to normalize TPB angular distributions taken at different times. Normalizing to contamination corrects for the degradation of the lamp window due to UV exposure (Section 4.3). Additional TPB re-emission measurements are performed, interleaved with contamination measurements, for a frequent monitor of potential UV degradation. After data-taking is concluded, a second dark rate measurement is performed and checked for consistency with the first.
The following sections describe the background and systematic considerations in more detail.
4.2 PMT stability
The PMT exhibits instability on two time scales. The first and simpler of the two is a slow, exponential decrease of the PMT dark rate from the moment it is first turned on. This is dealt with by letting the PMT stabilize for several hours before taking data.
The second instability has a characteristic time on the order of tens of seconds. It can be accounted for in the following way. For a single PMT rate measurement, 50 PMT rate readings are sampled within and fit with a Gaussian in LabView. Ideally these 50 measurements look Poissonian. Occasionally, the distribution is bi-modal, indicating that PMT instability has interfered with the measurement. The criterion employed for the distribution having a well-defined central value is that the mean of a fitted Gaussian must be within the interquartile rank of the distribution. If this is not the case, the 50 readings are re-sampled. As an additional cross check, for each scan across angles, the full scan is repeated three times and the results for a given angle averaged, with an additional uncertainty included to account for the spread between measurements. This procedure is followed for signal, dark rate, and contamination measurements.
4.3 Degradation of the deuterium lamp
There are two time dependent degradation effects that affect rate measurements. First is the degradation of the magnesium fluoride window of the deuterium lamp due to polymerization of vacuum contaminants while the lamp is in operation. The second is a gradual degradation of the TPB performance. Even after significant use, the degradation of the deuterium lamp can be reversed by following a window cleaning procedure available from its manufacturer, McPherson. However, the rate of degradation during use was found to be much greater just after a cleaning than after many hours of use. It was crucial to ensure the lamp intensity remained stable over the course of a single angular distribution measurement. Because the lamp output intensity was adequate for measurements even after some degradation, it was decided to let the lamp degrade to a point of relative stability where the change in lamp output over the course of one angular distribution measurement was much smaller than the Poisson statistics of the measurement. To confirm the lamp output had advanced to a point of adequate stability, three consecutive angular distribution measurements were compared and found to agree within Poisson uncertainties.
Although this strategy ensures lamp degradation is negligible over the course of one measurement of the angular distribution for one sample, after a number of such measurements the effect can become important. A strategy was therefore needed to normalize the overall integral of angular distributions taken for different samples at different times to account for long term lamp degradation.
A useful measurement for handling this is the photon rate seen by the PMT when looking directly into the unobstructed beam, referred to in this study as a contamination measurement. Although the PMT is not sensitive to the dominant light from the beam, it is sensitive to a small amount of longer wavelength “contamination” light which leaks in through the monochromator slit.
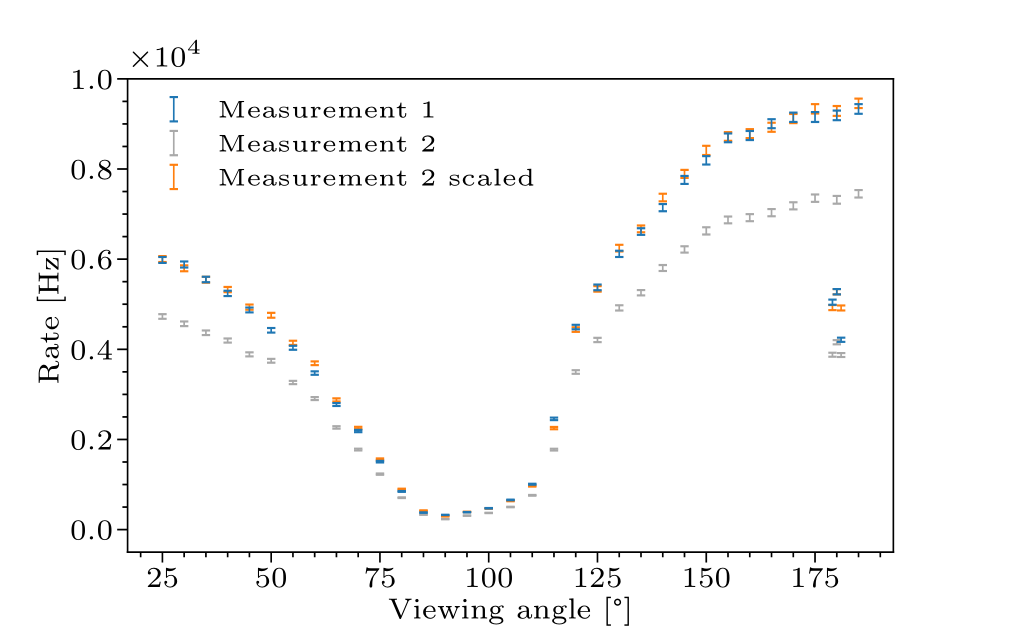
It was observed that the intensity of this contamination light co-varied with the intensity of the dominant light as a function of lamp degradation. This was concluded by taking angular TPB re-emission distribution measurements with the same sample before and after significant lamp degradation and normalizing to the intensities of the contamination light taken at the two times. When normalized to the contamination light intensity, the angular distributions agree very well as shown in Figure 8. Thus contamination measurements of the unobstructed beam were made before and after every TPB sample measurement, as described above. As stated in Section 4.1, the average of the before- and after-contamination measurements was used to normalize angular distributions taken at different times, and the fractional difference between the two was incorporated as an additional uncertainty on the corresponding angular distribution data.
4.4 Degradation of TPB samples
Although several tests prove the contamination light is a good measure of lamp degradation even after many hours of “lamp time”, this alone does not solve the problem of normalizing data taken on different samples at different times. If a sample is exposed to a significant amount of VUV light, its wavelength shifting efficiency will degrade and data taken before and after this degradation will no longer agree when normalized by contamination.
Tests show the degradation of TPB has a negligible effect on the angular distribution of re-emitted light when the TPB has only been exposed to vacuum ultraviolet (VUV) light during a few data taking periods. This was verified by taking data multiple times with a previously unused sample and confirming the angular distributions were identical over the course of these few measurements. To avoid effects caused by TPB degradation, only samples that had minimal previous use were deployed for production data. Moreover, the production TPB samples were stored in a dedicated vacuum chamber to avoid prolonged exposure to ambient light and moisture. The samples used for production data had never been used with the exception of three samples (SN104, SN112, SN113) listed in Table 1 that were used once before.
4.5 Indirect scattering of light
With the lamp in operation, there can also be backgrounds from indirect scattering of longer wavelength light off of reflective surfaces inside the vacuum chamber. Both shifted light from the TPB and contamination light in the beam can contribute to this background. This effect was estimated by shining the beam onto an 0.635- thick aluminum disk in the sample holder in the same configuration as when taking TPB data. The magnitude of the effect was confirmed to be of that seen with the PMT measuring TPB re-emission.
Because of the concern that reflective surfaces in the stainless steel vacuum chamber may affect measurements, black Acktar “Metal Velvet” foil was used to cover the inner walls of the chamber[50]. The foil sheets are highly non-reflective in the wavelengths of interest ( specular reflectance and hemispherical reflectance). No change in the TPB re-emission measurement was observed before and after the foil installation to within uncertainties.
5 Results
Table 1 summarizes the TPB film thicknesses used in this study. This range was chosen to span the thickness at which previous works measured the greatest wavelength shifting efficiency.
Figure 9 shows the angular distributions measured from these samples when normalized to contamination as discussed above. For PMT angles in the range , the line of sight from the TPB/acrylic sample to the PMT is obstructed by the back edge of the sample holder. This effect has been studied in MC and its impact on the measured distribution is well understood in terms of the thickness of the sample holder and angular alignment of the sample holder normal to the beam.
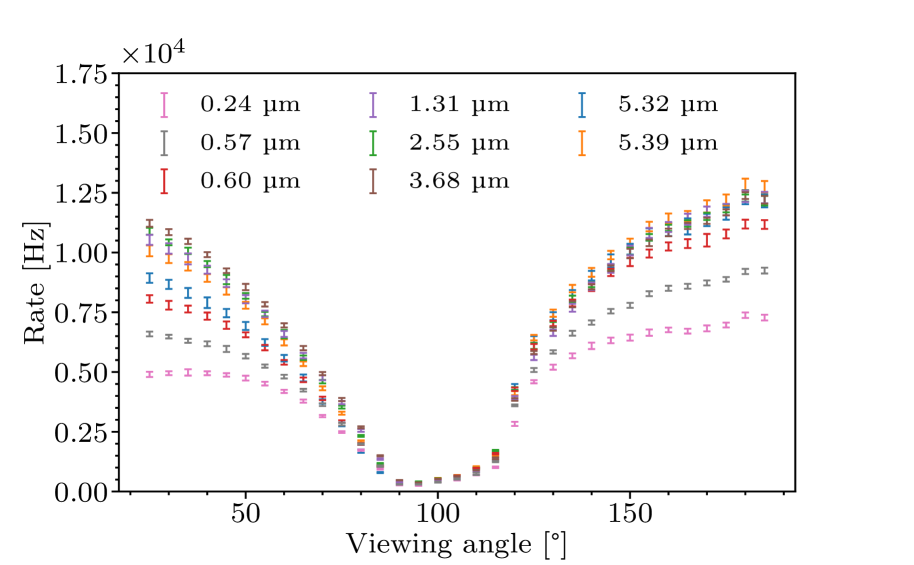

An interesting pattern in these angular distributions is that more light is detected behind the TPB sample relative to the beam than on the same side as the beam (described as transmitted and reflected light respectively). A similar asymmetry has been observed before when measuring re-emitted light from TPB films on silicon substrates [44]. This asymmetry is much larger than can be accounted for by scattering of contamination light in the beam, which give photon rates of exclusively in the narrow PMT viewing angles subtended by the beam. Figure 10 shows the same data but with each angular distribution normalized to unity in order to explicitly show the variation in shape. In theory, one expects this asymmetry to be less severe for thicker samples, in which the re-emitted light is more likely to undergo a second absorption if it proceeds towards the “back” of the TPB sample, but this trend is not obviously apparent in the data.
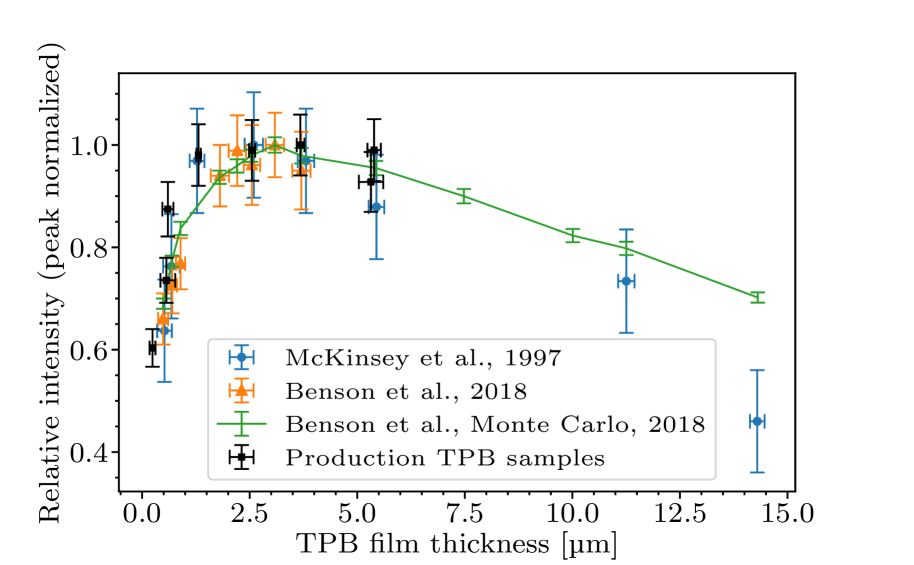
Figure 11 shows the relative integrals of these distributions as functions of sample thickness normalized to the peak. Using instead of the peak changes the relative normalization of the data by about . The thickness corresponding to the peak wavelength shifting efficiency is consistent with results of past measurements. Previous studies only looked at the re-emitted light on one side of the TPB sample, so the observed agreement is not necessarily trivial.
6 Monte Carlo Studies
Previous studies suggest the remission of light from the bulk of a TPB film happens isotropically [35, 44]. However, the angular distribution of re-emitted photons from a TPB film is theoretically affected by the film thickness as mentioned above. Thicker films result in an angular distribution more heavily populated at small angles, because fewer absorbed and re-emitted photons are able to travel through the entire film without being absorbed a second time.
This sample-specific effect can in theory be leveraged to extract micro-physical properties of TPB by comparing angular distributions for multiple TPB film thicknesses to detailed MC simulations.
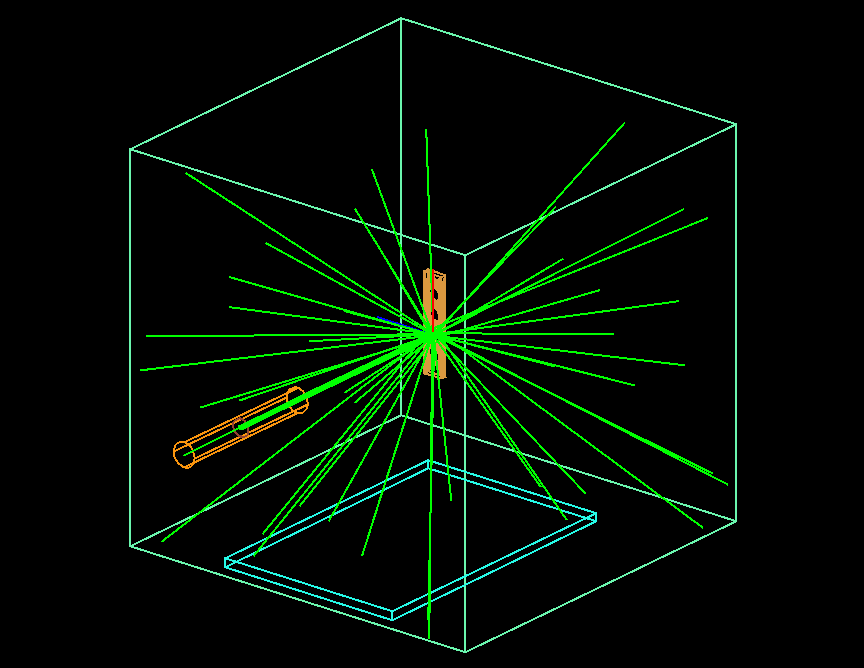
In this study, a micro-physical MC model of the experiment was made in an attempt to explore such an analysis. The simulation was built using the RAT Mini-CLEAN toolkit, which is a C++ wrapper for the popular GEANT4 particle transport simulation software. Figure 12 shows a rendering of the model geometry. The optical model of the TPB used is based on the model developed by Benson et al. [35] in connection with data they took in the same study.
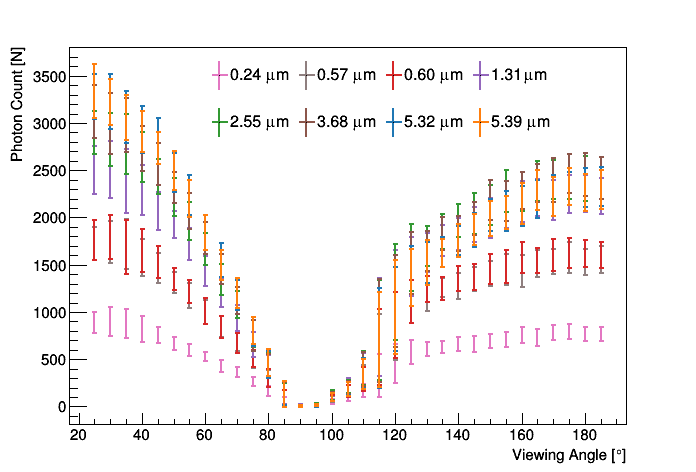
The model geometry was validated by measuring the reflections of a beam off a mirror in the sample holder with the sample holder rotated to multiple beam-mirror incident angles, and comparing to simulated result. Figure 13 shows the MC prediction for the shape of the angular distribution of light emitted by the TPB for the same range of film thicknesses as presented in Figure 9. Figure 14 shows a comparison of data to MC for the film thickness.
The error bars in Figures 13, LABEL: and 14 include both statistical and systematic uncertainties having to do with the geometry of the apparatus. Systematic uncertainties were evaluated by measuring the effects of geometric parameters on the angular distributions in MC. The change in the angular distribution corresponding to a variation of a given geometrical parameter was added in quadrature to the total error on the MC angular distributions. In the apparatus, the intersection of the beam with a plane normal to the beam and containing the axis of the PMT rotation stage defined the origin. Among the geometric systematics accounted for, the most relevant were the displacement of the sample holder rotation axis relative to the origin, the displacement of sample holder from its own rotation axis, the angular displacement of the sample holder from normal to the beam, and lateral displacement of the axis of the PMT rotation stage relative to the origin.
With the MC geometry validated, it became clear the current optical model fails to reproduce some notable features of the measured angular distributions. Namely, MC does not reproduce the aforementioned asymmetry between reflected and transmitted light in data. Furthermore, it was discovered that no plausible combination of adjustments to parameters in the optical model could reproduce the asymmetry.
Four parameters affecting the asymmetry between reflected and transmitted light in MC were thoroughly studied: the UV absorption length, the visible absorption length, the UV scattering length, and the visible scattering length. Here absorption lengths refer to the typical distance a photon travels through the TPB bulk before undergoing an inelastic interaction with a TPB molecule (e.g. shifting), and scattering lengths refer to the typical distance a photon travels through the TPB before undergoing an elastic interaction with a TPB molecule (i.e. no shifting). Naively one might suppose certain combinations of these parameters could produce a large asymmetry between reflected and transmitted light. For instance, one might think that a long UV absorption length, meaning the photons travel further into the TPB before being absorbed, combined with a short visible scattering length, meaning the re-emitted photons are likely to scatter in the TPB film before escaping, results in an attenuation of reflected light. This however is not the case; at large UV absorption lengths, it becomes equally likely for a UV photon to be absorbed at any depth into the TPB film and so no additional scattering of the re-emitted light can preference one direction over the other. This was confirmed in MC. It was observed that no combination of the mentioned parameters could produce an asymmetry of the magnitude seen in data, even when values several sigma away from the expected values were used.
One possible cause of the mis-modelling could be poor handling of reflections and scattering at the surface of the TPB, which scanning electron microscope (SEM) images show has a complicated topography. Another could be invalid use of the Rayleigh limit when modelling scattering in the TPB, meaning it may be incorrect to treat the scatterers as point particles.
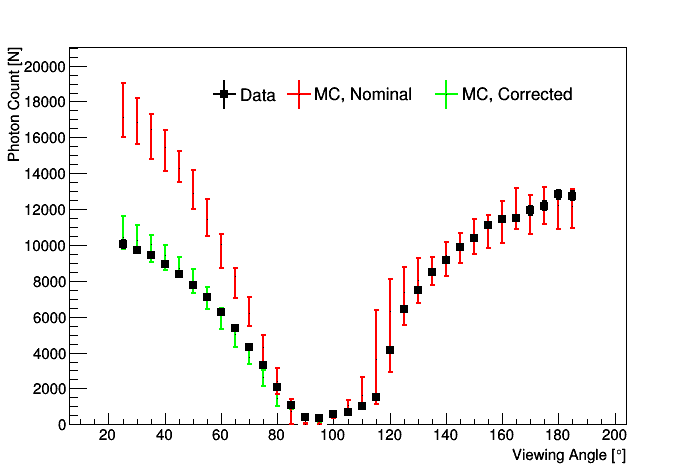
Though it is unknown what optical processes lead to the asymmetry seen in data, it is possible to induce decent agreement between MC and data by superficially scaling the left side of the MC angular distribution as seen in Figure 14. This scaling is not the same when applying the correction to MC for different TPB thicknesses, nor does it appear to obey some simple function of TPB thickness.
One way to reproduce the attenuation of reflected light in MC is to construct a thin layer at the front of the TPB film which strongly scatters visible light. Although the choices of the thickness of the layer and the scattering length are arbitrary, it is found that a model like this can induce agreement between MC and data similar that in Figure 14.
7 Conclusions
We have presented measurements of the angular distribution of re-emitted light from TPB films ranging in thickness from to when exposed to light in vacuum. Specifically, we measure photon rates at 32 PMT viewing angles from to as described in Section 2. This was done on 8 different samples as summarized in Table 1.
For all samples, we observed an asymmetry between the amount of re-emitted light that escaped the film in the backward (reflected) and the forward (transmitted) directions. We observed higher photon emission rates on the backside of the TPB film than on the front side. This is evident in Figures 9 and 10. The asymmetry is not yet understood and presents the greatest challenge to performing a MC analysis with this data. The asymmetry could not be reproduced in MC by adjusting any of the bulk or surface optical properties available in the model. As described in Section 6, decent agreement between the shape of data and MC is observed for either the reflected or transmitted light individually, but the ratio of the integrals of the reflected and transmitted light do not match between the two. Good agreement between data and MC can be induced by applying a scaling to either the transmitted or reflected side of the angular distribution as seen in Figure 14. As compared to what is modeled in MC, it is unknown whether the asymmetry in data comes from additional attenuation of reflected light, reduced attenuation of transmitted light, or some combination of the two.
Some possible explanations for the asymmetry include surface effects which may cause additional scattering of visible light on the exposed surface of the TPB film, but not on the side attached to the acrylic substrate. This would further attenuate the reflected light. Another possibility may be that the effective size of the visible scatterers in TPB are on the order of crystal domains rather than TPB molecules, meaning a Rayleigh treatment of visible scattering is unjustified. Performing an analysis in the Mie scattering limit could increase the amount of transmitted light seen in MC.
The observed asymmetry in the angular distribution of re-emitted light may have implications for detector design. Broadly speaking the asymmetry can be taken advantage of in detector design by orienting films so more light is seen where desirable and less where undesirable. Future modeling of the asymmetry may lead to better micro-physical optical models of TPB for use in MC simulations of detectors that deploy TPB.
8 Acknowledgements
Construction and calibrations were supported by the Laboratory Directed Research and Development Program of Lawrence Berkeley National Lab under U.S. Department of Energy Contract No. DEAC02-05CH11231. Monte Carlo model development was supported by the U.S. Department of Energy, Office of Science, Office of High Energy Physics, under Award Number DE-SC0018974.
References
- [1] B. Abi “Prospects for Beyond the Standard Model Physics Searches at the Deep Underground Neutrino Experiment”, 2020 arXiv:2008.12769 [hep-ex]
- [2] R. Acciarri “Design and Construction of the MicroBooNE Detector” In JINST 12.02, 2017, pp. P02017 DOI: 10.1088/1748-0221/12/02/P02017
- [3] A. Bernstein et al. “LBECA: A Low Background Electron Counting Apparatus for Sub-GeV Dark Matter Detection” In Journal of Physics: Conference Series 1468 IOP Publishing, 2020, pp. 012035 DOI: 10.1088/1742-6596/1468/1/012035
- [4] Lucie Tvrznikova “Sub-GeV Dark Matter Searches and Electric Field Studies for the LUX and LZ Experiments”, 2019 arXiv:1904.08979 [astro-ph.IM]
- [5] Ioannis Katsioulas “NEWS-G, Light dark matter search with a Spherical Proportional Counter, First results and Future prospects” In 53rd Rencontres de Moriond on Electroweak Interactions and Unified Theories, 2018, pp. 221–226 arXiv:1809.02485 [hep-ex]
- [6] Laura Baudis “WIMP Dark Matter Direct-Detection Searches in Noble Gases” In Phys. Dark Univ. 4, 2014, pp. 50–59 DOI: 10.1016/j.dark.2014.07.001
- [7] K. Rielage “Update on the MiniCLEAN Dark Matter Experiment” In Phys. Procedia 61, 2015, pp. 144–152 DOI: 10.1016/j.phpro.2014.12.024
- [8] Marc Schumann “Dark Matter Search with liquid Noble Gases”, 2012 arXiv:1206.2169 [astro-ph.IM]
- [9] Aaron Manalaysay “Recent results in the search for dark matter with noble liquid detectors” In 46th Rencontres de Moriond on Electroweak Interactions and Unified Theories, 2011, pp. 417–424 arXiv:1106.0037 [hep-ex]
- [10] P. Agnes “Results From the First Use of Low Radioactivity Argon in a Dark Matter Search” [Addendum: Phys.Rev.D 95, 069901 (2017)] In Phys. Rev. D 93.8, 2016, pp. 081101 DOI: 10.1103/PhysRevD.93.081101
- [11] K. Abe “XMASS detector” In Nucl. Instrum. Meth. A 716, 2013, pp. 78–85 DOI: 10.1016/j.nima.2013.03.059
- [12] Laura Baudis “DARWIN: dark matter WIMP search with noble liquids” In J. Phys. Conf. Ser. 375, 2012, pp. 012028 DOI: 10.1088/1742-6596/375/1/012028
- [13] D.S. Akerib “The LUX-ZEPLIN (LZ) Experiment” In Nucl. Instrum. Meth. A 953, 2020, pp. 163047 DOI: 10.1016/j.nima.2019.163047
- [14] D.S. Akerib “Results from a search for dark matter in the complete LUX exposure” In Phys. Rev. Lett. 118.2, 2017, pp. 021303 DOI: 10.1103/PhysRevLett.118.021303
- [15] E. Aprile “Light Dark Matter Search with Ionization Signals in XENON1T” In Phys. Rev. Lett. 123.25, 2019, pp. 251801 DOI: 10.1103/PhysRevLett.123.251801
- [16] J. Calvo “Commissioning of the ArDM experiment at the Canfranc underground laboratory: first steps towards a tonne-scale liquid argon time projection chamber for Dark Matter searches” In JCAP 03, 2017, pp. 003 DOI: 10.1088/1475-7516/2017/03/003
- [17] R. Brunetti “Warp liquid argon detector for dark matter survey” In New Astron. Rev. 49, 2005, pp. 265–269 DOI: 10.1016/j.newar.2005.01.017
- [18] M.G. Boulay “DEAP-3600 Dark Matter Search at SNOLAB” In J. Phys. Conf. Ser. 375, 2012, pp. 012027 DOI: 10.1088/1742-6596/375/1/012027
- [19] D.Yu. Akimov “The ZEPLIN-III dark matter detector: instrument design, manufacture and commissioning” In Astropart. Phys. 27, 2007, pp. 46–60 DOI: 10.1016/j.astropartphys.2006.09.005
- [20] E. Aprile et al. “The XENON100 dark matter experiment” In Astroparticle Physics 35.9 Elsevier BV, 2012, pp. 573–590 DOI: 10.1016/j.astropartphys.2012.01.003
- [21] Christian Wittweg, Brian Lenardo, Alexander Fieguth and Christian Weinheimer “Detection prospects for the second-order weak decays of 124Xe in multi-tonne xenon time projection chambers”, 2020 arXiv:2002.04239 [nucl-ex]
- [22] G. Anton “Search for Neutrinoless Double- Decay with the Complete EXO-200 Dataset” In Phys. Rev. Lett. 123.16, 2019, pp. 161802 DOI: 10.1103/PhysRevLett.123.161802
- [23] F. Agostini “Sensitivity of the DARWIN observatory to the neutrinoless double beta decay of 136Xe” In Eur. Phys. J. C 80.9, 2020, pp. 808 DOI: 10.1140/epjc/s10052-020-8196-z
- [24] Nirmal Raj “Neutrinos from Type Ia and failed core-collapse supernovae at dark matter detectors” In Phys. Rev. Lett. 124.14, 2020, pp. 141802 DOI: 10.1103/PhysRevLett.124.141802
- [25] A. Bondar et al. “Measurement of the ionization yield of nuclear recoils in liquid argon using a two-phase detector with electroluminescence gap” In JINST 12.05, 2017, pp. C05010 DOI: 10.1088/1748-0221/12/05/C05010
- [26] D. Baxter “First Demonstration of a Scintillating Xenon Bubble Chamber for Detecting Dark Matter and Coherent Elastic Neutrino-Nucleus Scattering” In Phys. Rev. Lett. 118.23, 2017, pp. 231301 DOI: 10.1103/PhysRevLett.118.231301
- [27] V. Chepel and H. Araujo “Liquid noble gas detectors for low energy particle physics” In JINST 8, 2013, pp. R04001 DOI: 10.1088/1748-0221/8/04/R04001
- [28] J.B. Albert “Search for Neutrinoless Double-Beta Decay with the Upgraded EXO-200 Detector” In Phys. Rev. Lett. 120.7, 2018, pp. 072701 DOI: 10.1103/PhysRevLett.120.072701
- [29] Soroush Shakeri, Fazlollah Hajkarim and She-Sheng Xue “Shedding New Light on Sterile Neutrinos from XENON1T Experiment”, 2020 arXiv:2008.05029 [hep-ph]
- [30] S. Amerio “Design, construction and tests of the ICARUS T600 detector” In Nucl. Instrum. Meth. A 527, 2004, pp. 329–410 DOI: 10.1016/j.nima.2004.02.044
- [31] Jordan Myslik “Search for neutrinoless double-beta decays in Ge-76 in the LEGEND experiment” In PoS ICHEP2018, 2019, pp. 636 DOI: 10.22323/1.340.0636
- [32] S. Kravitz et al. “Measurements of Angle-Resolved Reflectivity of PTFE in Liquid Xenon with IBEX” In Eur. Phys. J. C 80.3, 2020, pp. 262 DOI: 10.1140/epjc/s10052-020-7800-6
- [33] V.M. Gehman et al. “Fluorescence Efficiency and Visible Re-emission Spectrum of Tetraphenyl Butadiene Films at Extreme Ultraviolet Wavelengths” In Nucl. Instrum. Meth. A 654, 2011, pp. 116–121 DOI: 10.1016/j.nima.2011.06.088
- [34] Hamamatsu Photonics K.K. URL: www.hamamatsu.com
- [35] Christopher Benson, Gabriel Orebi Gann and Victor Gehman “Measurements of the intrinsic quantum efficiency and absorption length of tetraphenyl butadiene thin films in the vacuum ultraviolet regime” In Eur. Phys. J. C 78.4, 2018, pp. 329 DOI: 10.1140/s10052-018-5807-z
- [36] V.M. Gehman “WLS R&D for the detection of noble gas scintillation at LBL: seeing the light from neutrinos, to dark matter, to double beta decay” In JINST 8, 2013, pp. C09007 DOI: 10.1088/1748-0221/8/09/C09007
- [37] Hang Yang, Zi-Feng Xu, Jian Tang and Yi Zhang “Spin coating of TPB film on acrylic substrate and measurement of its wavelength shifting efficiency” In Nucl. Sci. Tech. 31.3, 2020, pp. 28 DOI: 10.1007/s41365-020-0737-5
- [38] James AR Samson “Vacuum ultraviolet research” In Applied optics 6.3 Optical Society of America, 1967, pp. 403–408
- [39] W.M. Burton and B.A. Powell “Fluorescence of Tetraphenyl-Butadiene in the Vacuum Ultraviolet” In Appl. Opt. 12.1, 1973, pp. 87–89 DOI: 10.1364/AO.12.000087
- [40] Stacie E Wallace-Williams et al. “Excited state spectra and dynamics of phenyl-substituted butadienes” In The Journal of Physical Chemistry 98.1 ACS Publications, 1994, pp. 60–67
- [41] DN McKinsey et al. “Fluorescence efficiencies of thin scintillating films in the extreme ultraviolet spectral region” In Nuclear Instruments and Methods in Physics Research Section B: Beam Interactions with Materials and Atoms 132.3 Elsevier, 1997, pp. 351–358
- [42] B.J.P. Jones, J.K. VanGemert, J.M. Conrad and A. Pla-Dalmau “Photodegradation Mechanisms of Tetraphenyl Butadiene Coatings for Liquid Argon Detectors” In JINST 8, 2013, pp. P01013 DOI: 10.1088/1748-0221/8/01/P01013
- [43] R. Francini “VUV-Vis optical characterization of Tetraphenyl-butadiene films on glass and specular reflector substrates from room to liquid Argon temperature”, 2013 DOI: 10.1088/1748-0221/8/09/P09006
- [44] D. Stolp et al. “An estimation of photon scattering length in tetraphenyl-butadiene” In JINST 11.03, 2016, pp. C03025 DOI: 10.1088/1748-0221/11/03/C03
- [45] Sean P Regan et al. “Measured conversion efficiencies of P45, paraterphenyl, tetraphenyl butadiene, and sodium salicylate phosphors in the soft-x-ray wavelength range” In Applied optics 33.16 Optical Society of America, 1994, pp. 3595–3599
- [46] Rinda Allison, Jay Burns and AJ Tuzzolino “Absolute fluorescent quantum efficiency of sodium salicylate” In JOSA 54.6 Optical Society of America, 1964, pp. 747–751
- [47] Elmo C Bruner “Absolute quantum efficiency of sodium salicylate for excitation by extreme ultraviolet” In JOSA 59.2 Optical Society of America, 1969, pp. 204–211
- [48] E. Segreto “Evidence of delayed light emission of tetraphenyl-butadiene excited by liquid-argon scintillation light” In Phys. Rev. C 91 American Physical Society, 2015, pp. 035503 DOI: 10.1103/PhysRevC.91.035503
- [49] Model 632 Deuterium lamp McPherson Inc URL: www.mcphersoninc.com/pdf/632.pdf
- [50] Metal Velvet Acktar URL: www.acktar.com/product/metal-velvet-2/