Discovery of transition from marginally stable burning to unstable burning after a superburst in Aql X-1
Abstract
Superbursts are long duration, rare, and extremely energetic thermonuclear explosions of neutron star low-mass X-ray binaries (NS LMXBs), which are proposed to be due to unstable carbon ignition. We report the superburst properties and its consequences from Aql X–1 observed by Neutron Star Interior Composition Explorer (NICER), the Monitor of All-sky X-ray Image, Swift and Insight Hard X-ray Modulation Telescope (Insight-HXMT) on the Modified Julian Day 59130.7. We find two, faint type I X-ray bursts 9.44 days after the superburst with a short recurrence time of 7.6 minutes, which is the most accurate measurement of the quenching time in all NS LMXBs with observed superbursts. We also discovered mHz quasi-periodic oscillations in the frequency range 2.7–11.3 mHz immediately after the superburst, before and after the resumption of the first type I X-ray burst from NICER, Swift and Insight-HXMT observations. For the first time, we observed the transition from superburst, via marginally stable burning to unstable burning in NS LMXBs. We compared the quenching time and the recurrence time of type I X-ray bursts with simulations.
1 Introduction
Neutron star low-mass X-ray binary (NS LMXB) is composed of a NS accreting matter from its Roche-lobe filling low mass companion star. The accreted hydrogen and/or helium can be depleted via stable, unstable, or marginally stable burning processes, which depend on the accretion rate, surface temperature, and abundance (see Strohmayer & Bildsten, 2006; Galloway & Keek, 2021, for reviews). The unstable thermonuclear burning of the hydrogen and helium, also known as type I X-ray burst, usually has the duration of s with a typical energy release of erg, recurs from few hours to days, and ignites at a column depth of (see Lewin et al., 1993; Galloway et al., 2008, 2020). There were a few instances of NS LMXBs that exhibited intermediate duration bursts, which can emit in s (e.g., Falanga et al., 2008). In more rare cases, superbursts have been identified from the total energy erg and the duration of s, which are believed due to burning carbon at an ignition column depth times deeper than typical type I X-ray bursts (Cumming & Bildsten, 2001; Strohmayer & Brown, 2002). The recurrence time of superbursts ranges from days to years (e.g., Serino et al., 2016; in’t Zand, 2017).
Between stable and unstable burning, marginally stable burning on the NS surface manifests as the mHz of quasi-periodic oscillations (QPOs) of the X-ray light curves. Several atoll sources, including 4U 1608–52, 4U 1636–53, and Aql X–1, have been discovered as mHz of QPOs in the frequency range –15 mHz (Revnivtsev et al., 2001; Mancuso et al., 2021), corresponding to the timescales of 1–4 minutes. Heger et al. (2007) explains the mHz of QPOs in multizone numerical models of the NS envelope and proposed that the oscillation frequency depends on the accreted hydrogen fraction and the NS surface gravity, suggesting another way to probe the still unknown NS equation of state.
Superburst provides a unique way to understand the transition of stable, via possible marginally stable, to unstable burning of accreted matter on the NS surface. Keek & Heger (2011) and Keek et al. (2012) simulated the generation of superbursts, and discussed the consequences of NS surface cooling. After a superburst, the NS envelope is sufficiently hot, and all accreted hydrogen and helium are burning stably. Afterwards, the envelope cools down, and the marginally stable burning may occur. As the envelope continues to cool, weak type I X-ray bursts with short recurrence times return. Cumming & Macbeth (2004) estimated the quenching time of one to several weeks after a superburst. However, for NS accreting matter with a solar composition, Keek et al. (2012) proposed that the quenching time is five times shorter compared with those from Cumming & Macbeth (2004), if both and the CNO breakout reactions contribute to the stability of thermonuclear burning. Due to the lack of contiguous observations and the rare occurrence of superbursts, the transition of burning behavior has not been observed, and only upper limits of the quenching time have been constrained (see e.g., Keek et al., 2012).
The transient NS LXMB Aql X–1 is composed of a fast spinning pulsar of 550.27 Hz and a main-sequence K4 spectral-type companion (Callanan et al., 1999; Chevalier et al., 1999; Mata Sánchez et al., 2017; Casella et al., 2008). Aql X–1 exhibited frequent outbursts and type I X-ray bursts (Campana et al., 1998, 2013; Galloway et al., 2008; Li et al., 2017; Keek et al., 2018). Two superbursts from Aql X–1 have been observed by the Monitor of All-sky X-ray Image (MAXI) on the Modified Julian Day (MJD) 56493.3 (2013 July 20) and 59130.7 (2020 October 8), which indicates the recurrence time of yr (Serino et al., 2016; Iwakiri et al., 2020). The second superburst has been partially observed by Neutron Star Interior Composition Explorer (NICER), which is also its first superburst observation.
In this work, we will report the NICER and MAXI results of the second superburst from Aql X–1 during its 2020 outburst. We introduce the observations and data analysis in Sec. 2. The superburst properties, including the light curve, the detection of mHz QPOs and the spectral results, are shown in Sec. 3. We discuss the properties of the superburst, the mHz QPOs, the quenching time, and the recurrence of type I X-ray bursts in Sec. 4.
2 Observations
2.1 MAXI
The Gas Slit Camera (GSC, Mihara et al., 2011) on board MAXI (Matsuoka et al., 2009), mounted on the International Space Station (ISS), is an X-ray all-sky monitor that scans about 85% of the whole sky every 92 minutes (Sugizaki et al., 2011). MAXI/GSC has the capability of detecting intermediate duration bursts and superbursts in the 2–20 keV band (see e.g., Serino et al., 2016). We downloaded all the MAXI/GSC observations of the second superburst in Aql X–1 between MJD 59130.126–59131.998 from the MAXI webpage,111http://maxi.riken.jp/mxondem/ including the light curves (2–6 keV), spectra (2–20 keV) and response files. The exposure of each spectrum is around 250 s.
2.2 NICER
We analyzed the NICER ObsIDs 3050340143–59, which started before the superburst trigger (MJD 59129.6) and lasted to the end of the outburst (MJD 59157.2) with a total exposure time of 48.6 ks. We carried out standard data processing using HEASOFT version 6.28 and the NICER Data Analysis Software (NICERDAS). The default filtering criteria were applied to obtain the cleaned event data. Moreover, all event data are solar barycenterred by the tool barycorr. We have checked the light curve in the energy range 10–12 keV for flaring background, but we did not find it. By using xselect, we extracted 16 s light curves in the energy ranges 0.5–2.5 keV, 2.5–10 keV, and 0.5–10 keV, to show the hardness ratio (see Fig. 1), 1 s light curves in the energy range 0.5–10 keV to search the type I X-ray burst after the superburst (see Sec. 3.1) and to explore mHz QPOs (see Sec. 3.2). We used the up-to-date ancillary response file (ARF) and response matrix file (RMF) to perform the spectral analysis (see Sec. 3.3 and 3.4).
2.3 Insight-HXMT
The Insight Hard X-ray Modulation Telescope (Insight-HXMT, Zhang et al., 2020), launched on 2017 June 15, have three instruments, the Low Energy X-ray telescope (LE, 1–15 keV, 384 cm2; Chen et al., 2020), the Medium Energy X-ray telescope (ME, 5–30 keV, 952 cm2, Cao et al., 2020), and the High Energy X-ray telescope (HE, 20–250 keV, 5100 cm2, Liu et al., 2020). Insight-HXMT observed Aql X–1 during its 2020 outburst between MJD 59085.278–59143.741. We employ only the LE data to search for type I X-ray bursts and mHz QPOs. We analyze the data using the Insight-HXMT Data Analysis Software package (HXMTDAS) version 2.04. The LE data are calibrated by using the scripts lepical. The good time intervals are selected from the scripts legtigen with the standard criteria; that is, the Earth elevation angle (ELV) greater than 10∘, the cutoff rigidity (COR) higher than 8 GeV, the offset angle from the pointing source (ANG_DIST) smaller than , and the satellite located outside the South Atlantic Anomaly (SAA) region. The 1 s background substracted light curves after the superburst have been obtained with a total exposure time of 18.2 ks.
2.4 Swift
The Neil Gehrels Swift observatory satellite observed Aql X–1 during its 2020 outburst between 2020 August 20 (MJD 59081.68) and October 26 (MJD 59148.66). We only focus the data collected after the peak of the superburst in Aql X–1(i.e., MJD 59130.7) resulting in a total number of 17 observations. The X-Ray Telescope (XRT; Burrows et al., 2005) on board Swift operated mainly in windowed timing (WT) mode. The 1 s and 16 s XRT light curves in the energy range 0.3–10 keV were produced with the Swift XRT data products generator tool at the UK Swift Science Data Centre222https://www.swift.ac.uk/user_objects (see Evans et al., 2007, 2009, for more details). The total exposure time is 8.7 ks.
3 Results
3.1 Light curve
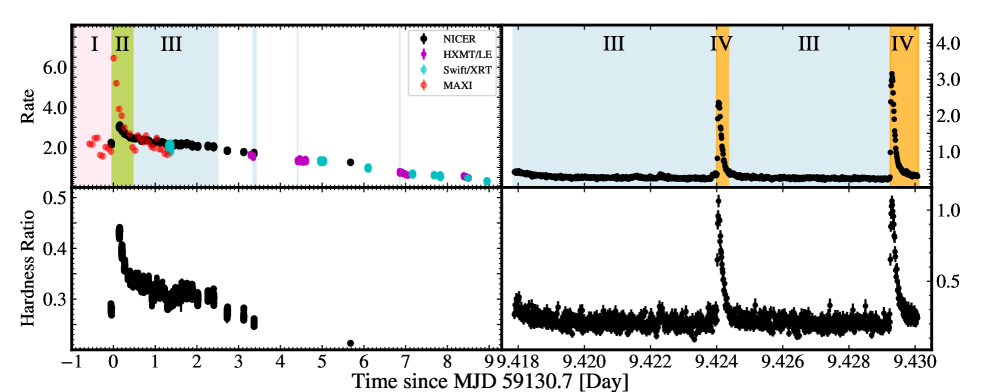
In the top left panel of Fig. 1, we show the light curve of Aql X–1 from MAXI (binned with s), NICER (16 s), Swift/XRT (16 s) and Insight-HXMT (16 s). We note that almost all NICER, Swift/XRT and Insight-HXMTobservations showed multiple data gaps due to South Atlantic Anomaly passages, Earth occultations, and other constraints. Most observations have multiple, nearly contiguous segments, and each of them lasts 200–1800 s. The hardness ratio between 2–10 keV and 0.5–2 keV of NICER observations are shown in the bottom left panel of Fig. 1. Before the superburst, the hardness ratio is around 0.28. During the decay phase, the hardness ratio decreased from 0.44 to 0.3 due to the cooling of the superburst emission. We also find that the post-superburst emission is harder than the pre-superburst. Assuming that the source accretion rate was not changing during the superburst period in a half-day, we propose the hardening just after the superburst is a consequence of the accretion interacting with the still very hot plasma around the NS; therefore, the source changed to a harder spectrum. We divide the light curves into four intervals: the pre-superburst (I), the superburst (II), the detection of mHz QPOs (III, see Sec. 3.2), and the return of type I X-ray bursts (IV), respectively.
After the superburst, we search for the return of the type I X-ray burst. We find two type I X-ray bursts 9.44 days after the peak of the superburst from NICER, and none from Insight-HXMT. On MJD 59140.518, 0.389 days after the second NICER burst, we find the third type I X-ray bursts from Swift/XRT ObsID 00033665175. In the right panels of Fig. 1, we plot the 0.5–10 keV light curve of two type I X-ray bursts from the ObsID 3050340150 and show the hardness ratio between 2.5–10 keV and 0.5–2.5 keV at 1 s resolution. During these two type I X-ray bursts, the hardness ratios evolve as the same trend of their light curves that is a fast rise and exponential decay, which are typical behaviors of a thermonuclear burst. We determine the start time for each burst is when the intensity reached to 10% of the peak above the persistent intensity level. Then, we define the rise time as the time between the start of the burst and the time at which the intensity reached 90% of the peak burst intensity. For these two bursts, the rise time is around 2 s. The recurrence time of these two type I X-ray bursts is 7.6 minutes.
3.2 Search for burst oscillation and mHz QPOs
We perform the -test statistics by using the code z_n_search based on Stingray (Huppenkothen et al., 2019) to search for burst oscillations in the frequency range 545–555 Hz. The cleaned event files in the 0.5–10 keV energy range are used by applying a moving window method, while the window sizes are 1, 2, and 4 s, with steps of . No significant burst oscillation signals are observed.
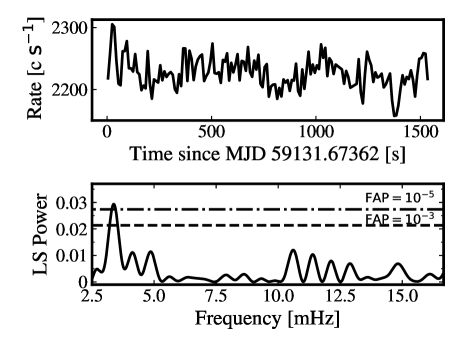
We apply the Lomb–Scargle periodogram (VanderPlas, 2018) to all segments to search for mHz QPO from NICER, Swift/XRT and Insight-HXMT/LE, in the 0.5–10 keV, 0.3–10 keV, and 1–10 keV light curves, respectively. From NICER observations, we find strong mHz QPO signals appearing from the fourth segment in ObsID 3050340145 to the first segment in ObsID 3050340147 (MJD 59131.2–59133.2), the only segment in ObsID 3050340148, and the intervals before the first type I X-ray burst and between the two bursts in ObsID 3050340150. We also detect mHz QPO signals in ObsID 00033665163 from Swift/XRT, and ObsID P030403404101, ObsID P030403404201 and ObsID P030403404301 from Insight-HXMT/LE. The frequencies of mHz QPO range from 2.7 to 11.3 mHz, corresponding to the timescales of 1.47–6.17 minutes. In particular, the time of the ObsID 00033665163 from Swift/XRT is partially overlapped with the second segment of the ObsID 3050340146 from NICER, and the observed frequencies of mHz QPO are close, i.e., 4.8 mHz versus 5.0 mHz. The Insight-HXMT/LE ObsID P030403404101 has been observed 0.022 days earlier than the NICER ObsID 3050340148, the detected mHz QPOs from these observations are also similar. In Table 1, for each segment, we provide the duration, the start time, the frequency of mHz at the highest periodogram power, and its false alarm probability (FAP) with the assumption of Gaussian white noise (Baluev, 2008). In Fig. 2, we show the light curve and the power of the eleventh segment in ObsID 3050340145 as an example.
.
| ObsIDa | NO.b | Timec | d | e | FAPf |
| Day | (ks) | (mHz) | |||
| NICER | |||||
| 3050340145 | 4 | 0.521 | 1.52 | 3.9 | |
| 5 | 0.585 | 1.58 | 3.3 | ||
| 6 | 0.650 | 1.58 | 3.4 | ||
| 7 | 0.718 | 1.29 | 4.8 | ||
| 8 | 0.779 | 1.61 | 2.9 | ||
| 9 | 0.844 | 1.53 | 3.0 | ||
| 10 | 0.909 | 1.53 | 4.0 | ||
| 11 | 0.974 | 1.55 | 3.4 | ||
| 12 | 1.037 | 1.68 | 3.6 | ||
| 13 | 1.103 | 1.53 | 5.7 | ||
| 14 | 1.166 | 1.66 | 3.2 | ||
| 15 | 1.232 | 0.97 | 3.9 | ||
| 3050340146 | 1 | 1.295 | 0.86 | 6.2 | 0.003 |
| 2 | 1.359 | 0.97 | 5.0 | 0.003 | |
| 3 | 1.425 | 1.26 | 11.3 | ||
| 4 | 1.489 | 0.44 | 8.9 | 0.02 | |
| 5 | 1.555 | 1.58 | 5.2 | 0.0015 | |
| 6 | 1.625 | 1.60 | 8.9 | ||
| 7 | 1.748 | 1.62 | 3.7 | ||
| 8 | 1.876 | 1.73 | 2.7 | ||
| 9 | 2.005 | 1.75 | 6.2 | 0.009 | |
| 10 | 2.264 | 0.35 | 6.7 | 0.0002 | |
| 3050340147 | 1 | 2.399 | 0.59 | 3.2 | |
| 3050340148 | 1 | 3.368 | 0.30 | 6.2 | |
| 3050340150 | 1 | 9.418 | 0.52 | 3.5 | |
| 2 | 9.425 | 0.39 | 4.4 | ||
| Swift/XRT | |||||
| 00033665163 | 2 | 1.370 | 0.75 | 4.8 | 0.001 |
| Insight-HXMT/LE | |||||
| P030403404101 | 2 | 3.346 | 0.47 | 6.9 | 0.005 |
| P030403404201 | 1 | 4.407 | 0.75 | 2.7 | |
| P030403404301 | 1 | 6.854 | 1.0 | 3.2 | 0.02 |
aThe ObsIDs 3050340145, 3050340146, 3050340147 have 15, 10, and 3 segments, respectively. 3050340150 has only one segment; however, we divide the data into two intervals, which locate before the first type I X-ray burst and between two bursts.
bThe number of the segment.
cThe start time of the segment since MJD 59130.7.
dThe duration of the segment.
eThe detected frequency of mHz QPO.
fThe false alarm probability at the highest periodogram peak.
3.3 Pre-superburst and pre-burst emissions
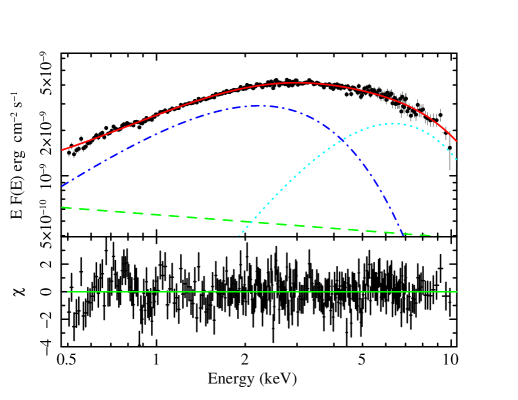
We analyze the pre-superburst and two pre-burst spectra from NICER observations, and one pre-burst spectrum from Swift/XRT observations, which are regarded as background during the superburst and the three type I X-ray bursts. We extract the pre-superburst spectrum from the second segment in ObsID 3050340144, which has an exposure of 239 s and a mean count rate of . For the two pre-burst emissions from NICER observations, the spectra are extracted from the 120 s data prior to the trigger of two type I X-ray bursts in ObsID 3050340150, resulting mean count rates of and , respectively. We generate the background spectra from the nibackgen3C50 tool (v6; Remillard et al., 2021) 333https://heasarc.gsfc.nasa.gov/docs/nicer/tools/nicer_bkg_est_tools.html, which have the count rates of 0.5 c/s. The photons from the source dominate these two persistent spectra in all energies. The spectra are grouped by a factor of 5. For the pre-burst from Swift/XRT WT observations, the spectrum is extracted from the 1200 s data prior to the burst trigger by using xselect to filter a circle centered on the source position, while the background spectrum is produced from an annulus with an inner and outer radii of , respectively. The spectrum is grouped to guarantee at least 25 photons in each channel. The arf file generated from xrtmkarf, and the rmf file swxwt0s6_20131212v015.rmf are used for spectral fitting. We fit the pre-superburst emission with a combination of a blackbody (bbodyrad in XSPEC, Arnaud, 1996), a multicolor blackbody component (diskbb, Mitsuda et al., 1984) and a power-law component (powerlaw), which are absorbed from the interstellar matter using the model tbabs (see Lin et al., 2007). A goodness of fit per degree of freedom of is obtained (see Fig. 3). We note that the are close to other methods of grouping, i.e., by minimum signal-to-noise ratio. Thereafter, we report all fitted parameters at 1 confidence level. The best-fitting blackbody temperature the inner accretion disk temperature, and the power-law index are keV, keV and , respectively. We find that is well consistent with the values reported in Keek et al. (2018) and Pinto et al. (2013). We use cflux to estimate the unabsorbed bolometric flux of in the energy range 0.5–250 keV, corresponding to , if the Eddington limit is adopted (Li et al., 2017; Keek et al., 2018). We adopt the same model tbabs(powerlaw+gaussian) to fit three pre-burst spectra. For the first pre-burst spectrum, the best-fitting power-law index, the energy and width of the gaussian component are , keV and keV, respectively. The unabsorbed bolometric flux is , corresponding to . For the second pre-burst spectrum, we obtain that the power-law index, the energy and width of the gaussian component are , keV and keV, respectively. The unabsorbed bolometric flux is , corresponding to . For the Swift/XRT pre-burst spectrum, the power-law index, the energy and width of the gaussian component are , keV and keV, respectively. The unabsorbed bolometric flux is , corresponding to . The persistent emissions of the two type I X-ray bursts are only 13% of the pre-superburst level, for the reason that the X-ray outburst of Aql X–1 was close to its end stage.
3.4 Time resolved burst spectra
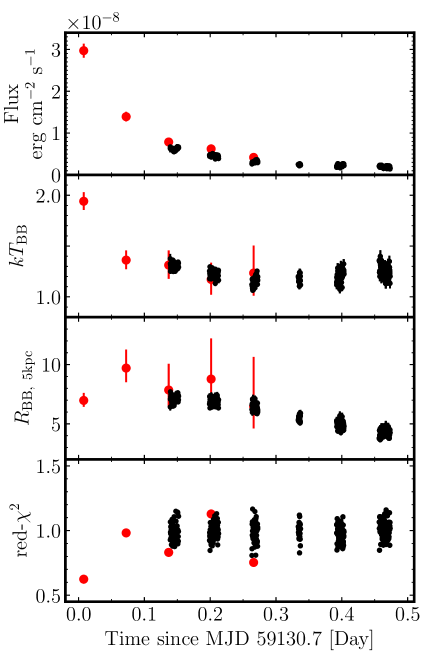
MAXI caught the early stages of the superburst from Aql X–1, where NICER performed sufficient observations since the later decay of the superburst. For the NICER observations, we extract the time resolved spectra with duration of 16 s. The persistent emissions are considered as background during the burst emission. We group the burst spectra so that each bin contains a minimum of 20 counts. All NICER and MAXI burst spectra are fitted by an absorbed blackbody model in the energy range 0.5–10 keV and 2–20 keV, respectively. The results are shown in Fig. 4. The spectra during the superburst can be well fitted with an absorbed blackbody, with the temperature drops from 2 to 1.2 keV, and the blackbody radius of 3–10 km, assuming the distance of 5 kpc to Aql X–1 (Rutledge et al., 2001). We also fit three type I X-ray bursts after the superburst observed by NICER and Swift/XRT. The peak fluxes of these three bursts are , , and , where the first burst is one of the faintest observed so far (Galloway et al., 2008, 2020). We determine the e-folding decay times of these three bursts are s, s, and s, respectively. Multiplied the peak flux by the e-folding time, we estimate the total burst fluences are , , and , respectively. The hardness ratio variations of two NICER type I X-ray bursts shown in Fig. 1 are a typical property of thermonuclear bursts caused by the blackbody evolution. We do not find the signatures of enhanced persistent emission or reflection from the accretion disk.
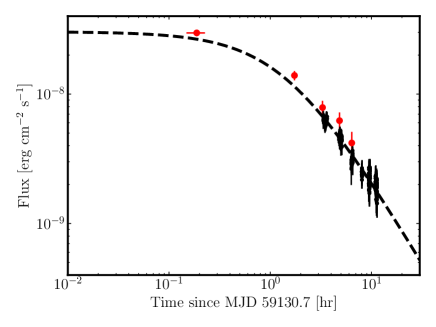
The decay of the superburst flux can be well described with the analytic expression by Cumming & Macbeth (2004, see also ), leading to constraints on the energy release per unit mass in units of and the ignition column depth in units of . These two parameters depend on the time and flux of the superburst peak, which is unknown because the observations may not cover it (see also Serino et al., 2016). We assume that the peak flux started 1 hr earlier than the observed time, and we obtain and , see Fig. 5. We then calculate the total fluence of the superburst of . All the bursts parameters are reported in Table 2.
| Start Time | Rise Time | Peak Flux | Persistent Flux | a | |||
|---|---|---|---|---|---|---|---|
| MJD | |||||||
| Superburst | 59130.680.02b | - | 7.2 yr | hr | |||
| First burstc | 59140.12400 | 2 s | - | s | |||
| Second burstc | 59140.12925 | 2 s | 454 s | s | |||
| Third burstd | 59140.51856 | 2 s | 0.389e days | s |
aBurst Fluence. bThe start time of the superburst was missed. We estimate the start time as the middle time of the gap before the superburst peak. cType I X-ray bursts from NICER observations. dType I X-ray burst from Swift/XRT observations. eThere are data gaps between the second and third bursts, and X-ray bursts may be missed. So, the recurrence time is only the upper limit.
4 Discussion
We first compare the two superbursts from the transient LMXB Aql X–1. MAXI detected two superbursts from Aql X–1 on MJD 56493.3 and 59130.7, indicating the recurrence time of yr. Assuming the distance of 5 kpc to Aql X–1, the bolometric flux and luminosity at the observed peak of count rate, the e-folding time, and the total energy of the first superburst are , , 4.3 hr, and , respectively. However, in this work, we focus on the second superburst. The persistent emission of pre-superburst is well fitted with a model combination of blackbody, diskbb and power-law components. The bolometric flux and luminosity are and , respectively, corresponding to 10.5% of the Eddington limit. The superburst lasted from MJD 59130.7 to 59131.2, and the flux evolved from to , see Table 2. From the decay of the superburst, we roughly estimate and . The observed properties of two superbursts are comparable.
After the superburst from Aql X–1, for the first time, we observed the transition from superburst, via marginally stable burning, to unstable burning. We then compare the observed quantities, including the quenching time, the recurrence of type I X-ray bursts after the superburst, and the frequencies of mHz QPO, with the simulations provided in Keek et al. (2012). Keek et al. (2012) simulated the production and subsequent impacts of a superburst for a NS of with a 10 km radius accreting composition by a solar, helium-rich and a mixture of carbon and iron (models H, He and C, respectively) at a constant rate of , corresponding to 30% of the Eddington-limit rate. They found that the superburst occurs 1.28 yr after the start of accretion. For the case of Aql X–1, the NS accretes the composition from the companion similar to the model H in Keek et al. (2012). However, there are few differences between the simulations and the observations in Aql X–1. Aql X–1 is a transient source that has been observed X-ray outbursts recurring around one year, each of them lasting –6 months (Degenaar et al., 2019). Considering that the superburst recurrence time is , we obtain , if we take a typical value of the averaged accretion rate of in total 79 days from the 2013 outburst in Aql X–1 (Ootes et al., 2018). Hence, the recurrence time of the superburst in Aql X–1 should be larger than the value we observed. However, the energy release from the inner crust may deduce the recurrence time due to frequent outbursts in Aql X–1, similar to the case of GX 17+2 (see also Keek et al., 2006).
When the NS cooling continues, with the quenching time of 1.1 days (model H) and 11.3 days (model He) after the superburst, type I X-ray bursts are returned. We find that two weak type I X-ray bursts with a short recurrence time of 7.6 minutes appear 9.44 days after the superburst of Aql X–1. We suggest that these two bursts are likely the first appearance of unstable burning from Aql X–1 since the superburst. There are data gaps, i.e., 0.625 days of total exposure with the time span of 8.924 days, between the end of superburst and the detection of type I X-ray bursts, which may miss bursts. However, we have 47 continuous segments lasting at least 500 s (NICER, Insight-HXMT/LE and Swift/XRT data), i.e., longer than the recurrence time of 7.6 minutes, so more bursts should be detected. If the recurrence time is longer than 7.6 minutes, then we can estimate the probability of the number of bursts for a 0.625 days exposure in the total duration of 8.924 days. By applying a binomial distribution, the probability of detecting bursts out of is , where is the observation efficiency (see Keek et al., 2012, for more details), and is zero in our case. So, we have possibilities higher than 90% with the total number of bursts . There is a little chance that we missed potential bursts. Moreover, the properties of the two type I X-ray bursts are consistent with the simulated burst resumption. We propose that this is the first accurate measurement of the quenching time, even though data gaps exist. This is also the shortest quenching time in all superbursts so far, except for the upper limit 2.2 days from GX 17+2 that apparently has a higher accretion rate. If the simulated quenching time is corrected with the relation proposed by Cumming & Macbeth (2004) (and note that the pre-superburst emits at and drops to till the return of type I X-ray bursts), we will obtain a quenching time, i.e., 3.7 days assuming an averaged accretion rate of . Moreover, the rapid rotation of Aql X–1 can delay the appearance of type I X-ray bursts, leading to a longer quenching time(Piro & Bildsten, 2007; Keek et al., 2009, 2012). The simulated and observed quenching time can be matched.
When the type I X-ray bursts return, we find recurrence time of 7.6 minutes. Now, we compare the observed and predicted recurrence time (see e.g., Li et al., 2018). The bolometric flux between the two type I X-ray bursts is . The luminosity is , assuming the distance of 5 kpc to Aql X–1. The local accretion rate per unit area onto the NS is , where is the gravitational constant, the gravitational redshift is for a NS with a mass of and there is a radius of km. We then estimate the ignition column depth , where is the nuclear energy produced for solar composition, i.e., (Goodwin et al., 2019). From the ignition column depth and local accretion rate, we calculate the recurrence time between the two bursts, , significantly larger than the observed value. For a helium burst, the calculated recurrence time is four times longer. Therefore, the observed recurrence time is too short to accrete enough matter to trigger the second X-ray burst. Type I X-ray bursts with short recurrence times have also been observed in several sources, e.g., EXO 0748–676 (Boirin et al., 2007), 4U 1636–536 (Linares et al., 2009), and see also Keek et al. (2010) and Galloway et al. (2008). We propose several possibilities that can reduce the recurrence time. First, the resumption of type I X-ray bursts may ignite at a shallow column depth if the NS envelope is sufficiently hot (see e.g., Galloway & Keek, 2021). Second, the accreted matter on the NS surface is inhomogeneously distributed, causing a larger local accretion rate. Third, the first type I X-ray burst only depletes a considerably small fraction of accreting matter (Keek & Heger, 2017). Fourth, the rapid rotation of Aql X–1 can induce mixing of freshly accreted fuel to explain the recurrence time on a timescale of 10 minutes (Fujimoto, 1993; Piro & Bildsten, 2007; Keek et al., 2009, 2010; Galloway et al., 2018).
After the superburst, the NS cools down and transits from stable burning to marginally stable burning, causing oscillations in light curves. Heger et al. (2007) reproduce the oscillation period to be the geometric mean of the accretion and thermal time scales . Keek et al. (2012) obtain a similar time scale of 5 minutes (model H) and 20 minutes (model He). We detect the mHz QPOs in the frequency range 2.7–11.3 mHz (time scales of 1.5–6.2 minutes) lasting 2 days after the superburst. In addition, the mHz QPOs are transiently appearing between MJD 59133.2 and 59141.1, which was unpredicted in Keek et al. (2012). Since the occurrance of marginally stable burning sensitively depends on the NS surface temperature, the transient of mHz QPOs may present the temperature evolution of the combination effects of NS cooling and heating by accretion. The detected frequencies of mHz QPO are consistent with previous results (Revnivtsev et al., 2001; Mancuso et al., 2021). Before the first type I X-ray burst in ObsID 3050340150, a 3.5 mHz QPO appeares again with FAP. Moreover, we also observe a 4.4 mHz QPO between two bursts, which is unexpected from simulations. We propose that the first type I X-ray burst heated the NS envelope, causing the appearance of marginally stable burning before the second type I X-ray burst. This effect should be verified and taken into account in future simulations.
It has been four years since the launching of NICER. It is possible that NICER has been detected more superbursts besides of the one discussed in this article. There are many signatures of superburst, including the enhanced emission, the hardness ratio, and the appearance of mHz QPOs; these signatures can be used to determine the presence of superbursts even if the observations only partially cover the source. It is worthwhile to perform a dedicated search for superbursts from NICER data set, accompanying with other instruments, i.e., MAXI and Insight-HXMT.
References
- Arnaud (1996) Arnaud, K. A. 1996, in Astronomical Society of the Pacific Conference Series, Vol. 101, Astronomical Data Analysis Software and Systems V, ed. G. H. Jacoby & J. Barnes, 17
- Baluev (2008) Baluev, R. V. 2008, MNRAS, 385, 1279, doi: 10.1111/j.1365-2966.2008.12689.x
- Boirin et al. (2007) Boirin, L., Keek, L., Méndez, M., et al. 2007, A&A, 465, 559, doi: 10.1051/0004-6361:20066204
- Burrows et al. (2005) Burrows, D. N., Hill, J. E., Nousek, J. A., et al. 2005, Space Sci. Rev., 120, 165, doi: 10.1007/s11214-005-5097-2
- Callanan et al. (1999) Callanan, P. J., Filippenko, A. V., & Garcia, M. R. 1999, IAU Circ., 7086
- Campana et al. (2013) Campana, S., Coti Zelati, F., & D’Avanzo, P. 2013, MNRAS, 432, 1695, doi: 10.1093/mnras/stt604
- Campana et al. (1998) Campana, S., Stella, L., Mereghetti, S., et al. 1998, ApJ, 499, L65, doi: 10.1086/311357
- Cao et al. (2020) Cao, X., Jiang, W., Meng, B., et al. 2020, Science China Physics, Mechanics, and Astronomy, 63, 249504, doi: 10.1007/s11433-019-1506-1
- Casella et al. (2008) Casella, P., Altamirano, D., Patruno, A., Wijnands, R., & van der Klis, M. 2008, ApJ, 674, L41, doi: 10.1086/528982
- Chen et al. (2020) Chen, Y., Cui, W., Li, W., et al. 2020, Science China Physics, Mechanics, and Astronomy, 63, 249505, doi: 10.1007/s11433-019-1469-5
- Chevalier et al. (1999) Chevalier, C., Ilovaisky, S. A., Leisy, P., & Patat, F. 1999, A&A, 347, L51
- Cumming & Bildsten (2001) Cumming, A., & Bildsten, L. 2001, ApJ, 559, L127, doi: 10.1086/323937
- Cumming & Macbeth (2004) Cumming, A., & Macbeth, J. 2004, ApJ, 603, L37, doi: 10.1086/382873
- Cumming et al. (2006) Cumming, A., Macbeth, J., in ’t Zand, J. J. M., & Page, D. 2006, ApJ, 646, 429, doi: 10.1086/504698
- Degenaar et al. (2019) Degenaar, N., Ootes, L. S., Page, D., et al. 2019, MNRAS, 488, 4477, doi: 10.1093/mnras/stz1963
- Evans et al. (2007) Evans, P. A., Beardmore, A. P., Page, K. L., et al. 2007, A&A, 469, 379, doi: 10.1051/0004-6361:20077530
- Evans et al. (2009) —. 2009, MNRAS, 397, 1177, doi: 10.1111/j.1365-2966.2009.14913.x
- Falanga et al. (2008) Falanga, M., Chenevez, J., Cumming, A., et al. 2008, A&A, 484, 43, doi: 10.1051/0004-6361:20078982
- Fujimoto (1993) Fujimoto, M. Y. 1993, ApJ, 419, 768, doi: 10.1086/173528
- Galloway & Keek (2021) Galloway, D. K., & Keek, L. 2021, Astrophysics and Space Science Library, 461, 209, doi: 10.1007/978-3-662-62110-3_5
- Galloway et al. (2008) Galloway, D. K., Muno, M. P., Hartman, J. M., Psaltis, D., & Chakrabarty, D. 2008, ApJS, 179, 360, doi: 10.1086/592044
- Galloway et al. (2018) Galloway, D. K., in ’t Zand, J. J. M., Chenevez, J., et al. 2018, ApJ, 857, L24, doi: 10.3847/2041-8213/aabd32
- Galloway et al. (2020) Galloway, D. K., in’t Zand, J., Chenevez, J., et al. 2020, ApJS, 249, 32, doi: 10.3847/1538-4365/ab9f2e
- Goodwin et al. (2019) Goodwin, A. J., Heger, A., & Galloway, D. K. 2019, ApJ, 870, 64, doi: 10.3847/1538-4357/aaeed2
- Heger et al. (2007) Heger, A., Cumming, A., & Woosley, S. E. 2007, ApJ, 665, 1311, doi: 10.1086/517491
- Huppenkothen et al. (2019) Huppenkothen, D., Bachetti, M., Stevens, A. L., et al. 2019, ApJ, 881, 39, doi: 10.3847/1538-4357/ab258d
- in’t Zand (2017) in’t Zand, J. 2017, in 7 years of MAXI: monitoring X-ray Transients, ed. M. Serino, M. Shidatsu, W. Iwakiri, & T. Mihara, 121. https://arxiv.org/abs/1702.04899
- Iwakiri et al. (2020) Iwakiri, W., Serino, M., Negoro, H., et al. 2020, The Astronomer’s Telegram, 14079, 1
- Keek et al. (2010) Keek, L., Galloway, D. K., in’t Zand, J. J. M., & Heger, A. 2010, ApJ, 718, 292, doi: 10.1088/0004-637X/718/1/292
- Keek & Heger (2011) Keek, L., & Heger, A. 2011, ApJ, 743, 189, doi: 10.1088/0004-637X/743/2/189
- Keek & Heger (2017) —. 2017, ApJ, 842, 113, doi: 10.3847/1538-4357/aa7748
- Keek et al. (2012) Keek, L., Heger, A., & in’t Zand, J. J. M. 2012, ApJ, 752, 150, doi: 10.1088/0004-637X/752/2/150
- Keek et al. (2006) Keek, L., in’t Zand, J. J. M., & Cumming, A. 2006, A&A, 455, 1031, doi: 10.1051/0004-6361:20064884
- Keek et al. (2009) Keek, L., Langer, N., & in’t Zand, J. J. M. 2009, A&A, 502, 871, doi: 10.1051/0004-6361/200911619
- Keek et al. (2018) Keek, L., Arzoumanian, Z., Bult, P., et al. 2018, ApJ, 855, L4, doi: 10.3847/2041-8213/aab104
- Lewin et al. (1993) Lewin, W. H. G., van Paradijs, J., & Taam, R. E. 1993, Space Sci. Rev., 62, 223, doi: 10.1007/BF00196124
- Li et al. (2017) Li, Z., Falanga, M., Chen, L., Qu, J., & Xu, R. 2017, ApJ, 845, 8, doi: 10.3847/1538-4357/aa7d0b
- Li et al. (2018) Li, Z., De Falco, V., Falanga, M., et al. 2018, A&A, 620, A114, doi: 10.1051/0004-6361/201833857
- Lin et al. (2007) Lin, D., Remillard, R. A., & Homan, J. 2007, ApJ, 667, 1073, doi: 10.1086/521181
- Linares et al. (2009) Linares, M., Watts, A., Altamirano, D., et al. 2009, The Astronomer’s Telegram, 1979, 1
- Liu et al. (2020) Liu, C., Zhang, Y., Li, X., et al. 2020, Science China Physics, Mechanics, and Astronomy, 63, 249503, doi: 10.1007/s11433-019-1486-x
- Mancuso et al. (2021) Mancuso, G. C., Altamirano, D., Méndez, M., Lyu, M., & Combi, J. A. 2021, MNRAS, 502, 1856, doi: 10.1093/mnras/stab159
- Mata Sánchez et al. (2017) Mata Sánchez, D., Muñoz-Darias, T., Casares, J., & Jiménez-Ibarra, F. 2017, MNRAS, 464, L41, doi: 10.1093/mnrasl/slw172
- Matsuoka et al. (2009) Matsuoka, M., Kawasaki, K., Ueno, S., et al. 2009, PASJ, 61, 999, doi: 10.1093/pasj/61.5.999
- Mihara et al. (2011) Mihara, T., Nakajima, M., Sugizaki, M., et al. 2011, PASJ, 63, S623, doi: 10.1093/pasj/63.sp3.S623
- Mitsuda et al. (1984) Mitsuda, K., Inoue, H., Koyama, K., et al. 1984, PASJ, 36, 741
- Ootes et al. (2018) Ootes, L. S., Wijnands, R., Page, D., & Degenaar, N. 2018, MNRAS, 477, 2900, doi: 10.1093/mnras/sty825
- Pinto et al. (2013) Pinto, C., Kaastra, J. S., Costantini, E., & de Vries, C. 2013, A&A, 551, A25, doi: 10.1051/0004-6361/201220481
- Piro & Bildsten (2007) Piro, A. L., & Bildsten, L. 2007, ApJ, 663, 1252, doi: 10.1086/518687
- Remillard et al. (2021) Remillard, R. A., Loewenstein, M., Steiner, J. F., et al. 2021, arXiv e-prints, arXiv:2105.09901. https://arxiv.org/abs/2105.09901
- Revnivtsev et al. (2001) Revnivtsev, M., Churazov, E., Gilfanov, M., & Sunyaev, R. 2001, A&A, 372, 138, doi: 10.1051/0004-6361:20010434
- Rutledge et al. (2001) Rutledge, R. E., Bildsten, L., Brown, E. F., Pavlov, G. G., & Zavlin, V. E. 2001, ApJ, 559, 1054, doi: 10.1086/322361
- Serino et al. (2016) Serino, M., Iwakiri, W., Tamagawa, T., et al. 2016, PASJ, 68, 95, doi: 10.1093/pasj/psw086
- Strohmayer & Bildsten (2006) Strohmayer, T., & Bildsten, L. 2006, in Compact stellar X-ray sources, Cambridge Astrophysics Series, No. 39, ed. W. Lewin & M. van der Klis (Cambridge: Cambridge University Press), 113–156
- Strohmayer & Brown (2002) Strohmayer, T. E., & Brown, E. F. 2002, ApJ, 566, 1045, doi: 10.1086/338337
- Sugizaki et al. (2011) Sugizaki, M., Mihara, T., Serino, M., et al. 2011, PASJ, 63, S635, doi: 10.1093/pasj/63.sp3.S635
- VanderPlas (2018) VanderPlas, J. T. 2018, ApJS, 236, 16, doi: 10.3847/1538-4365/aab766
- Zhang et al. (2020) Zhang, S.-N., Li, T., Lu, F., et al. 2020, Science China Physics, Mechanics, and Astronomy, 63, 249502, doi: 10.1007/s11433-019-1432-6