Send correspondence to J. Llop-Sayson
E-mail: jllopsay@caltech.edu
New method to achieve the proper polarization state for a vector vortex coronagraph
Abstract
The vector vortex coronagraph (VVC) performance in the laboratory and in ground-based observatories has earned it a spot on the NASA mission concepts HabEx and LUVOIR. The VVC induces a phase ramp through the manipulation of the polarization state. Left- and right-circular polarizations get imprinted a phase ramp of opposite signs, which prevents model-based focal plane wavefront sensing and control strategies in natural light. We thus have to work with a polarization state than ensures circularly polarized light at the VVC mask. However, achieving this polarization state can be non trivial if there are optics that add phase retardance of any kind between the circular polarizer and the focal plane mask. Here we present the method currently used at the Caltech high contrast spectroscopy testbed (HCST) to achieve the proper circular polarization state for a VVC, which only uses the deformable mirror and appropriate rotation of the circular polarizer and analyzer optics. At HCST we achieve raw contrast levels of for broadband light with a VVC.
keywords:
High contrast imaging, Exoplanets, Coronagraphs1 INTRODUCTION
The vortex coronagraph (VC) concept[1, 2] has enabled the imaging of exoplanets from ground based telescopes for their characterization [3, 4, 5]. Its performance in terms of inner working angle, contrast, throughput to off-axis sources and sensitivity to low order aberrations makes the VC an excellent coronagraph architecture for most cases[6, 7]. The NASA mission concepts considered by the Astronomy and Astrophysics Decadal Survey (Astro2020) HabEx[8] and LUVOIR-B[9] have the VC as their baseline coronagraph mode.
A VC imprints an azimuthal phase ramp on the beam at a focal plane of the form , where is the charge and the azimuthal angle. For an on-axis source, i.e. the star, this optical vortex diffracts all the light out of the outer edge of the beam at the following pupil plane, where a Lyot stop blocks the diffracted light. An off-axis source, such as a planet, avoids the singularity at the center of the vortex and is transmitted through the Lyot stop. To fabricate an optical vortex we resort to polarization changes in order to build an achromatic vortex phase ramp. We refer to this kind of vortex as a vector vortex coronagraph (VVC)[10]. Some manufacturing techniques that successfully build achromatic VVCs are: liquid crystal polymers[11], subwavelength gratings [12, 13], and photonic crystals [14]. The VVC geometrical phase has an important limitation: the phase ramp is imprinted with a different sign for left- and right-circular polarizations. We are currently researching ways to manufacture achromatic scalar vortex coronagraphs (see Desai et al. in these proceedings).
Furthermore, the manufacturing of a VVC is not perfect; a retardance error is introduced that causes a chromatic polarization leakage term, for which the vortex ramp is not applied. Hence, this term goes through the Lyot stop freely and ends in the image plane. All these challenges require our close attention on the polarization state of our system. In this work we are interested in ensuring that we work with the proper polarization state in order to do wavefront control and achieve the best performance a VVC has to offer.
2 Achieving the proper polarization state for a VVC
2.1 The vector vortex coronagraph polarization model
Due to the physical process that takes place at the focal plane mask of a VVC and how the vortex ramp is imprinted with polarization changes, the VVC mask acts as a half-wave plate that imprints a vortex ramp of different sign for the left- and right-circular polarizations. A VVC mask in matrix form using the Jones matrix formalism in circular basis is written as:
| (1) |
Where is the azimuthal angle around the axis. The right-circular polarization going through the VVC mask will become left-circular with a positive vortex ramp; the left-circular will become right-circular with the opposite sign ramp. An idealized VVC, as shown in Eq. 1, does not account for limitations associated with manufacturing imperfections of the focal plane mask. In practice, a VVC has a non-ideal transmissivity and non-zero polarization leakage; in matrix form:
| (2) |
where and are constants associated to the transmissivity and polarization leakage respectively. We refer to Ref. 15 for a comprehensive and thorough description of the fundamentals of a VVC.
The leakage term amplitude, , is driven by the manufacturing quality of the focal plane mask, but is, however, inevitable. This incoherent term is thus not affected by the Lyot stop since it does not carry the vortex ramp. The only way of cancelling it is by adding a circular analyzer downstream of the focal plane mask, a technique often referred to as polarization filtering.
2.2 The proper polarization state
The fact that the two orthogonal polarizations have different phase ramps (see Eq. 1) makes it impossible to distinguish them to do focal plane wavefront control with our current methods. Indeed, to do wavefront control an estimate of the electric field is needed at the image plane, and to get such estimate we apply phase diversity that inevitably gets confused if both polarizations are present at the focal plane mask. There is no way of effectively doing wavefront control if left and right-circular polarizations have comparable intensities at the focal plane mask, these two states would be incoherent in the image plane. Therefore, we need circular polarization at the focal plane mask of a VVC.
Therefore, for an unpolarized source, a VVC requires a circular polarizer (or beamsplitter) that sets the polarization state of the beam to pure circular polarization at the focal plane mask. The leakage term is then dealt with with a circular analyzer downstream of the mask. Any other configuration results in two incoherent components of the light that cannot be disentangled with phase diversity.
2.3 Method to achieve the proper polarization state
Achieving circular polarization at the focal plane mask can be non trivial. The optics in a circular polarizer and analyzer are transmissive optics, which makes them susceptible of introducing unwanted wavefront errors. In a high contrast imaging setup, the wavefront error budget is usually very strict, so we want to avoid having these optics right next to the focal plane mask. Such is the case of HCST. As presented in Sec. 3, our circular polarizer is upstream of the entrance pinhole, in which case it does not introduce any wavefront error thanks to the filtering of the pinhole. Furthermore, the circular analyzer is placed downstream of both the Lyot stop and the field stop, which block most of the leftover light outside of the region of interest. In this configuration the wavefront error that the polarizer and analyzer would introduce is largely eliminated. However, this results in having several optics between the circular polarizer and the focal plane mask, and between the focal plane mask and the circular analyzer.
The optics in the path change the polarization state of the light. This is especially true for flat mirrors at wide angles[16], but even parabolic mirrors add polarization aberrations[17]. Therefore, even if we set the circular polarizer at the entrance of the setup in such a way that the light is in a circular polarization state, i.e. linear polarizer and quarter-wave plate fast axis at 45∘, by the time the light arrives at the focal plane mask, the polarization state has changed. In this case we would find a mixing of left and right polarizations that induces the incoherent terms discussed in Sec. 2.1.
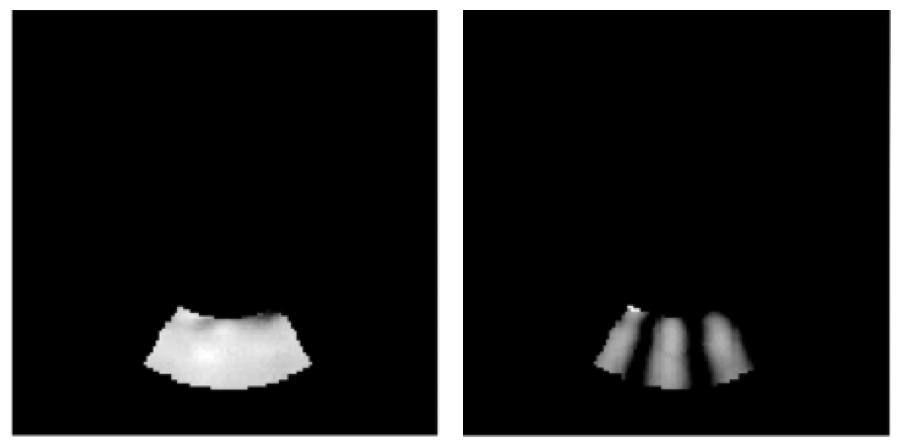
A way to know if the polarization is pure circular at the focal plane mask is by sending a flat probe with a sinc function on the deformable mirror (DM). A flat probe remains flat in intensity distribution through the circular analyzer only if there is pure circular polarization at the focal plane mask. If not, the mixture of polarizations going through the circular analyzer optics results in an azimuthal modulation that can be seen in the image plane. In Fig. 1 we show both cases. To show this in theory we resort to a simplified mathematical model of the testbed. We first assume that the light reaches the circular analyzer with both polarizations having the same intensity and equal to one, or, as described by a Jones vector: . If this beam goes through the circular analyzer, the optics of which are set to arbitrary positions, i.e. the linear polarizer and quarter-wave plate fast axis are at arbitrary rotation angles, then the light downstream (for both polarizations) can be written as:
| (3) |
Where are real-valued constants that are function of the position of the linear polarizer and quarter-wave plate axis. This expression describes an azimuthal modulation of the intensity for the input light, . Changing the relative intensity of the left and right polarization terms only changes the amplitude of the different terms in the expression above, but the same azimuthal modulation is maintained. Such expression holds unless: (1) the vortex mask applies the same phase ramp to all the light, i.e. when there is circular polarization at the focal plane mask, (2) when the linear polarizer and quarter-wave plate fast axis are at 45∘ at the circular analyzer. When there is circular polarization at the focal plane mask, so all the light gets imprinted the same phase ramp sign, the beam immediately downstream of the circular analyzer is only dependent on by the ramp phase change: . We avoid being in case (2) by trying several arbitrary configurations of the circular analyzer optics.
 |
It is worth noting that we do not have a complete picture of the polarization changes in the testbed; with this method we do not determine the polarization aberrations, the retardance added by each optic, or even the combined retardance upstream and downstream of the focal plane mask. However, these are unimportant for all purposes that are relevant for the case at hand: doing wavefront control. We are thus only interested in having pure circularly polarized light immediately upstream of the focal plane mask.
3 Laboratory setup: The high contrast spectroscopy testbed (HCST)
The experiments presented here are performed at the high contrast spectroscopy testbed (HCST) at Caltech. HCST saw its first light three years ago [18], and we started by implementing wavefront control with the electric field conjugation (EFC) algorithm [19] reaching levels of raw contrast in broadband light[20]. We also implemented a way to improve our Jacobian computation with a System Identification based algorithm[20]. We demonstrated the Apodized Vortex Coronagraph concept[21] that deals with diffracted light from segmentation in the pupil. Lastly, we presented narrowband results for a modified EFC algorithm for single mode fibers, reaching 1 normalized intensity [22].
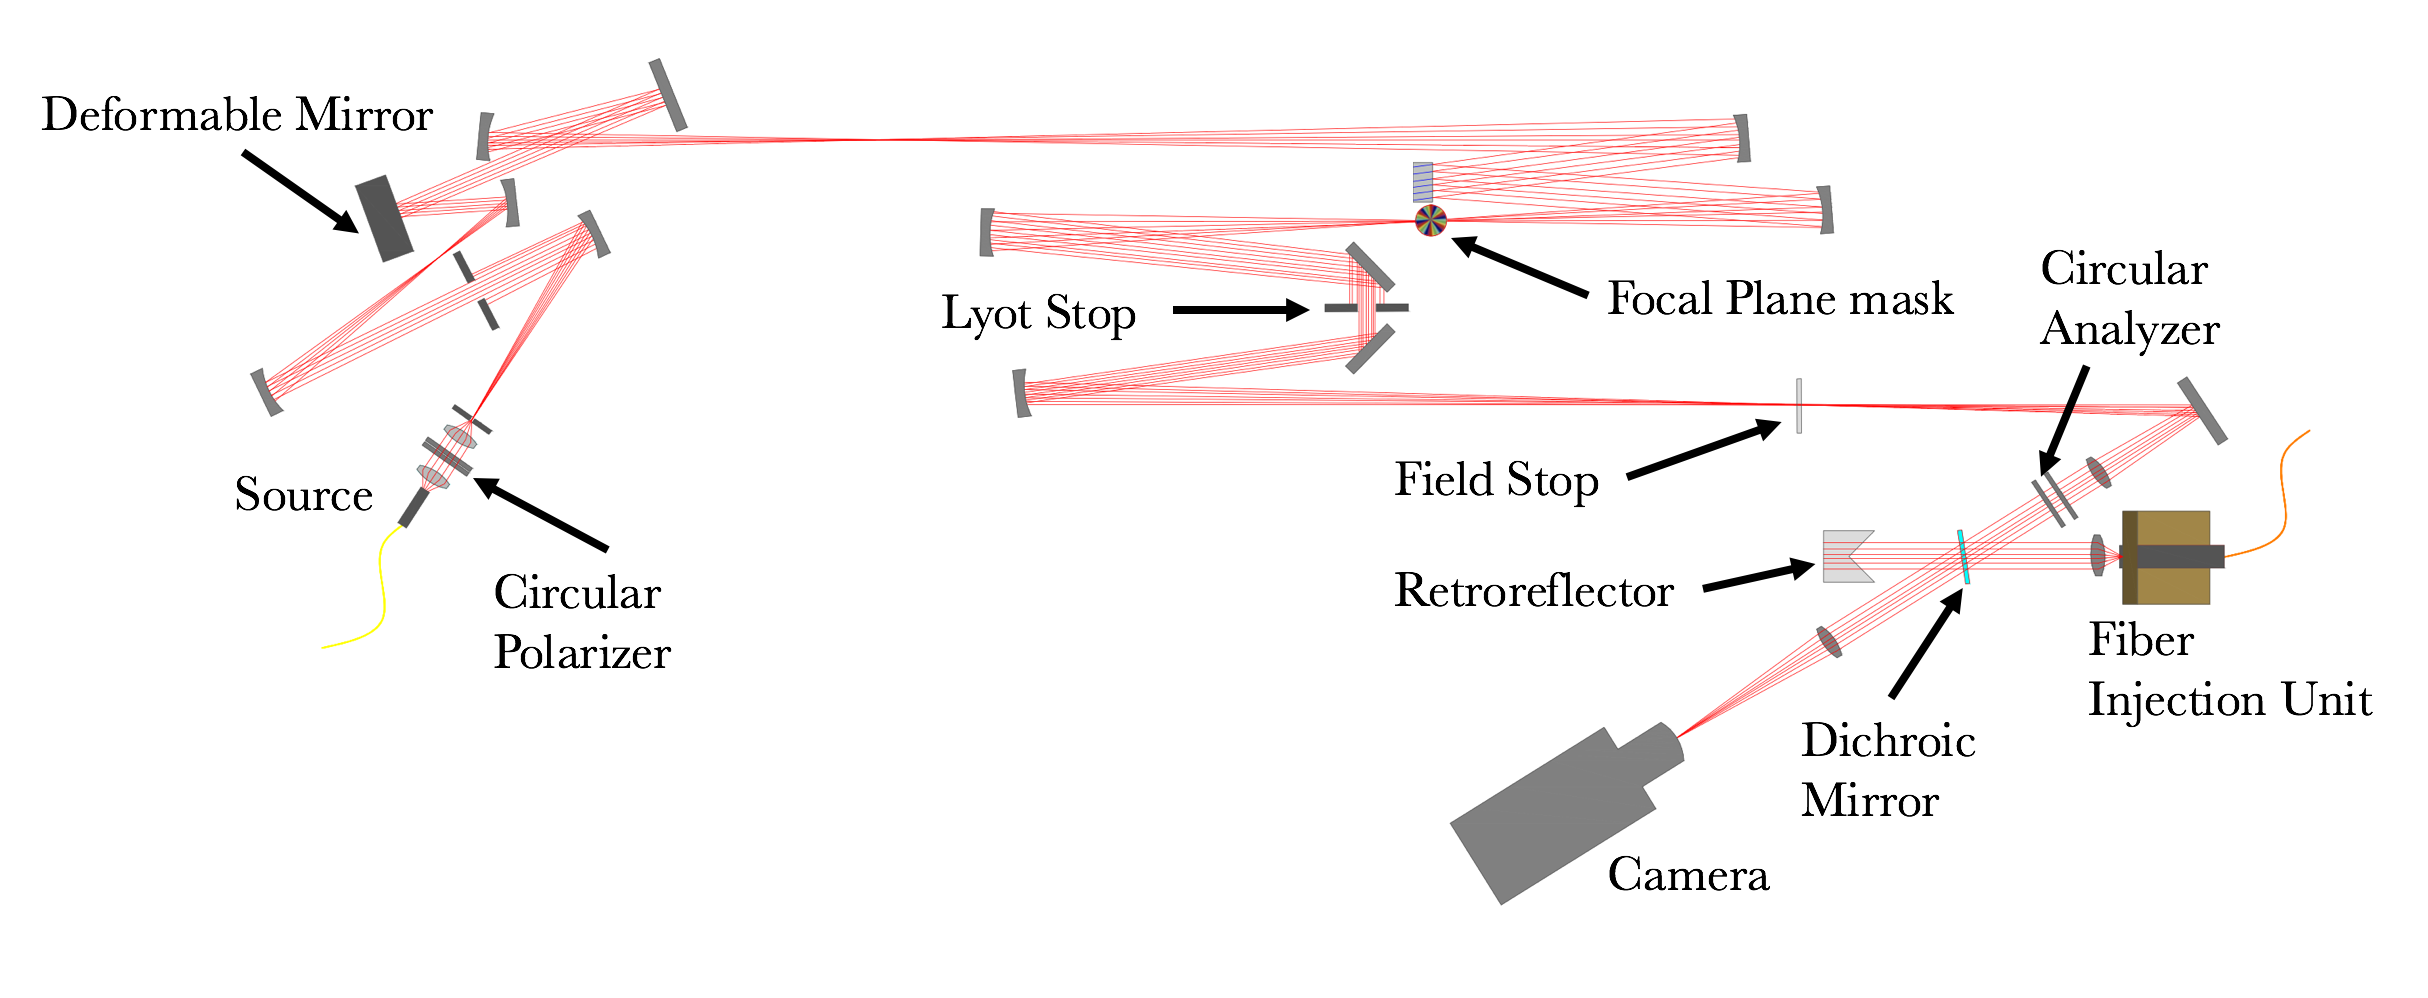
In Fig. 2 we show the current layout of HCST, and we refer to Ref. 22 for a complete description of the current laboratory setup. For the work presented here, we note the presence of the circular polarizer and analyzer: the linear polarizers and quarter-wave plates are mounted individually on an actuated rotation stage (CONEX-AG-PR100P) with 0.001∘ precision. This allows us to test any combination of configuration in the polarizer/analyzer.
 |
A new feature at HCST is the environmental sensing system. Environmental factors such as temperature, humidity, air turbulence and vibrations affect the data being recorded at HCST. To deal with this, eight sensors have been placed inside the testbed to work with computer programs that display the live environmental data from HCST and any user specified time interval. The environmental sensing system will be used to correlate the data collected with the testbed during any given experiment or time period and the corresponding environmental data. This will help us better understand the limitations of the testbed, and the limitations of current high contrast technologies.
At the heart of the environmental sensing system is a custom printed circuit board which attaches to the Arduino hardware and a port that connects to eight sensors. The Arduino hardware board being used is the Adafruit Feather M0 Adalogger which attaches to an Ethernet FeatherWing and a DS3231 Precision Real Time Clock (RTC) FeatherWing. Eight BME680 sensors measure the temperature, humidity and pressure data at the locations that are most sensitive to environmental changes inside the HCST. These sensors measure humidity with 0.008% r.H. resolution, pressure with 0.18Pa resolution and temperature with 0.01∘C resolution.
4 Laboratory results
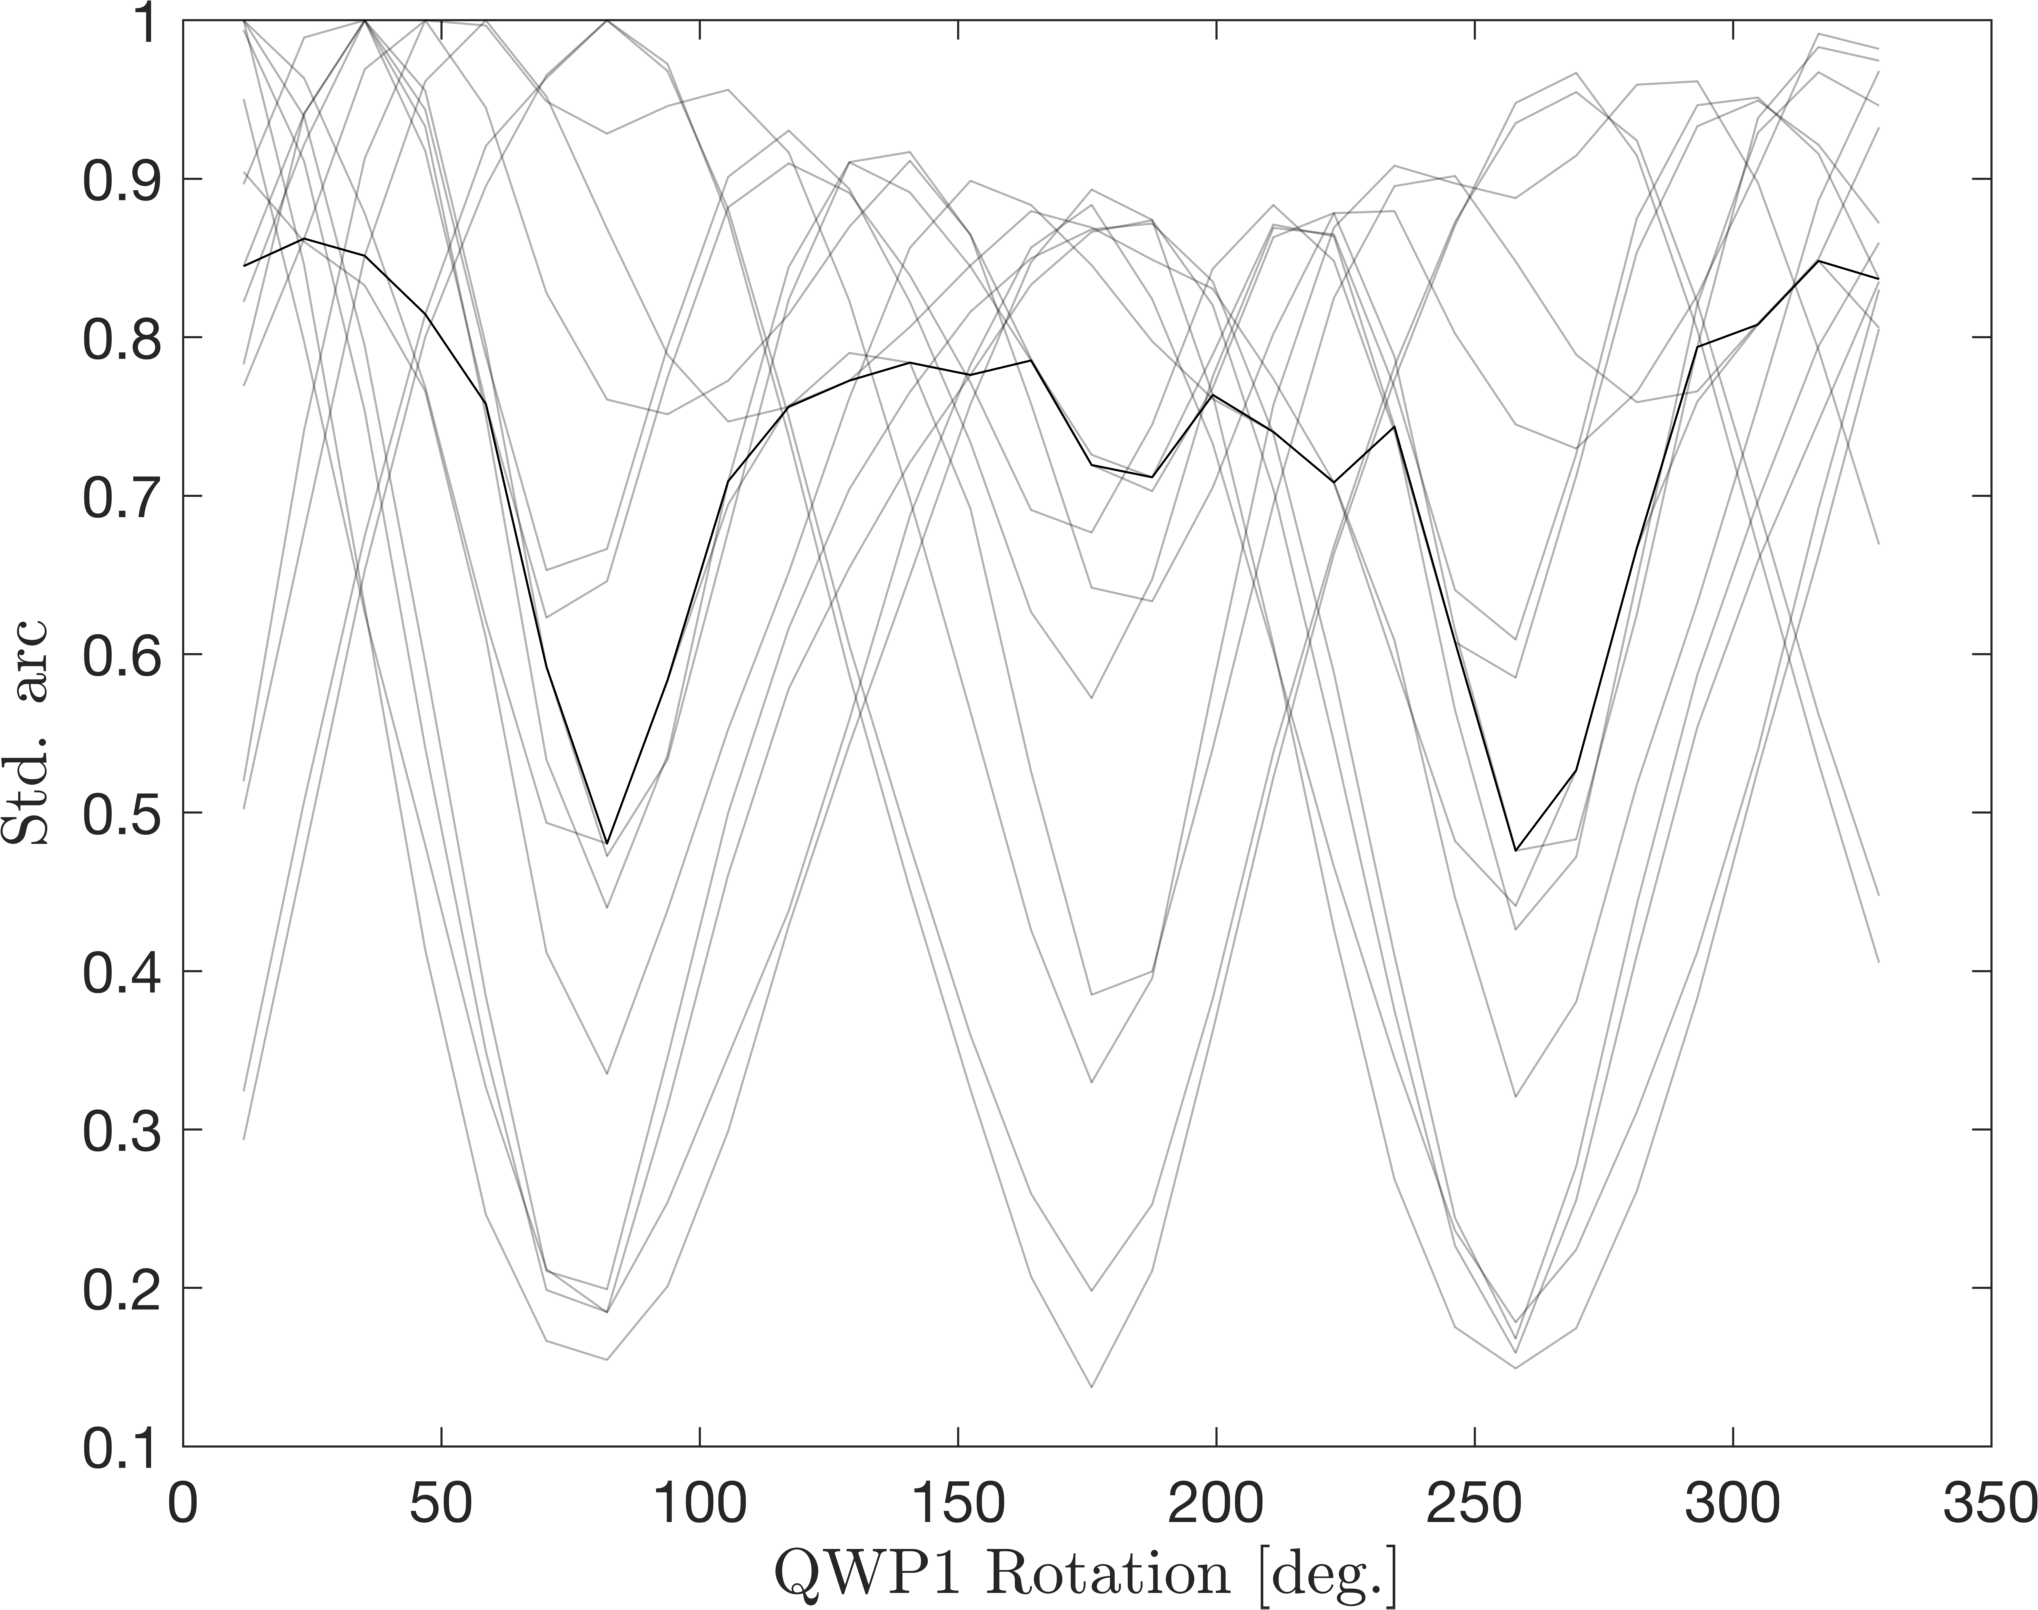
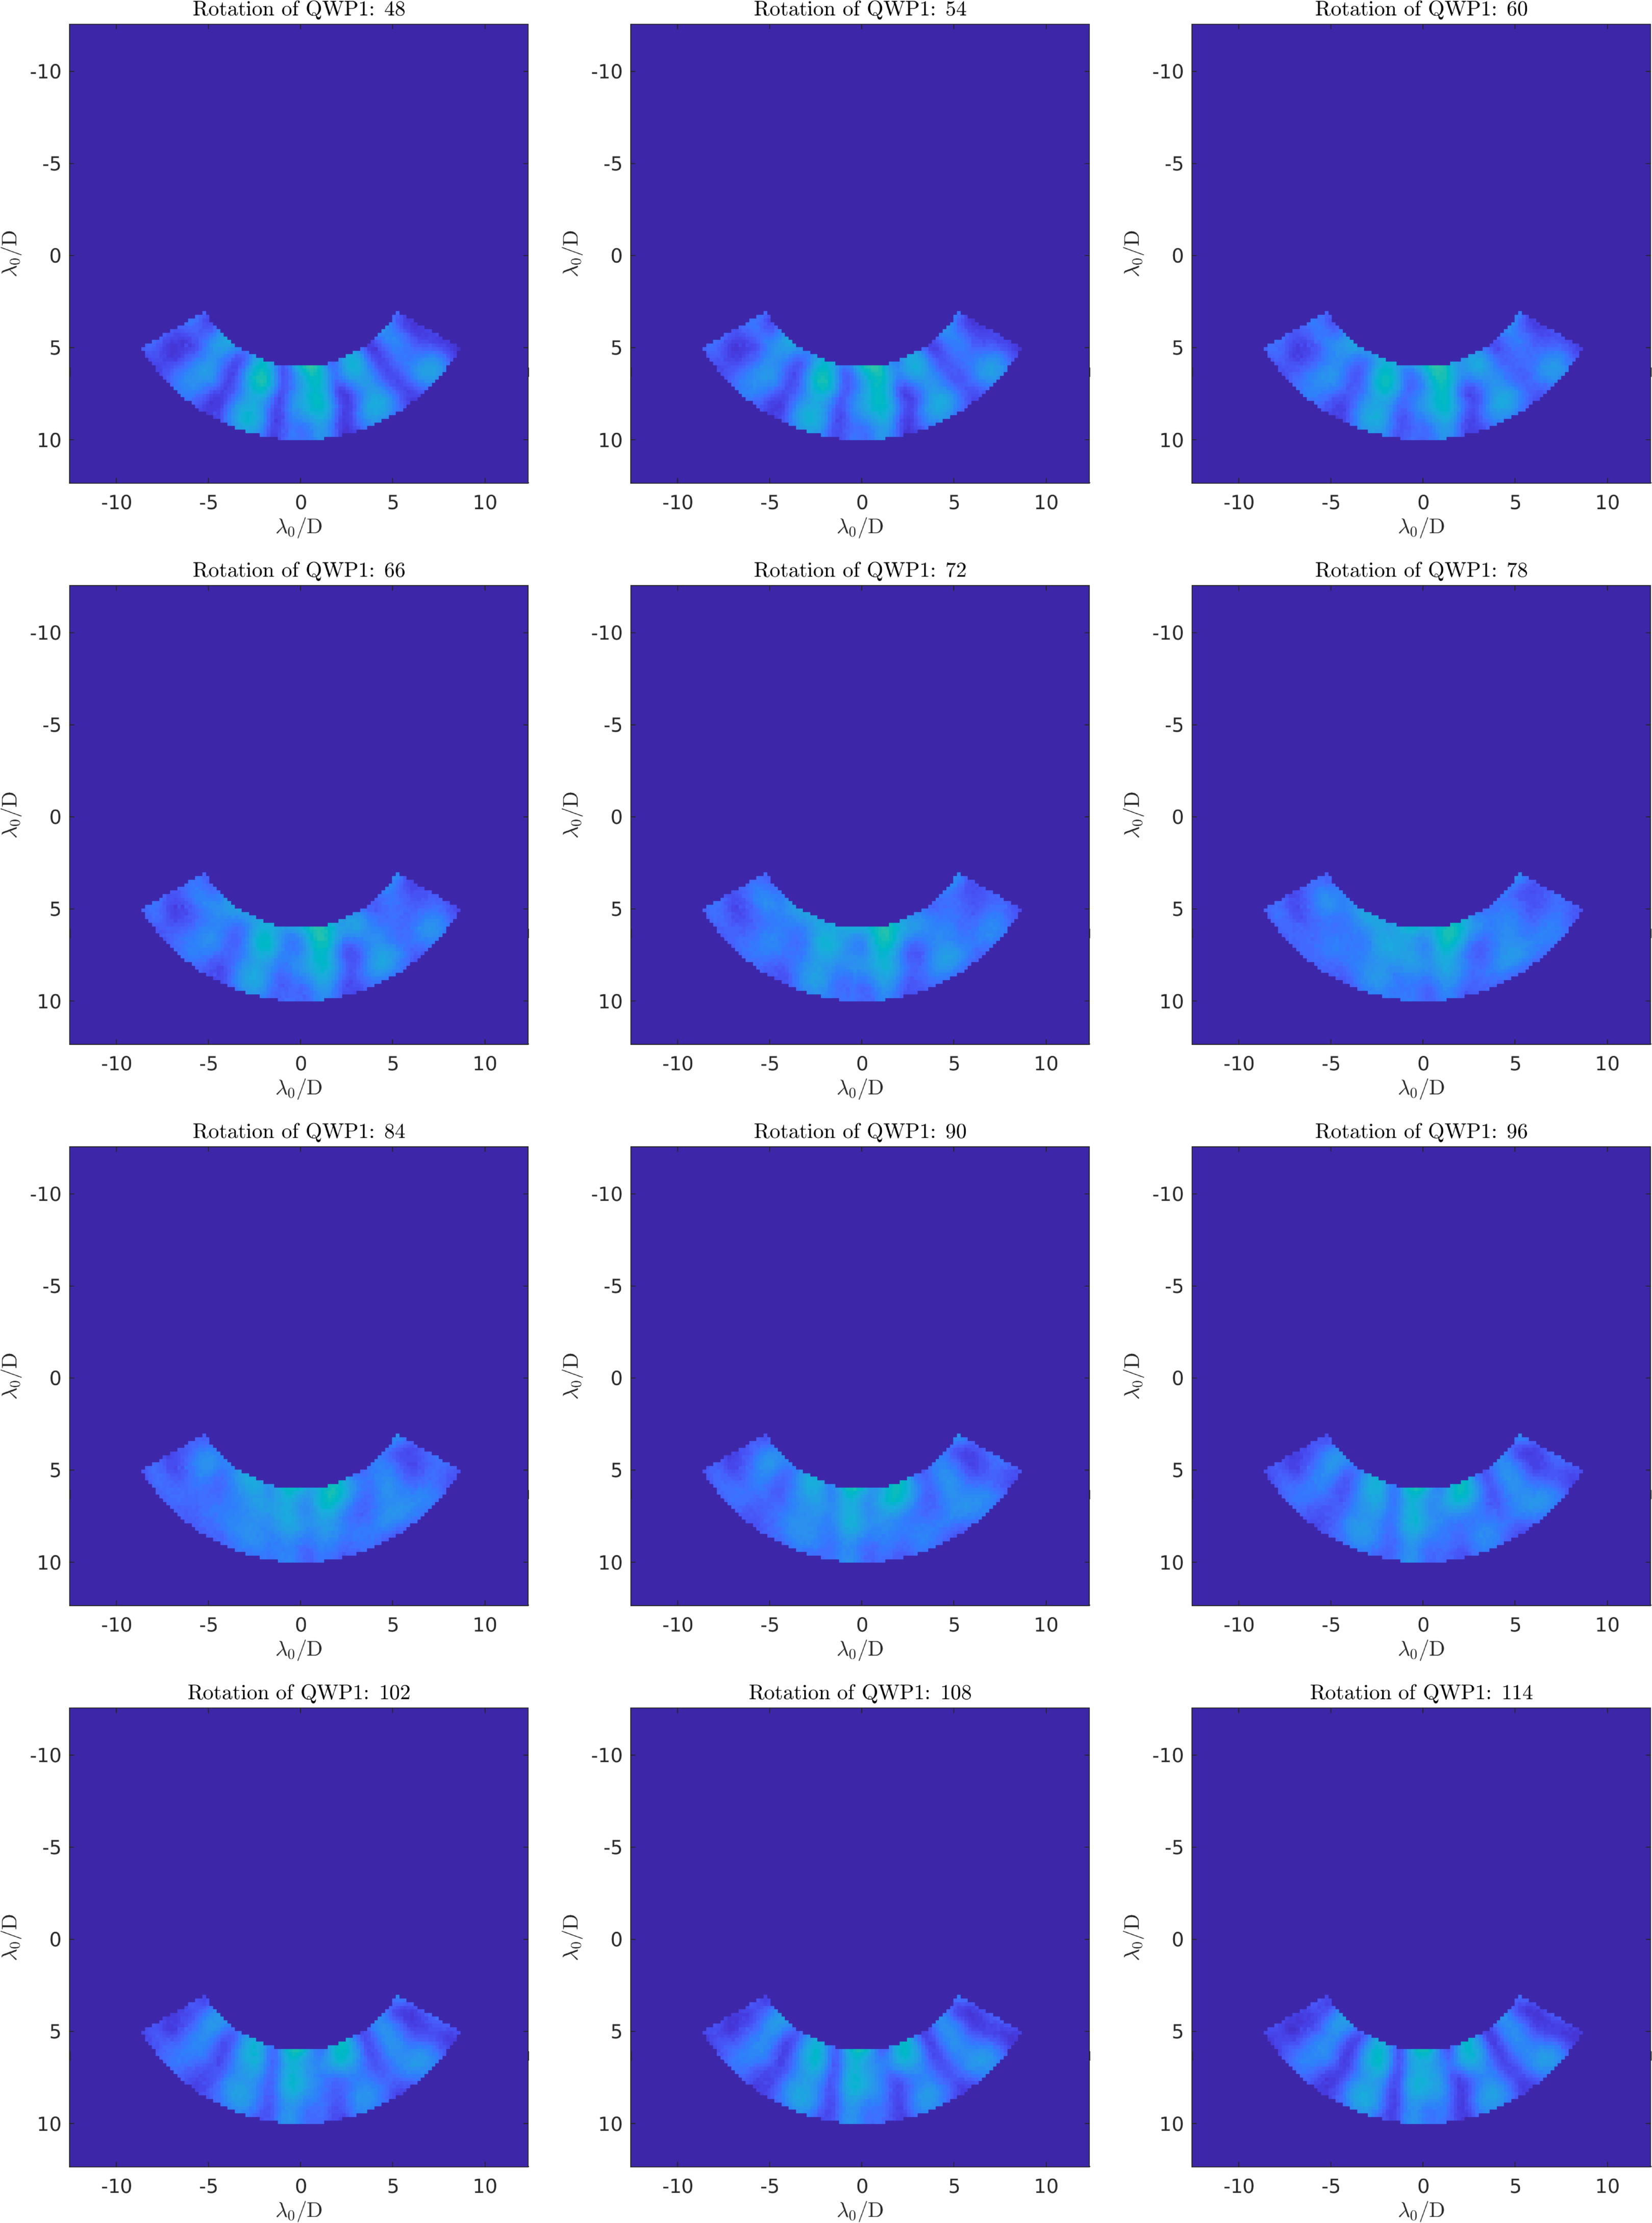
We implement the method described in Sec. 2.3 in HCST to achieve the proper polarization state. We rotate the circular polarizer quarter-wave plate at the entrance of the system (see Fig. 2) while we send a flat probe with the DM. We compute the intensity of the probe at the image plane to assess the azimuthal modulation and thus imply how far the polarization state at the focal plane mask is from being circular. To demonstrate this method, we rotate the polarizer quarter-wave plate for different configurations of the circular analyzer at the end of the setup. For each of these configurations we plot the standard deviation of the arc with the probe intensity versus the rotation of the polarizer quarter-wave plate. We show the curves in Fig. 3. In Fig. 4 we show several images for a set of rotations of the polarizer quarter-wave plate centered at the minimum modulation intensity rotation angle to illustrate how the modulation disappears near the desired polarization state.
 |
 |
We pick the polarizer quarter-wave plate that provides no azimuthal modulation, and we compute the contrast between the left and right circular polarizations; we achieve a polarization contrast of a factor of 5105 between both polarizations when the circular analyzer is cancelling the leakage term.
5 Conclusions
We present a new method to achieve the proper polarization state for a VVC that does not require the addition of extra optical elements or a polarimeter in the optical path. By sending flat probes with the DM and rotating the optics in the circular polarizer and circular analyzer we can unequivocally determine the polarization state in the system that ensures circular polarization immediately upstream of the focal plane mask. We show how this method works with results from HCST, where we have demonstrated very high contrast levels with the VVC. It is necessary to have the proper polarization state to achieve the raw contrast levels that the VVC promises. The polarization calibration method presented here is particularly relevant to future instruments that envision using the VVC at raw contrast levels of , such as the HabEx and LUVOIR-B mission concepts.
Acknowledgements.
The material is based upon work supported by NASA SAT under award No. 80NSSC20K0624. C. K. is supported by the Caltech WAVE program. J.L.-S. thanks Garreth Ruane for helpful discussions.References
- [1] Foo, G., Palacios, D. M., and Swartzlander, G. A., “Optical vortex coronagraph,” Opt. Lett. 30, 3308–3310 (2005).
- [2] Mawet, D., Riaud, P., Absil, O., and Surdej, J., “Annular Groove Phase Mask Coronagraph,” Astrophys. J. 633, 1191–1200 (2005).
- [3] Wang, J. J., Ginzburg, S., Ren, B., Wallack, N., Gao, P., Mawet, D., Bond, C. Z., Cetre, S., Wizinowich, P., De Rosa, R. J., Ruane, G., Liu, M. C., Absil, O., Alvarez, C., Baranec, C., Choquet, É., Chun, M., Defrère, D., Delorme, J.-R., Duchêne, G., Forsberg, P., Ghez, A., Guyon, O., Hall, D. N. B., Huby, E., Jolivet, A., Jensen-Clem, R., Jovanovic, N., Karlsson, M., Lilley, S., Matthews, K., Ménard, F., Meshkat, T., Millar-Blanchaer, M., Ngo, H., Orban de Xivry, G., Pinte, C., Ragland, S., Serabyn, E., Catalán, E. V., Wang, J., Wetherell, E., Williams, J. P., Ygouf, M., and Zuckerman, B., “Keck/NIRC2 L’-band Imaging of Jovian-mass Accreting Protoplanets around PDS 70,” AJ 159, 263 (June 2020).
- [4] Wagner, K., Ertel, S., Stone, J., Leisenring, J., Apai, D., Kasper, M., Absil, O., Close, L., Defrère, D., Guyon, O., and Males, J., “Imaging low-mass planets within the habitable zones of nearby stars with ground-based mid-infrared imaging,” arXiv e-prints , arXiv:2107.14378 (July 2021).
- [5] Llop-Sayson, J., Wang, J. J., Ruffio, J.-B., Mawet, D., Blunt, S., Absil, O., Bond, C., Brinkman, C., Bowler, B. P., Bottom, M., Chontos, A., Dalba, P. A., Fulton, B. J., Giacalone, S., Hill, M., Hirsch, L. A., Howard, A. W., Isaacson, H., Karlsson, M., Lubin, J., Madurowicz, A., Matthews, K., Morris, E., Perrin, M., Ren, B., Rice, M., Rosenthal, L. J., Ruane, G., Rubenzahl, R., Sun, H., Wallack, N., Xuan, J. W., and Ygouf, M., “Constraining the Orbit and Mass of Eridani b with Radial Velocities, Hipparcos IAD-Gaia Astrometry, and Multi-epoch Vortex Coronagraphy Upper Limits,” arXiv e-prints , arXiv:2108.02305 (Aug. 2021).
- [6] Ruane, G., Mawet, D., Jewell, J., and Shaklan, S., “Performance and sensitivity of vortex coronagraphs on segmented space telescopes,” in [Society of Photo-Optical Instrumentation Engineers (SPIE) Conference Series ], Society of Photo-Optical Instrumentation Engineers (SPIE) Conference Series 10400, 104000J (Sept. 2017).
- [7] Ruane, G., Mawet, D., Mennesson, B., Jewell, J., and Shaklan, S., “Vortex coronagraphs for the Habitable Exoplanet Imaging Mission concept: theoretical performance and telescope requirements,” Journal of Astronomical Telescopes, Instruments, and Systems 4, 015004 (Jan. 2018).
- [8] The HabEx Team, “The HabEx Final Report.” https://www.jpl.nasa.gov/habex/pdf/HabEx-Final-Report-Public-Release-LINKED-0924.pdf (2019).
- [9] The LUVOIR Team, “The Large UV Optical Infrared Surveyor (LUVOIR) final report.” https://asd.gsfc.nasa.gov/luvoir/resources/docs/LUVOIR_FinalReport_2019-08-26.pdf (2019).
- [10] Mawet, D., Serabyn, E., Liewer, K., Burruss, R., Hickey, J., and Shemo, D., “THE VECTOR VORTEX CORONAGRAPH: LABORATORY RESULTS AND FIRST LIGHT AT PALOMAR OBSERVATORY,” The Astrophysical Journal 709, 53–57 (dec 2009).
- [11] Mawet, D., Serabyn, E., Liewer, K., Hanot, C., McEldowney, S., Shemo, D., and O’Brien, N., “Optical vectorial vortex coronagraphs using liquid crystal polymers: theory, manufacturing and laboratory demonstration,” Opt. Express 17, 1902–1918 (Feb 2009).
- [12] Mawet, D., Riaud, P., Surdej, J., and Baudrand, J., “Subwavelength surface-relief gratings for stellar coronagraphy,” AO 44, 7313–7321 (Dec. 2005).
- [13] Vargas Catalán, E., Huby, E., Forsberg, P., Jolivet, A., Baudoz, P., Carlomagno, B., Delacroix, C., Habraken, S., Mawet, D., Surdej, J., Absil, O., and Karlsson, M., “Optimizing the subwavelength grating of L-band annular groove phase masks for high coronagraphic performance,” Astronomy and Astrophysics 595, A127 (Nov. 2016).
- [14] Murakami, N., Hamaguchi, S., Sakamoto, M., Fukumoto, R., Ise, A., Oka, K., Baba, N., and Tamura, M., “Design and laboratory demonstration of an achromatic vector vortex coronagraph,” Opt. Express 21, 7400–7410 (Mar 2013).
- [15] Ruane, G., Serabyn, E., Mejia Prada, C., Baxter, W., Bendek, E., Mawet, D., and Riggs, A. J. E., “Experimental analysis of the achromatic performance of a vector vortex coronagraph,” in [Society of Photo-Optical Instrumentation Engineers (SPIE) Conference Series ], Society of Photo-Optical Instrumentation Engineers (SPIE) Conference Series 11443, 114432O (Dec. 2020).
- [16] Mudge, J., Johnson, B., and Ogden, C., “Polarization considerations for long baseline interferometry,” in [Optical and Infrared Interferometry IV ], Rajagopal, J. K., Creech-Eakman, M. J., and Malbet, F., eds., Society of Photo-Optical Instrumentation Engineers (SPIE) Conference Series 9146, 91460R (July 2014).
- [17] Breckinridge, J. B., Lam, W. S. T., and Chipman, R. A., “Polarization aberrations in astronomical telescopes: The point spread function,” Publications of the Astronomical Society of the Pacific 127, 445–468 (may 2015).
- [18] Ruane, G., Mawet, D., Delorme, J.-R., Jovanovic, N., Echeverri, D., Llop-Sayson, J. D., Zhang, M. R., Riggs, A. J. E., Shaklan, S., Serabyn, E., and Wallace, J. K., “Laboratory testing of coronagraphs for future space telescopes on the Caltech high contrast spectroscopy testbed for segmented telescopes (HCST) (Conference Presentation),” in [Space Telescopes and Instrumentation 2018: Optical, Infrared, and Millimeter Wave ], Lystrup, M., MacEwen, H. A., Fazio, G. G., Batalha, N., Siegler, N., and Tong, E. C., eds., 10698, International Society for Optics and Photonics, SPIE (2018).
- [19] Give’On, A., “A unified formailism for high contrast imaging correction algorithms,” Proc. SPIE 7440, 74400D (2009).
- [20] Llop-Sayson, J., Ruane, G., Jovanovic, N., Mawet, D., Echeverri, D., Riggs, A. J. E., Coker, C. T., Morrissey, G., and Sun, H., “The high-contrast spectroscopy testbed for segmented telescopes (hcst): new wavefront control demonstrations,” (2019).
- [21] Llop-Sayson, J., Ruane, G., Mawet, D., Jovanovic, N., Coker, C. T., Delorme, J.-R., Echeverri, D., Fucik, J., Riggs, A. J. E., and Wallace, J. K., “High-contrast demonstration of an apodized vortex coronagraph,” The Astronomical Journal 159, 79 (feb 2020).
- [22] Llop-Sayson, J., Jovanovic, N., Morrissey, G., Echeverri, D., and Mawet, D., “Wavefront control experiments with a single mode fiber at the High-Contrast Spectroscopy Testbed for Segmented Telescopes (HCST),” in [Space Telescopes and Instrumentation 2020: Optical, Infrared, and Millimeter Wave ], Lystrup, M., Perrin, M. D., Batalha, N., Siegler, N., and Tong, E. C., eds., 11443, 517 – 523, International Society for Optics and Photonics, SPIE (2020).