11email: mark.gorski@chalmers.se 22institutetext: National Radio Astronomy Observatory, 520 Edgemont Road, Charlottesville, VA 22903-2475, USA 33institutetext: National Radio Astronomy Observatory, P.O. Box O, Socorro, NM 87801, USA 44institutetext: Sorbonne Université, UPMC Université Paris 6 & CNRS, UMR 7095, Institut d’Astrophysique de Paris, 98b boulevard Arago, 75014 Paris, France
Discovery of methanimine (CH2NH) megamasers toward compact obscured galaxy nuclei
We present the first search for the 5.29 GHz methanimine (CH2NH) transition toward a sample of galaxy nuclei. We target seven galaxies that host compact obscured nuclei (CONs) with the Karl G. Jansky Very Large Array. These galaxies are characterized by Compton-thick cores. CH2NH emission is detected toward six CONs. The brightness temperatures measured toward Arp 220 indicate maser emission. Isotropic luminosities of the CH2NH transition, from all sources where it is detected, exceed 1 L⊙ and thus may be considered megamasers. We also detect formaldehyde (H2CO) emission toward three CONs. The isotropic CH2NH luminosities are weakly correlated with the infrared luminosity of the host galaxy and strongly correlated with OH megamaser luminosities from the same galaxies. Non-local thermodynamic equilibrium radiative transfer models suggest that the maser is pumped by the intense millimeter-to-submillimeter Our study suggests that CH2NH megamasers are linked to the nuclear processes within 100 pc of the Compton-thick nucleus within CONs.
Key Words.:
Masers, Galaxies: ISM, Galaxies: nuclei, Radio lines: galaxies1 Introduction
Interstellar methanimine (CH2NH) was first detected toward Sagittarius B2 (Sgr-B2) and is the simplest molecule to contain the carbon nitrogen double bond (Godfrey et al. 1973). The first CH2NH maser emission was later discovered in Sgr-B2 by Faure et al. (2018). Methanimine is the simplest of the “imines,” which are precursors to amino acids (Danger et al. 2011), and thus an important tracer of prebiotic chemistry in the universe. We report the discovery of the first CH2NH megamaser and provide evidence for more CH2NH masers toward compact obscured nuclei (CONs).
CH2NH has been detected in both extragalactic and Galactic environments. The first extragalactic detection of CH2NH was toward Arp 220 with the Arecibo radio telescope (Salter et al. 2008). The line was observed in emission and hypothesized to be a maser. A maser is a source of stimulated emission. It was also identified by Martín et al. (2006) in NGC 253 and in absorption toward PKS 1830-211 (Muller et al. 2011). In the Milky Way, CH2NH has been detected toward the Galactic center (Godfrey et al. 1973; Turner 1991) with abundance enhancements toward high-mass star forming regions (Dickens et al. 1997).
Compact obscured nuclei are galaxies that host dusty and optically thick galactic centers (e.g., Sakamoto et al. 2010; González-Alfonso et al. 2012; Aalto et al. 2015b; Falstad et al. 2019, 2021). Radiation at X-ray to millimeter wavelengths is strongly attenuated in these regions, where molecular gas column densities exceed cm-2 (e.g., Treister et al. 2010; Roche et al. 2015; Aalto et al. 2015a, 2019) and dust temperatures are K (e.g., Sakamoto et al. 2013; Aalto et al. 2015a, b, 2019). The frequency range from 5 to 80 GHz is the only frequency range where these nuclei may be optically thin (Barcos-Muñoz et al. 2015; Sakamoto et al. 2017; Barcos-Muñoz et al. 2018; Aalto et al. 2019). However, Martín et al. (2016) show that at the high frequency end of this spectral range, dust emission may still be opaque. For this reason, it is not known if an active galactic nucleus (AGN) or a nuclear starburst powers the extreme infrared luminosities ( L⊙) and outflows of these galaxies.
This paper presents a search for the 5.29 GHz CH2NH transition toward CONs. Aalto et al. (2015b) found CH2NH emission at millimeter wavelengths ( GHz) toward two CONs: IC 860 and Zw 049.057. They suggest that CH2NH may be an important tracer of the CON environment. Astrophysical masers are important probes of galaxy nuclei: for example OH (e.g., Henkel & Wilson 1990), H2CO (e.g., Baan et al. 2017), H2O (e.g., Herrnstein et al. 1999; Reid et al. 2009), and CH3OH (e.g., Chen et al. 2015). Studies of these masers reveal outflows (e.g., OH; Baan et al. 1989), molecular tori (e.g., Lonsdale et al. 1998), accretion disks of AGN (e.g., Reid et al. 2009), intense star formation (e.g., Hagiwara et al. 2001; Brunthaler et al. 2009; Gorski et al. 2019), and cloud-scale shocks (e.g., Ellingsen et al. 2017; Gorski et al. 2017, 2018). Because masers often trace specific conditions within the interstellar medium, finding new maser species may be critical to unveiling what is hidden behind the thick dust veils of CONs.
We report the detection of the 5.29 GHz CH2NH transition toward six galaxies: Arp 220, IC 860, Zw 049.057, IRAS 172080014, IRAS 175780400, and NGC 4418. Toward Arp 220 we provide clear evidence for a CH2NH megamaser.
| Project Code | Source | RA | Dec. | Complex Gain Calibrator | Channel Width | |
|---|---|---|---|---|---|---|
| (J2000) | (J2000) | (kHz) | ||||
| 20A-501 | Zw 049.057 | 15:13:13.10 | +07:13:32.0 | 0.0130 | J1504+1029 | 125 |
| 20A-501 | IRAS 172080014 | 17:23:21.95 | 00:17:00.9 | 0.0428 | J17430350 | 125 |
| 20A-501 | IRAS 175780400 | 18:00:31.85 | +23:30:10.5 | 0.0134 | J17430350 | 125 |
| 20A-501 | NGC 4418 | 12:26:54.62 | 00:52:39.4 | 0.0073 | J1224+0330 | 125 |
| 20A-501 | IRAS 224911808 | 22:51:49.31 | 17:52:24.0 | 0.0778 | J22461206 | 125 |
| 15A-398 | IC 860 | 13:15:03.53 | +24:37:07.9 | 0.0129 | J1504+1029 | 125 |
| 11A-231 | Arp 220 | 15:34:57.27 | +23:30:10.5 | 0.0181 | J1513+2338 | 250 |
| Source | Weighting | Molecule | Channel Width | RMS noise | Beam Dimensions | Position Angle |
|---|---|---|---|---|---|---|
| km s-1 | mJy beam-1 | |||||
| Zw 049.057 | 0.5 | CH2NH | 20 | 0.37 | 527397 | 49.94∘ |
| H2CO | 20 | 0.38 | 591419 | 51.6∘ | ||
| IRAS 172080014 | 0.5 | CH2NH | 100 | 0.25 | 504481 | 15.2∘ |
| H2CO | 100 | 0.24 | 487414 | 13.4∘ | ||
| IRAS 175780400 | 0.5 | CH2NH | 20 | 0.37 | 482356 | 6.5∘ |
| H2CO | 50 | 0.31 | 520398 | 7.6∘ | ||
| NGC 4418 | 0.5 | CH2NH | 50 | 0.48 | 206118 | 48.4∘ |
| H2CO | 50 | 0.49 | 232128 | 48.0∘ | ||
| IRAS 224911808 | 0.5 | CH2NH | 50 | 0.44 | 224119 | 21.5∘ |
| H2CO | 50 | 0.44 | 272138 | 22.4∘ | ||
| IC 860 | 0.5 | CH2NH | 66 | 0.23 | 042035 | 63.4∘ |
| H2CO | 66 | 0.22 | 043038 | 63.4∘ | ||
| Arp 220 | 0.5 | CH2NH | 18 | 0.19 | 036028 | 67.7∘ |
| Arp 220 | uniform | CH2NH | 18 | 0.33 | 032026 | 70.6∘ |
2 Observations
Zw 049.057, IRAS 172080014, and IRAS 175780400 were observed with the Karl G. Jansky Very Large Array (VLA) in C configuration, and NGC 4418 and IRAS 224911808 were observed in B configuration (Project Code 20A-501). Individual 128 MHz wide subbands were placed to target the 4.8 GHz H2CO, 5.29 GHz CH2NH, and 6.7 GHz CH3OH masers with 125 kHz wide channels. Arp 220 and IC 860 were both observed with the VLA in A configuration (project codes 11A-231 and 15A-398), with 250 kHz and 125 kHz wide channels, respectively.
The data were calibrated and imaged in the Common Astronomy Software Applications (CASA) package version 5.0.0 (McMullin et al. 2007). With two exceptions, 3C286 (flux density = 7.47 Jy at 5.1 GHz) was observed as the bandpass and flux density scale calibrator. For Arp 220, J1602+3326 was observed as the bandpass calibrator, and for IRAS 224911808 3C147 (flux density = 6.74 Jy at 5.5 GHz) was observed as the bandpass and flux density scale calibrator. The details of the observations are summarized in Table 1.
The final data cubes were produced using a Briggs robustness value of 0.5 in the CASA task tclean, except for Arp 220. For Arp 220 two data cubes were made, one with a Briggs robust value of 0.5 and one uniformly weighted for the smallest synthesized beam. The frequency axes were resampled to a velocity resolution of 18 km s-1to 100 km s-1and RMS values ranged from 0.19 mJy beam-1 to 0.49 mJy beam-1. All velocities are reported in the kinematic local standard of rest (LSRK) frame. Continuum subtraction was performed by selecting line-free channels and fitting with a polynomial of order 1 in the image domain. The continuum flux density at the line peak is determined by fitting a polynomial of order 1 to the entire 128 MHz subband. 5% of channels at the band edges, and suspected line containing channels, were ignored. The properties of each image cube are listed in Table 2.
3 Results
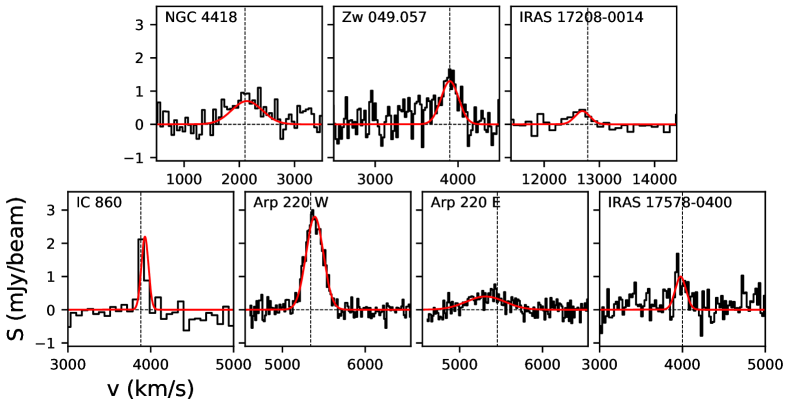
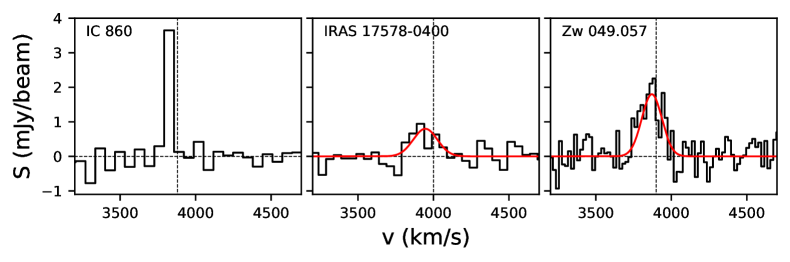
The 5.29 GHz CH2NH transition is detected in emission toward the nuclei of six galaxies: Arp 220, IC 860, Zw 049.057, IRAS 172080014, IRAS 175780400, and NGC 4418. In addition, we report a new detection of the 4.8 GHz formaldehyde (H2CO) transition toward IRAS 175780400. This increases the number of galaxies with known H2CO 4.8 GHz emission from five (UGC 5101, IC 860, Arp 220, NGC 3079, and Zw 049.057 Mangum et al. 2008, 2013) to six. In all observations the CH2NH and H2CO lines are spatially unresolved. For each galaxy the CH2NH and H2CO transitions were fit with a Gaussian profile. Table 3 presents the derived peak flux density (), continuum flux density at the line peak, velocity full width at half maximum (FWHM), center velocity, integrated flux density, and peak brightness temperature () of the CH2NH and the 4.8 GHz H2CO transition. Figure 1 shows the observed line profiles. For all galaxies the FWHM of the line is km s-1 except IC 860 where both the H2CO and CH2NH transitions are spectrally unresolved (FWHM km s-1). If we assume isotropic radiation and that the line width is nonrelativistic:
| (1) |
where is the rest frequency of the line, D is the luminosity distance to the object, and the integral is the integrated line flux density. The observed luminosity of an emission line is thus:
| (2) |
The luminosity of the CH2NH transition, in units common to observational extragalactic astronomy, is calculated as
| (3) |
and for formaldehyde as
| (4) |
The integral represents the integrated line flux density in units of Jy km s-1, and is the distance in megaparsecs. Distances are adopted from Sanders et al. (2003). We provide upper limits toward the galaxies where neither CH2NH nor H2CO was detected. Among the detected emission, CH2NH luminosity varies between 2.9 L⊙ and 27 L⊙ and the H2CO luminosity varies between 2.8 L⊙ and 5.3 L⊙.
| Source | Luminosity | ||||||
| [mJy] | [mJy] | [km s-1] | [km s-1] | [Jy km s-1] | [K] | [L⊙] | |
| CH2NH | |||||||
| Zw 049.057 | 29.550.06 | 1.250.19 | 23846 | 390119 | 0.310.05 | 2.610.40 | 6.220.99 |
| IRAS 172080014 | 55.140.18 | 0.440.13 | 375139 | 1269056 | 0.140.05 | 0.810.18 | 32.8110.01 |
| IRAS 175780400 | 31.850.05 | 0.900.21 | 15853 | 397719 | 0.150.03 | 2.290.53 | 3.040.70 |
| NGC 4418 | 22.940.08 | 0.780.13 | 689146 | 213856 | 0.570.10 | 14.022.34 | 3.500.60 |
| IRAS 224911808 | 3.220.04 | ¡1.32 | - | - | ¡0.066 | ¡19.7 | ¡39.30 |
| IC 860 | 22.240.03 | 2.20.23 | ¡68 | 398068 | 0.150.02 | 65769 | 2.880.38 |
| Arp 220 W | 84.000.19 | 2.810.07 | 2548 | 539028 | 0.740.02 | 121628 | 26.800.65 |
| Arp 220 E | 54.60.19 | 0.460.05 | 53570 | 534824 | 0.260.03 | 22922 | 9.470.99 |
| H2CO | |||||||
| Zw 049.057 | 31.090.09 | 1.790.22 | 16429 | 392112 | 0.310.04 | 3.740.47 | 6.280.94 |
| IRAS 172080014 | 58.010.16 | ¡1.23 | - | - | ¡0.031 | ¡3.19 | ¡5.19 |
| IRAS 175780400 | 34.100.10 | 0.770.18 | 17777 | 399832 | 0.150.04 | 1.950.46 | 5.451.98 |
| NGC 4418 | 24.820.08 | ¡1.47 | - | - | ¡0.074 | ¡26.07 | ¡0.41 |
| IRAS 224911808 | 3.400.02 | ¡1.32 | - | - | ¡0.066 | ¡18.5 | ¡35.81 |
| IC 860 | 22.790.16 | 3.70.20 | ¡66 | 385266 | 0.240.02 | 119171 | 4.290.35 |
4 Discussion
4.1 Evidence for maser emission
Toward all galaxies the CH2NH and H2CO transitions are spatially unresolved, and thus the brightness temperatures reported in this paper are lower limits. Even galaxies observed in the most extended configuration of the array, A configuration with synthesized beam dimensions 036028 (Table 2), are unresolved. In the case of Arp 220, the measured brightness temperature of CH2NH toward the western core is K in the Briggs weighted image cube. By uniformly weighting the visibilities the spatial resolution of the CH2NH image cube is improved to 032026 and the peak brightness temperature is measured to be 147068 K (3.20.3 mJy). Attempting to de-convolve the CH2NH source associated with the western nucleus of Arp 220 with the CASA task imfit, we found an unresolved source. The line emission in Arp 220 must be superthermal because its peak brightness temperature greatly exceeds the physical temperatures (gas kinetic and dust), K, derived for Arp 220 and other CONs (Sakamoto et al. 2010; Aalto et al. 2019; Zschaechner et al. 2016).
Furthermore, the physical temperatures toward CONs do not appear to exceed 300 K, for example in NGC 4418 (Sakamoto et al. 2010), IC 860 (Aalto et al. 2019), and Arp 220 (Zschaechner et al. 2016). High brightness temperatures measured toward IC 860 and Arp 220 can be attributed to maser emission; however, the remaining detections require higher angular resolution observations to confirm their masing nature. If the CH2NH emission traces the innermost region (¡50 pc) of the CONs, the brightness temperatures may be significantly higher. Aalto et al. (2015b, 2019) show that the lines of vibrationally excited HCN (HCN-VIB) toward CONs trace structures smaller than 02 (60pc). Costagliola et al. (2013) show that the CON of NGC 4418 has an angular diameter less than 03 (50 pc). Assuming the CONs are smaller than 50 pc and the CH2NH masers probe the CONs, then the brightness temperatures toward NGC 4418, Zw 49.057, IRAS 172080014, IC 860, and Arp 220 W would respectively be 380 K, 2000 K, 6700 K, 3400 K, and 7900 K. Thus, it is likely that the 5.29 GHz line is masing toward all the CONs we have observed.
The measured isotropic luminosity of the CH2NH line is L⊙ and L⊙ in all cases where it is detected. A megamaser is defined as 106 times as luminous as the average Milky Way maser of the same transition. For example the cutoff for H2O megamasers is 20 L⊙ (see Hagiwara et al. 2001 for a description of this nomenclature). The Milky Way detections of the 5.29 GHz CH2NH transition have luminosities of L⊙ and L⊙ (Faure et al. 2018) if one adopts a distance of 8.3 kpc (Reid et al. 2014). The least luminous detection in our study is toward IC 860, where the line luminosity is 2.88 L⊙, and the most luminous is toward the western core of Arp220, where the line luminosity is 26.8 L⊙. All the galaxies we have observed with detections of the CH2NH line qualify as megamasers assuming Sgr-B2 masers from Faure et al. (2018) represent the more luminous end of the distribution of Milky Way CH2NH masers.
4.2 Non-LTE modeling
Baan et al. (2017) show that population inversions of H2CO can be maintained by infrared pumping based on calculations with the nonlocal thermodynamic equilibrium (non-LTE) radiative transfer code RADEX (van der Tak et al. 2007). Such models of maser emission based on a simple escape probability approximation can be reliable until the maser saturates at optical depths . However, Baan et al. (2017) did not discuss whether the luminosity implied by their assumed blackbody continuum at K was consistent with the observed infrared emission on the same small angular scale, nor did they include the near- and mid-infrared radiation that is known to be present in galaxies’ luminous CONs, and that must also excite vibrational transitions in molecules such as H2CO and CH2NH. Faure et al. (2018) recently investigated the CH2NH maser emission in the Galactic-center molecular cloud complex Sgr B2. To do this, they computed rate coefficients for collisional excitation of CH2NH by para-H2 for the 15 lowest rotational levels of methanimine at temperatures up to 30 K. However, their RADEX analysis of the methanimine emission apparently omitted the infrared continuum radiation of the source and ignored radiative excitation processes except for the 2.7 K cosmic background radiation. Faure et al. (2018) did demonstrate a robust population inversion with excitation temperature in the transition at kinetic temperature K and density of para hydrogen cm-3.
The physical conditions in CONs of galaxies may be more extreme than those explored in previous analyses of centimeter-wave masers in H2CO and CH2NH. Not only are the temperatures and densities higher than K and cm-3, respectively, but the continuous radiation from centimeter wavelengths to the near-infrared filling these regions is extremely intense (cf. Sakamoto et al. 2013, Aalto et al. 2015a, Aalto et al. 2015b, Gorski et al. 2018, Mangum et al. 2019). To explore the excitation of weak maser emission in such regions, we calculated non-LTE radiative transfer models with a code that fully incorporates all the features originally intended for RADEX as described by van der Tak et al. (2007). The new code, GROSBETA, retains the simplified mean-escape probability treatment of radiative transfer but allows for arbitrary continuum spectral energy distributions, incorporates chemical formation-pumping where appropriate, and solves for many different molecules in the same computation. Tabone et al. (2021) describe the code and its application to superthermal OH emission. In order to illustrate the full range of radiative effects on the excitation of a molecule such as methanimine, we expanded the spectroscopic data files to include all fundamental vibrational transitions and explored a range of plausible infrared continua (see the appendices). The non-LTE computation solves for the steady-state density in each vibration-rotation level of a molecule subject to collisional excitation at kinetic temperature and number densities of the main collision partners, for example . The other input parameters are the internal brightness of continuum radiation with dimensions [Jy sr-1], the path length through the source , and the molecular column density [cm-2] over the FWHM of the line-of-sight velocity distribution, [km s-1]. The effective solid angle of the source is , where is the luminosity distance. The observable flux in a line is given by
| (5) |
where is the surface brightness of the continuum in the core, is the Planck function evaluated at the excitation temperature of the line, and is the optical depth in the line. The first term represents the amplification (absorption) of the continuum radiation when the optical depth is negative (positive) and the second term is the self-emission of the molecular source.
We take the formaldehyde and methanimine maser emission in IC 860 as a test case. A crucial part of the non-LTE excitation calculation is the specification of the internal radiation field. For IC 860 we adopt observed fluxes as collected in the NASA/IPAC Extragalactic Database (NED)222https://ned.ipac.caltech.edu/, NED is funded by the US National Aeronautics and Space Administration and operated by the California Institute of Technology.. The observed flux densities from meter to centimeter wavelengths are well-fitted by a flat power law spectrum, ; therefore, we assume that the power-law component is very compact and contained entirely within the arcsecond projected beam area of the VLA observations presented here. The corresponding solid angle is sr. Most of the power in the observed spectrum of IC 860 is contained in the submillimeter and infrared region (frequencies to Hz). The integrated flux density over this frequency interval, 7.1 W m-2, corresponds to a luminosity of L⊙. The observed power is thought to be short-wavelength (visible, ultraviolet, X-ray) light from a central starburst and/or AGN that has been absorbed and reradiated by surrounding dust. Owing to the lack of far-infrared measurements at sub-arcsecond resolution, we do not know what fraction of the observed infrared power, , is contained within the solid angle of the centimeter-wave radio source. However, the molecules within pc of the center of IC 860 must be exposed to a mean brightness given by
| (6) |
where is the extinction in magnitudes for a standard interstellar extinction law, normalized to visual (550 nm wavelength) extinction mag. Including the extinction ensures that the power-law component does not exceed the observed central infrared radiation. The model radiation field is presented in Appendix A.2. It can be useful to define the equivalent radiation brightness temperature such that the mean internal brightness is
| (7) |
together with a function
| (8) |
For any transition at frequency with spontaneous transition probability from upper state of statistical weight to lower state with statistical weight , the rate of stimulated emission in this radiation field is , while the rate of absorption is . For example, the CH2NH transition at 5.29 GHz has s-1, while the value of K in the power-law component of the internal radiation field, so that and the pumping rate s-1. Examples of pumping rates for two values of and are listed for a number of transitions in Table 8. This shows that induced absorption out of , the upper level of the 5.29 GHz transition, is faster than spontaneous decay at 5.29 GHz for various rotational and vibration-rotation transitions at frequencies between 133 GHz and 50 THz. The highest pumping rates occur in the millimeter-to-submillimeter wavelength part of the spectrum. In the adopted radiation field, the vibration-rotation transitions in the infrared are not very important in the excitation of the and levels. Comparison of the rates also suggests why the centimeter-wave continuum enters the interpretation in two distinct ways: (1) the internal radiation (Eq. 6) felt by the molecules is so strong that stimulated emission in the 5.29 GHz transition is much faster than spontaneous emission, and (2) the observable continuum emission is strong and must be taken into account in description of the line emission (Eq. 5). Finally, it is useful to compare collisional de-excitation rates with the induced radiative rates. The level has a total spontaneous decay rate of s-1 mostly in the 166.85 GHz transition. The few collision rates presented by Faure et al. (2018) suggest downward collisional rate coefficients from on the order of cm3 s-1; therefore, in the absence of any radiative couplings to higher states, collisions could dominate the excitation of at densities rather greater than cm-3. With a realistic description of the radiation environment, on the other hand, we see that radiative pumping out of occurs with a rate on the order of s-1. Thus, collisions are unlikely to thermalize the populations of low-excitation levels such as unless the hydrogen density exceeds cm-3, although collisions can suppress the population inversion at lower densities, on the order of cm-3.
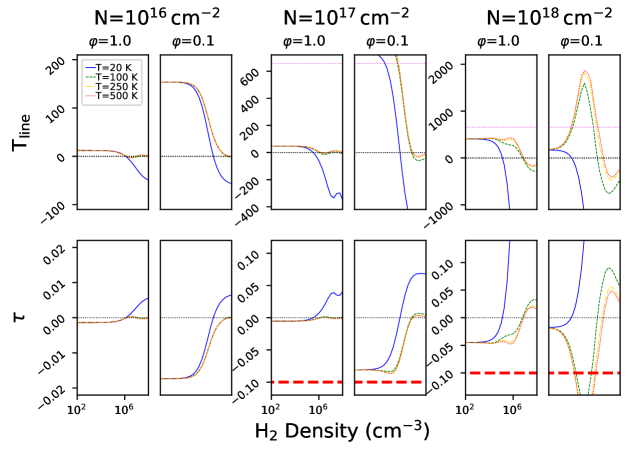
The non-LTE treatment of excitation and radiative transfer includes all processes, such as those outlined in the preceding paragraph. Thus we can see what parameter space allows for a CH2NH maser of the observed intensity in IC 860. The results of these models are shown in Fig. 3. The models that reproduce the observed line brightness temperature, K, have total densities in the range to cm-3. The solutions are insensitive to kinetic temperature, which reflects the dominance of radiative pumping in the excitation. Large column densities and abundances are needed to reproduce the line intensity when . At lower values (e.g., ), the required column density of CH2NH is much lower, cm-2, so that the required abundance varies inversely with the hydrogen density. Population inversion and weak amplification () is maintained over a wide extent of parameter-space, producing line strengths of K, without any need for delicate tuning of density or abundance.
It should be possible to constrain the value of with further observations at millimeter-to-submillimeter wavelengths, both in lines and continuum, with sub-arcsecond angular resolution. For example, the model predicts that the transition at 35.055 GHz will also be a maser under the same conditions that explain the 5.29 GHz line intensity, but with K, 100 K, and 25 K at , and , respectively. Numerous CH2NH transitions at frequencies 200 to 300 GHz are predicted to appear strongly in emission at , but to go into absorption with when . In particular, the predicted flux ratio of the transition (frequency GHz, excitation energy K) and the transition (at GHz with K) is when , but becomes negative when the radiation scaling falls to . These numbers refer to fluxes measured in the same effective solid angle as the centimeter-wave masers, .
In summary, panchromatic, non-LTE radiative transfer models of both CH2NH reproduce the observed fluxes of centimeter-wave maser emission at 04 angular resolution in IC 860. The population inversions and amplification are robust over a range of densities and temperatures. The compact, intense centimeter-wave continuum emission plays a major role both in the excitation of the masering levels and as the background flux that is amplified in the lines. The molecular excitation may be dominated by radiative processes over the entire parameter space that sustains the required population inversions in both CH2NH and H2CO. The models predict fluxes of additional strong lines at mm wavelengths, which could be used to constrain better the density and abundances.
4.3 Comparing CH2NH masers in CONs with other maser species
4.3.1 H2O masers
The seven galaxies reported in this paper are all classified as CONs, and CH2NH emission is detected toward six of these galaxies. Surveys for megamasers in AGN have low success rates, such as Sato et al. (2005), where 90 Seyfert 2 or LINER galaxies were surveyed resulting in a single H2O megamaser detection. Of the galaxies surveyed for H2O megamasers, 178 have clear detections (Braatz et al. 2018). Often the detection rate is on the order of 1% (e.g., Sato et al. 2005; Bennert et al. 2009; Braatz et al. 2018). The H2O megamaser detection rate toward Compton-thick AGN is much greater (Castangia et al. 2019). While the sample size is small, the CH2NH detection rate is similar toward CONs, . The detection rates of megamasers toward CONs suggests that megamasers may be an indicator of Compton-thick environments; however, a comparison of CH2NH emission in a sample of non-Compton-thick galaxies is needed to correctly test this.
The link between the growth of supermassive black holes and megamasers is well established (e.g., Reid et al. 2009). 22 GHz H2O maser structure has been observed in the accretion disks, jets, and outflows of AGN (e.g., Henkel et al. 2005). Compact OH megamasers trace molecular tori around AGN (e.g., Lonsdale et al. 1998). The spectrum of the CH2NH megamaser does not yet show extreme velocity components ( km s-1) similar to the disk 22 GHz H2O megamasers. The CH2NH megamasers seem to have more in common with masers observed toward starbursts, jets, or outflows (e.g., Peck et al. 2003; Kondratko et al. 2005; König et al. 2017). The CH2NH line width in all cases is km s-1 except for IC 860. The unresolved CH2NH megamaser in Arp 220 implies the source is pc in diameter (032 adopting a distance of 81.8 Mpc) and in IC 860 the source is pc (035 adopting a distance of 59.1 Mpc). toward both the eastern and western nuclei of Arp 220, which have respective velocities of 5454 km s-1 and 5342 km s-1 (Martín et al. 2016), the CH2NH line is blue shifted by km s-1. However, these properties are not unique to AGN, unlike extreme velocity components, and may also result from nuclear starbursts (e.g., Brunthaler et al. 2009; König et al. 2017; Gorski et al. 2019)
4.3.2 36 GHz CH3OH masers
Suzuki et al. (2016) hypothesize that CH2NH may be abundant toward class I CH3OH maser sources because both molecules can be formed by hydrogenation of molecules on grain surfaces. CH2NH can be formed by hydrogenation of HCN (Theule et al. 2011) and CH3OH by hydrogenation of CO. Suzuki et al. (2016) target 12 high-mass star forming regions and two low-mass star forming regions known to have Class I CH3OH masers. CH3OH masers are divided into two subclasses depending on their pumping scheme. Class I CH3OH masers are pumped via collisions and class II CH3OH masers are radiatively pumped (Menten 1991). CH2NH was detected toward eight of the high-mass star forming regions with a fractional abundance in the range of to . The existence of hyper-compact HII regions and weak H54, or lack thereof, points to an early stage of high-mass star formation. Sources with evolved HII regions show less abundance of CH2NH. It is suggested from the results of that large CH2NH abundances are related to high-mass star formation, and the presence of class I CH3OH masers.
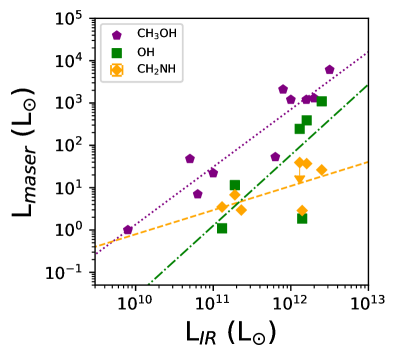
Since CH2NH abundance and class I CH3OH masers are likely related, we compare extragalactic CH3OH masers with CH2NH masers. Figure 4 shows the infrared luminosity, LIR, (Sanders et al. 2003) plotted against luminosities of the 36 GHz CH3OH maser (Chen et al. 2016) and 5.29 GHz CH2NH maser (this paper) for all presently known extragalactic sources. No galaxies have yet been observed in both lines besides Arp 220. Chen et al. (2016) note a strong correlation of the 36 GHz CH3OH maser and infrared luminosity (R=0.92): The strong correlation with the infrared luminosity of the galaxy suggests that the 36 GHz CH3OH maser is related to star formation processes. However, when corrected for Malmquist bias the — relation is shallower with a slope of . Indeed, when the 36 GHz maser is observed with sufficient angular resolution to be spatially resolved toward star forming galaxies, the maser reveals large-scale shocks ( pc; e.g., Gorski et al. 2017, 2018, 2019) potentially indicating cloud-cloud collisions. If the 5.29 GHz CH2NH is linked to class I CH3OH masers then a similar tight relationship with the infrared luminosity of the galaxy may be observed. We find a weak correlation (Fig. 4; R=0.78) with the infrared luminosity of the galaxy:
| (9) |
The CH2NH maser appears less strongly correlated with the infrared luminosity of the host galaxy. This may be a result of having a small sample of galaxies or that the CH2NH maser traces a different physical process than 36 GHz CH3OH masers.
4.3.3 OH masers
The CH2NH maser is emitted from a region smaller than 103 pc and 100 pc respectively toward Arp 220 and IC 860. OH megamasers are also known to trace the dense molecular environment around CONs. Momjian et al. (2006), Pihlström et al. (2001) and Lonsdale et al. (1998) show, with Very Long Baseline Interferometry (VLBI) observations, complicated structures in Arp220, IRAS 172080014, and III Zw 35 traced by OH masers. The OH masers trace material near the sphere of influence of the supermassive black hole (e.g., pc Onishi et al. 2017). A strong correlation between OH and CH2NH masers may indicate the CH2NH maser is tracing the feedback resulting from within the CON.
For the CONs we find that the OH maser luminosity scales with infrared luminosity by (Fig. 4; R=0.84):
| (10) |
The luminosities for our sample of CONs of OH megamasers are adopted from Wiggins et al. (2016) except for IRAS 224911808, which is adopted from Darling & Giovanelli (2002), and IRAS 175780400, for which an OH detection is absent in the literature. This is consistent with the relationship found by surveys of IRAS galaxies by Kandalian (1996); Darling & Giovanelli (2002).
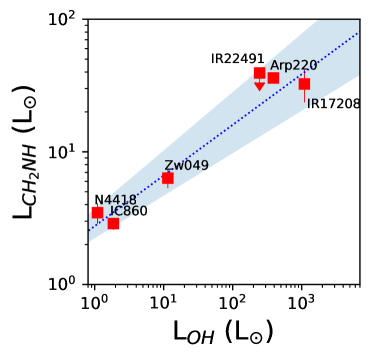
We find a strong correlation between the 5.29 GHz CH2NH and OH maser luminosities (Fig. 5; R=0.97),
| (11) |
toward Arp 220 (Lonsdale et al. 1998) compact (1 pc) and diffuse OH maser emission is revealed. The compact OH maser regions appear to be pumped by collisions, whereas the diffuse masers are pumped via infrared radiation, though Pihlström et al. (2001) and Parra et al. (2005) argue that the observed differences in the line ratios between compact and diffuse phases could be a natural property of one phase characterized by clumpy unsaturated masers. The strong correlation between OH and CH2NH maser luminosities, and the spatial coincidence within parsecs, suggests they trace similar processes in the CONs. The critical density of the upper 110 state of CH2NH is estimated as cm-3 (Faure et al. 2018), whereas OH mases at densities an order of magnitude lower cm-3 (Baan 1991). Consequently, the CH2NH maser may trace denser structures in CONs. Parsec scale resolution observations of the CH2NH maser may provide insights to the nature of these massive structures.
4.4 Maser luminosity and infrared relationship
We found that the CH2NH maser is weakly correlated with the infrared luminosity of the host galaxy. Usually, the luminosity of a radiatively pumped maser is proportional to the availability of pumping photons and stimulating photons, for example (Baan et al. 1989). However, one can, perhaps naively, assume that for a low-gain maser pumped by the infrared radiation field, that is stimulated by the radio continuum and unsaturated, the luminosity of the maser is proportional to the square of the infrared luminosity (e.g., ). This is because the stimulating photons from the radio continuum are proportional to the infrared flux. Saturated masers no longer grow in luminosity exponentially, so the luminosity of the maser will be proportional to the infrared luminosity (e.g., ). Thus, for an unspecified number of radiatively pumped masers, we expect the luminosity of the maser to be proportional to where has a value between 1 and 2 (see Sect. 5.4 of Darling & Giovanelli 2002 and references therein for a more detailed discussion). We observe that the CH2NH masers are under luminous for infrared pumping in this scenario with .We can imagine a few scenarios that might explain this situation.
First, the maser may still be radiatively pumped, but at millimeter-to-submillimeter wavelengths. A lack of infrared pumping is plausible, as much of the mid-infrared is attenuated and reemitted at longer wavelengths (Aalto et al. 2015a, 2019). Thus giving rise to a weaker correlation between the maser and the infrared luminosity of the galaxy. Our models show that pumping mainly occurs from the intense radiation at millimeter-to-submillimeter wavelengths, supporting this scenario.
Second, the CH2NH maser is not subject to the total infrared radiation field, but still radiatively pumped. Perhaps the regions responsible for the CH2NH maser are shielded from the intense radiation from the CON environment, and they are pumped by a more local source such as a nearby star-forming region. As these regions also excite OH masers this gives rise to the strong correlation between CH2NH and OH masers. In this scenario CH2NH absorption lines would likely be observable in the mid-infrared.
Last, the CH2NH molecules do not experience the radiation field and the maser is collisionally pumped. The radiation field is either too heavily shielded or too dilute to pump the molecules. The CH2NH maser is then related to the same physical process as the collisionally pumped OH masers yielding a strong correlation. Lonsdale et al. (1998) suggesting that shock fronts from molecular tori around newly formed AGN could result in these spectrally broad features.
5 Conclusions
We have conducted the first search for the 5.29 GHz CH2NH transition in a sample of galaxy nuclei using the VLA. CH2NH emission is detected toward six out of seven galaxies with CONs: Zw 049.057, IRAS 172080014 IRAS 175780400, NGC 4418, IC 860, and Arp 220. H2CO emission is also detected toward three galaxies: Zw 049.057, IRAS 175780400, and IC 860. In all observations, the emission is spatially unresolved.
The CH2NH emission detected toward the western core of Arp 220 has an isotropic luminosity of 27 L⊙ and a brightness temperature K, providing evidence for the first CH2NH megamasers. The isotropic luminosities measured toward the other galaxies range from 210 L⊙; however, the spatial resolution of the observations only allows for lower limits of the brightness temperature. Non-LTE modeling suggests that the CH2NH maser is pumped by the intense millimeter-to-submillimeter radiation field, though pumping from collisions cannot be excluded. Currently, the structure is measured to be smaller than 103 pc toward Arp 220 and smaller than 100 pc toward IC 860, which is consistent with the HCN-VIB emitting regions of CONs (60 pc Aalto et al. 2015b, 2019).
Our investigation reveals that the CH2NH masers are weakly correlated with the infrared luminosity of the galaxy and strongly correlated with OH megamaser luminosities. We hypothesize that the strong correlation between CH2NH masers and OH masers is due to collisions in the molecular tori around embedded AGN, although other explanations are possible. In this picture, CH2NH is shielded from the intense infrared radiation field in CONs, giving rise to a weak correlation between the CH2NH maser luminosity and the global infrared luminosity of the host galaxy. Higher angular resolution observations are needed to reveal the physical structure of the emission and to reveal the pumping mechanism. Altogether, CH2NH megamasers provide a new tool for investigating the nuclear processes in galaxies and a potential avenue for observing parsec-scale structure in CONs.
Acknowledgements.
S.A., M.G., K.O., S.K. N.F. gratefully acknowledges support from an ERC Advanced Grant 789410 a. The National Radio Astronomy Observatory is a facility of the U.S. National Science Foundation operated under cooperative agreement by Associated Universities, Inc.References
- Aalto et al. (2015a) Aalto, S., Garcia-Burillo, S., Muller, S., et al. 2015a, A&A
- Aalto et al. (2015b) Aalto, S., Martín, S., Costagliola, F., et al. 2015b, A&A
- Aalto et al. (2019) Aalto, S., Muller, S., König, S., et al. 2019, A&A, 627, A147
- Allegrini et al. (1979) Allegrini, M., Johns, J. W. C., & McKellar, A. R. W. 1979, J. Chem. Phys., 70, 2829
- Baan (1991) Baan, W. A. 1991, in Astronomical Society of the Pacific Conference Series, Vol. 16, Atoms, Ions and Molecules: New Results in Spectral Line Astrophysics, ed. A. D. Haschick & P. T. P. Ho, 45
- Baan et al. (2017) Baan, W. A., An, T., Klöckner, H.-R., & Thomasson, P. 2017, MNRAS, 469, 916
- Baan et al. (1989) Baan, W. A., Haschick, A. D., & Henkel, C. 1989, ApJ, 346, 680
- Barcos-Muñoz et al. (2018) Barcos-Muñoz, L., Aalto, S., Thompson, T. A., et al. 2018, ApJ, 853, L28
- Barcos-Muñoz et al. (2015) Barcos-Muñoz, L., Leroy, A. K., Evans, A. S., et al. 2015, ApJ, 799, 10
- Bennert et al. (2009) Bennert, N., Barvainis, R., Henkel, C., & Antonucci, R. 2009, ApJ, 695, 276
- Braatz et al. (2018) Braatz, J., Condon, J., Henkel, C., et al. 2018, in Astrophysical Masers: Unlocking the Mysteries of the Universe, ed. A. Tarchi, M. J. Reid, & P. Castangia, Vol. 336, 86–91
- Brunthaler et al. (2009) Brunthaler, A., Castangia, P., Tarchi, A., et al. 2009, A&A, 497, 103
- Castangia et al. (2019) Castangia, P., Surcis, G., Tarchi, A., et al. 2019, A&A, 629, A25
- Chen et al. (2015) Chen, X., Ellingsen, S. P., Baan, W. A., et al. 2015, ApJ, 800, L2
- Chen et al. (2016) Chen, X., Ellingsen, S. P., Zhang, J. S., et al. 2016, MNRAS, 459, 357
- Cornaton et al. (2016) Cornaton, Y., Ringholm, M., Louant, O., & Ruud, K. 2016, Physical Chemistry Chemical Physics (Incorporating Faraday Transactions), 18, 4201
- Costagliola et al. (2013) Costagliola, F., Aalto, S., Sakamoto, K., et al. 2013, A&A, 556, A66
- Danger et al. (2011) Danger, G., Borget, F., Chomat, M., et al. 2011, A&A, 535, A47
- Darling & Giovanelli (2002) Darling, J. & Giovanelli, R. 2002, AJ, 124, 100
- Dickens et al. (1997) Dickens, J. E., Irvine, W. M., DeVries, C. H., & Ohishi, M. 1997, ApJ, 479, 307
- Duxbury et al. (1981) Duxbury, G., Kato, H., & Le Lerre, M. L. 1981, Faraday Discuss. Chem. Soc., 71, 97
- Duxbury & Le Lerre (1982) Duxbury, G. & Le Lerre, M. L. 1982, Journal of Molecular Spectroscopy, 92, 326
- Duxbury & Le Lerre (1984) Duxbury, G. & Le Lerre, M. L. 1984, Infrared Physics, 24, 261
- Ellingsen et al. (2017) Ellingsen, S. P., Chen, X., Breen, S. L., & Qiao, H. H. 2017, MNRAS, 472, 604
- Falstad et al. (2021) Falstad, N., Aalto, S., König, S., et al. 2021, A&A
- Falstad et al. (2019) Falstad, N., Hallqvist, F., Aalto, S., et al. 2019, A&A, 623, A29
- Faure et al. (2018) Faure, A., Lique, F., & Remijan, A. J. 2018, The Journal of Physical Chemistry Letters, 9, 3199
- García-Burillo et al. (2015) García-Burillo, S., Combes, F., Usero, A., et al. 2015, A&A, 580, A35
- Godfrey et al. (1973) Godfrey, P. D., Brown, R. D., Robinson, B. J., & Sinclair, M. W. 1973, Astrophys. Lett., 13, 119
- González-Alfonso et al. (2012) González-Alfonso, E., Fischer, J., Graciá-Carpio, J., et al. 2012, A&A, 541, A4
- Gordon et al. (2017) Gordon, I. E., Rothman, L. S., Hill, C., et al. 2017, J. Quant. Spec. Radiat. Transf., 203, 3
- Gorski et al. (2017) Gorski, M., Ott, J., Rand, R., et al. 2017, ApJ, 842, 124
- Gorski et al. (2018) Gorski, M., Ott, J., Rand, R., et al. 2018, ApJ, 856, 134
- Gorski et al. (2019) Gorski, M. D., Ott, J., Rand, R., et al. 2019, MNRAS, 483, 5434
- Hagiwara et al. (2001) Hagiwara, Y., Henkel, C., Menten, K. M., & Nakai, N. 2001, ApJ, 560, L37
- Halonen et al. (1986) Halonen, L., Deeley, C. M., & Mills, I. M. 1986, J. Chem. Phys., 85, 692
- Halonen & Duxbury (1985a) Halonen, L. & Duxbury, G. 1985a, Chemical Physics Letters, 118, 246
- Halonen & Duxbury (1985b) Halonen, L. & Duxbury, G. 1985b, J. Chem. Phys., 83, 2091
- Halonen & Duxbury (1985c) Halonen, L. & Duxbury, G. 1985c, J. Chem. Phys., 83, 2078
- Halonen & Duxbury (1986) Halonen, L. & Duxbury, G. 1986, ApJ, 303, 897
- Hamada et al. (1984) Hamada, Y., Hashiguchi, K., Tsuboi, M., Koga, Y., & Kondo, S. 1984, Journal of Molecular Spectroscopy, 105, 70
- Henkel et al. (2005) Henkel, C., Braatz, J. A., Tarchi, A., et al. 2005, Ap&SS, 295, 107
- Henkel & Wilson (1990) Henkel, C. & Wilson, T. L. 1990, A&A, 229, 431
- Herrnstein et al. (1999) Herrnstein, J. R., Moran, J. M., Greenhill, L. J., et al. 1999, Nature, 400, 539
- Kandalian (1996) Kandalian, R. A. 1996, Astrophysics, 39, 237
- Kondratko et al. (2005) Kondratko, P. T., Greenhill, L. J., & Moran, J. M. 2005, ApJ, 618, 618
- König et al. (2017) König, S., Martín, S., Muller, S., et al. 2017, A&A, 602, A42
- Lonsdale et al. (1998) Lonsdale, C. J., Lonsdale, C. J., Diamond, P. J., & Smith, H. E. 1998, ApJ, 493, L13
- Mangum et al. (2013) Mangum, J. G., Darling, J., Henkel, C., & Menten, K. M. 2013, ApJ, 766, 108
- Mangum et al. (2008) Mangum, J. G., Darling, J., Menten, K. M., & Henkel, C. 2008, ApJ, 673, 832
- Mangum et al. (2019) Mangum, J. G., Ginsburg, A. G., Henkel, C., et al. 2019, ApJ, 871, 170
- Martín et al. (2016) Martín, S., Aalto, S., Sakamoto, K., et al. 2016, A&A, 590, A25
- Martín et al. (2006) Martín, S., Mauersberger, R., Martín-Pintado, J., Henkel, C., & García-Burillo, S. 2006, ApJS, 164, 450
- Menten (1991) Menten, K. M. 1991, in Astronomical Society of the Pacific Conference Series, Vol. 16, Atoms, Ions and Molecules: New Results in Spectral Line Astrophysics, ed. A. D. Haschick & P. T. P. Ho, 119–136
- Momjian et al. (2006) Momjian, E., Romney, J. D., Carilli, C. L., & Troland, T. H. 2006, ApJ, 653, 1172
- Muller et al. (2011) Muller, S., Beelen, A., Guélin, M., et al. 2011, A&A, 535, A103
- Onishi et al. (2017) Onishi, K., Iguchi, S., Davis, T. A., et al. 2017, MNRAS, 468, 4663
- Parra et al. (2005) Parra, R., Conway, J. E., Elitzur, M., & Pihlström, Y. M. 2005, A&A, 443, 383
- Peck et al. (2003) Peck, A. B., Henkel, C., Ulvestad, J. S., et al. 2003, ApJ, 590, 149
- Pihlström et al. (2001) Pihlström, Y. M., Conway, J. E., Booth, R. S., Diamond, P. J., & Polatidis, A. G. 2001, A&A, 377, 413
- Reid et al. (2009) Reid, M. J., Braatz, J. A., Condon, J. J., et al. 2009, ApJ, 695, 287
- Reid et al. (2014) Reid, M. J., Menten, K. M., Brunthaler, A., et al. 2014, ApJ, 783, 130
- Roche et al. (2015) Roche, P. F., Alonso-Herrero, A., & Gonzalez-Martin, O. 2015, MNRAS, 449, 2598
- Sakamoto et al. (2017) Sakamoto, K., Aalto, S., Barcos-Muñoz, L., et al. 2017, ApJ, 849, 14
- Sakamoto et al. (2013) Sakamoto, K., Aalto, S., Costagliola, F., et al. 2013, ApJ, 764, 42
- Sakamoto et al. (2010) Sakamoto, K., Aalto, S., Evans, A. S., Wiedner, M. C., & Wilner, D. J. 2010, ApJ, 725, L228
- Salter et al. (2008) Salter, C. J., Ghosh, T., Catinella, B., et al. 2008, AJ, 136, 389
- Sanders et al. (2003) Sanders, D. B., Mazzarella, J. M., Kim, D. C., Surace, J. A., & Soifer, B. T. 2003, AJ, 126, 1607
- Sato et al. (2005) Sato, N., Yamauchi, A., Ishihara, Y., et al. 2005, PASJ, 57, 587
- Schöier et al. (2005) Schöier, F. L., van der Tak, F. F. S., van Dishoeck, E. F., & Black, J. H. 2005, A&A, 432, 369
- Suzuki et al. (2016) Suzuki, T., Ohishi, M., Hirota, T., et al. 2016, ApJ, 825, 79
- Tabone et al. (2021) Tabone, B., van Hemert, M. C., van Dishoeck, E. F., & Black, J. H. 2021, arXiv e-prints, arXiv:2101.01989
- Theule et al. (2011) Theule, P., Borget, F., Mispelaer, F., et al. 2011, A&A, 534, A64
- Treister et al. (2010) Treister, E., Urry, C. M., Schawinski, K., Cardamone, C. N., & Sanders, D. B. 2010, ApJ, 722, L238
- Turner (1991) Turner, B. E. 1991, ApJS, 76, 617
- van der Tak et al. (2007) van der Tak, F. F. S., Black, J. H., Schöier, F. L., Jansen, D. J., & van Dishoeck, E. F. 2007, A&A, 468, 627
- van der Tak et al. (2020) van der Tak, F. F. S., Lique, F., Faure, A., Black, J. H., & van Dishoeck, E. F. 2020, Atoms, 8, 15
- Wiesenfeld & Faure (2013) Wiesenfeld, L. & Faure, A. 2013, MNRAS, 432, 2573
- Wiggins et al. (2016) Wiggins, B. K., Migenes, V., & Smidt, J. M. 2016, ApJ, 816, 55
- Zschaechner et al. (2016) Zschaechner, L. K., Ott, J., Walter, F., et al. 2016, ApJ, 833, 41
Appendix A Molecular data for CH2NH and H2CO
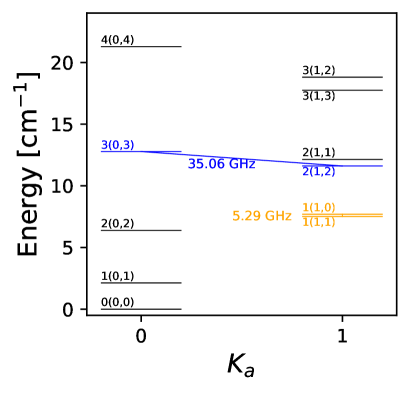
Methanimine provides a useful test case of the effects of radiative excitation of an interstellar molecule that is known to exhibit maser emission. The molecule has a relatively large permanent dipole moment in its ground state, Debye, with comparable components along the a- and b- principal axes of rotation. Thus, it has relatively strong rotational transitions at both centimeter and millimeter wavelengths. Figure 6 shows the lowest 11 energy levels with the predicted maser transitions at 5.29 GHz and 35.05 GHz respectively labeled in orange and blue. All nine of the vibrational modes are infrared-active, and all of the vibrational fundamental bands have been rotationally analyzed. The rotational analyses of the infrared spectra of CH3OH were carried out more than 30 years ago, mainly by Duxbury and Halonen and their collaborators through the use of the high-resolution Fourier-transform spectrometer at the McMath Solar Telescope on Kitt Peak (see Table 4). We have used a slightly modified version of asymbd, a computer code originally written by Arthur Maki in the 1970s, to compute the rotational and vibration-rotation spectra of CH2NH (A. G. Maki, 1986, private communication to R. Bumgarner and J. H. Black). All of these computations have used the A reduction of the Hamiltonian operator in the 1R representation. The inputs are the rotational constants and band-head frequencies taken from the spectroscopic analyses. The spontaneous transition probabilities of pure rotational transitions are based on the accurate values of the ground-state permanent dipole moments, and D (Allegrini et al. 1979).
For the vibration-rotation transition probabilities, we adopted the band strengths of Cornaton et al. (2016), which were determined from ab initio calculations. They compared band strengths obtained with several different treatments of the geometric derivative tensors of the electric dipole moment. We adopt the results of their numeric, anharmonic method with a step size of 0.01 Å. Cornaton et al. did not tabulate their computed band strengths or transition moments, but rather presented a graph of their calculated infrared spectra of CH2NH. In the calculated spectrum, each band was represented by a Lorentzian profile of FWHM cm-1. Although their graph of the spectrum has a vertical axis labeled “Intensity / km mol-1,” it can be deduced that this must be the “intensity” per unit wavenumber and that the integrated band intensity [km/mole] should be given by
where is the peak intensity displayed for each band. It is also important to note that Cornaton et al. labeled some of the bands differently from the spectroscopists: The vibrational modes through are in the same order. The spectroscopic analyses distinguished between the first seven modes of A′ symmetry (mixed a- and b-type spectra for in-plane vibrations) and the last 2 modes of A′′ symmetry (c-type spectra for out-of-plane vibrations); thus modes , , and were listed by Cornaton et al. as , , and , respectively. We adopt the ordering from the spectroscopic literature. The dimensionless absorption oscillator strength of a band is directly related to the integrated intensity,
and the dipole transition moment in Debye can be written as fixed not rendering
when the degeneracies of the upper () and lower () states are the same. Our adopted values of the transition moments are in good agreement with the older ab initio calculations of Hamada et al. (1984) and with the relative intensities determined from measurements of , , and by Halonen et al. (1986), and Halonen & Duxbury (1986). Table A.1 contains our adopted values for the nine fundamental vibration-rotation bands. The energy of the level of each state is listed, together with the inverse lifetime at low , , where is the spontaneous transition probability in [s-1] for a band and and stand for the upper and lower rotational quantum numbers, respectively. The final column lists references to the sources of spectroscopic constants.
| Mode (i) | References | ||||
|---|---|---|---|---|---|
| cm-1 | s-1 | km/mole/cm-1 | D | ||
| 0.000 | … | … | 1.971 | 1,2 | |
| 3262.622 | 4.24 | 0.202 | 0.0198 | 3 | |
| 3024.452 | 50.86 | 2.764 | 0.0769 | 4 | |
| 2914.184 | 60.57 | 3.551 | 0.0884 | 4 | |
| 1638.299 | 7.41 | 1.448 | 0.0735 | 2,5 | |
| 1452.048 | 1.71 | 0.419 | 0.0423 | 5,6 | |
| 1344.261 | 11.72 | 3.257 | 0.1237 | 5,6 | |
| 1058.181 | 5.60 | 2.495 | 0.1213 | 1,7,8,9 | |
| 1126.988 | 7.06 | 2.914 | 0.1267 | 1,7,8,9 | |
| 1060.760 | 2.47 | 1.162 | 0.0821 | 1,7,8,9 |
A line list with transition probabilities has been computed for each of the pure-rotational spectra (ground state and nine states) and for each of the nine fundamental bands, that is, 19 lists in all. The maximal rotational quantum number is and the ground-state rotational energies are all less than 1000 cm-1, so that the levels will not overlap with excited-state levels. The 19 lists were combined to form a single file in the format of the Leiden Atomic and Molecular Database (LAMDA; see Schöier et al. 2005)444https://home.strw.leidenuniv.nl/moldata/, with an energy-ordered list of term energies, a frequency-ordered table of transitions, and tables of downward inelastic collisional rate coefficients. The combined list contains only excited levels that can be reached by radiatively allowed transitions from levels. The computing time required to solve the non-LTE rate equations increases rapidly with the number of levels. Therefore, several versions of the LAMDA-format file were constructed, as summarized in Table 5.
| Levels | Transitions | highest level | |||
|---|---|---|---|---|---|
| [cm-1] | |||||
| vibrot | all | ||||
| 360 | 3326 | 5 | 5(5,0) | 168.813 | |
| 1210 | 16835 | 10 | 10(10,1) | 662.827 | |
| 2542 | 40852 | 15 | 13(12,1) | 978.137 | |
| 4126 | 69226 | 20 | 20(10,10) | 993.167 | |
| 6633 | 111780 | 29 | 20(10,10) | 993.167 | |
| hfs | only | ||||
| 1446 | 3209 | 29 | 29(9,21) | 1369.959 |
The smallest data file is not recommended for general use, although it might be valuable for tracing the parameter space that allows strong maser action, where excitation computations converge very slowly.
Hyperfine structure (HFS) in low- transitions of CH2NH is well resolved in laboratory spectra and in the spectra of narrow-line astronomical sources. In low-lying transitions, the HFS is quite large; for example, six HFS components are spread over 154 km s-1 in Doppler velocity around the transition at 5.290 GHz. In the higher frequency transitions at 200 to 400 GHz, the HFS covers only 1 to 3 km s-1. We neglect HFS entirely in the data files that include vibrationally excited states. The last line of Table 5 refers to a data file with HFS in transitions within the ground vibrational state only. This file has been constructed directly from the HFS-resolved file c029518_hfs.cat in the Cologne Database for Molecular Spectroscopy (CDMS; see Müller et al. 2001).666CDMS at https://cdms.astro.uni-koeln.de/classic/entries/
Faure et al. (2018) employed high-level quantum mechanical methods to compute the interaction potential and collision dynamics of para-H2 colliding with CH2NH. Their work gave cross sections and rate coefficients for inelastic collisions involving the 15 lowest rotational levels of CH2NH with energies cm-1 (or K). They included these rates in a non-LTE model of the excitation of CH2NH to predict weak maser emission in the 5.29 GHz transition, with an intensity in good agreement with that observed in the molecular cloud Sgr B2(N) near the Galactic Center. The full set of computed collision rates was not published, although rates for four collisional transitions were displayed in Fig. 2 of Faure et al. (2018). The rate coefficient for the downward transition between the two lowest rotational levels, , is cm3 s-1 at a kinetic temperature K. Without a set of accurate collision rates, we cannot explore effects of non-LTE excitation that are sensitive to details of the state-to-state collision-induced transitions. However, we can use an extensive set of very crude collision rates to investigate to order-of-magnitude the competition between collisional and radiative processes. All of the data files listed in Table 2 contain collision rates calculated with the following simple prescription for radiatively allowed transitions only. The downward collision rate coefficient for a transition is given by
where is the dimensionless radiative line strength computed in the program asymbd as an intermediate step toward the spontaneous transition probability. We adopt cm3 s-1 for pure rotational transitions within a given vibrational state, which recovers the rate computed by Faure et al. (2018) for the transition for which . For all transitions in which the vibrational quantum number changes, we adopt a scaling factor that is an order of magnitude smaller, cm3 s-1. These adopted downward rates are taken to be independent of temperature. The upward rates are computed from the downward rates in detailed balance within the GROSBETA program. The collision partner is a generic neutral species, namely the hydrogen molecule. The adopted collision rates neglect transitions, which are expected to be important in such an asymmetric, polar molecule as CH2NH. A detailed summary of recent progress in the study of collisional processes is given in the review of the LAMDA database by van der Tak et al. (2020). The crude collision rates adopted here limit the accuracy of any deduced hydrogen density to an order of magnitude. As suggested in the main text, these rates may still be adequate to draw broad conclusions about the parameter space of excitation in real sources, especially where radiative processes dominate.
In the case of formaldehyde, H2CO, a similar data file has been constructed based upon the entry in the CDMS for the ground vibrational state and on the entry in the HITMAN database Gordon et al. (2017)777https://hitran.org/ for vibrationally excited states. This data set comprises 1034 vibrational-rotational levels with maximal rotational quantum number and energies up to 3304 cm-1. The line list of 3791 transitions spans frequencies from 1 MHz to 93 THz. Rate coefficients for inelastic collisions of para-H2 and ortho-H2 with H2CO have been taken from Wiesenfeld & Faure (2013). These rates apply for temperatures between 10 K and 300 K. The ortho and para nuclear-spin species of H2CO are treated together, their relative abundances being determined by the value of an additional parameter, the formation temperature, . Although it is possible to include reactive ortho/para interchange processes, these are not used in the present calculations. In all the results discussed here, , which is high enough to ensure that the ortho/para ratio approaches the ratio 3 of the corresponding nuclear-spin statistical weights.
Appendix B Continuum radiation and pumping rates of CH2NH in IC 860
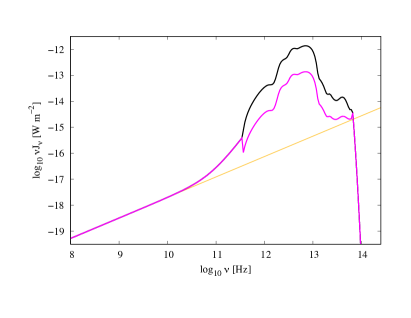
As described in Sect. 4.2, a realistic internal radiation field is an essential element of the non-LTE radiative transfer models for molecules such as CH2NH and H2CO. We explored empirical models of the continuum spectral energy distribution for IC 860 in some detail. The model radiation field is displayed in Figs. 7 and 8 in different forms for two values of and . Figure 7 shows versus . Figures 8 displays the equivalent radiation brightness temperature . We note that the nonthermal power-law component dominates at radio frequencies.
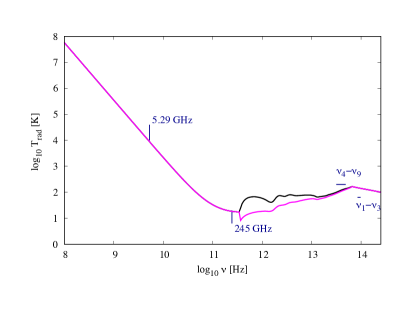
It is useful to compare the spontaneous and stimulated emission rates in the model radiation field for selected transitions of CH2NH over a wide range of frequencies. These rates are collected in Table 8 to illustrate the competition between processes that deplete or add to the population of the and levels. We note in particular that the 5.29 GHz transition itself, , suffers absorption and stimulated emission in the adopted radiation field at rates that are times faster than the spontaneous transition probability. The total spontaneous decay rates out of the and levels are s-1 and s-1, respectively. Thus, population is drained from the lower of the two levels faster than from the higher one. As a result, the populations of these levels will be automatically inverted (negative excitation temperature) if collisions are relatively unimportant and if the rates are comparable for the processes that populate them. It is also apparent that the most rapid radiative processes in this radiation field tend to be the rotational transitions at millimeter and submillimeter wavelengths. Further observations of the millimeter-submillimeter-wave continuum with high angular resolution will make it possible to refine the description of the radiation field.
| Band | ||||||||
|---|---|---|---|---|---|---|---|---|
| [GHz] | [s-1] | [K] | [s-1] | [K] | [s-1] | |||
| 5.29 | 8791.0 | 8791.0 | ||||||
| 133.27 | 26.1 | 26.1 | ||||||
| 166.85 | 22.2 | 22.2 | ||||||
| 617.87 | 66.5 | 16.0 | ||||||
| 31569.95 | 99.6 | 89.0 | ||||||
| 31726.82 | 100.0 | 90.2 | ||||||
| 33555.42 | 104.7 | 94.4 | ||||||
| 40301.39 | 121.7 | 109.9 | ||||||
| 43524.31 | 128.4 | 116.6 | ||||||
| 49109.62 | 137.8 | 127.3 | ||||||
| 87360.56 | 147.3 | 147.3 | ||||||
| 90503.71 | 145.4 | 145.4 | ||||||
| 97805.61 | 141.3 | 141.3 |