Resonant Inelastic X-ray Scattering Study of Electron-Exciton Coupling in High- Cuprates
Abstract
Explaining the mechanism of superconductivity in the high- cuprates requires an understanding of what causes electrons to form Cooper pairs. Pairing can be mediated by phonons, the screened Coulomb force, spin or charge fluctuations, excitons, or by a combination of these. An excitonic pairing mechanism has been postulated, but experimental evidence for coupling between conduction electrons and excitons in the cuprates is sporadic. Here we use resonant inelastic x-ray scattering (RIXS) to monitor the temperature dependence of the exciton spectrum of Bi2Sr2CaCu2O8-x (Bi-2212) crystals with different charge carrier concentrations. We observe a significant change of the exciton spectra when the materials pass from the normal state into the superconductor state. Our observations show that the excitons start to shift up (down) in the overdoped (underdoped) sample when the material enters the superconducting phase. We attribute the superconductivity-induced effect and its sign-reversal from underdoped to overdoped to the exchange coupling of the site of the exciton to the surrounding copper spins.
Introduction
Ever since Bednorz and Muller’s Bednorz and Muller (1986) discovery of high- superconductivity in cuprates the question as to what mediates superconductivity in these materials has continued to occupy the scientific community. The strong electron correlations of the Cu states form a major theoretical challenge Anderson (1987). In particular, in the insulating parent compounds the on-site part of the Coulomb repulsion splits the Cu band into a fully occupied lower Hubbard band (LHB) and an empty upper Hubbard band (UHB). The LHB and UHB are eV apart and the O band, which is fully occupied, falls inside this gap with the top of the O band about eV below the UHB. The separation between the top of the O band and the UHB, the so-called charge transfer gap Zaanen et al. (1985); Ghijsen et al. (1988), constitutes the lower bound of the electron-hole continuum.
Doping either electrons or holes induces an insulator-to-metal transition. It has turned out to be difficult to obtain a simple analytical framework describing simultaneously the localized charges of the correlated insulator and the mobile charges responsible for the metallic conductivity. Even the Hubbard model, describing a single band of charge carriers with on-site Coulomb repulsion , can not be solved analytically in 2 or 3 dimensions, and the properties and predictions of this model are based on the numerical solution of small clusters via density matrix renormalization group and quantum Monte Carlo, or approximation schemes such as dynamical mean field theory Arovas et al. (2022). The present status of the Hubbard model is that in 2 dimensions the superconducting state is unstable with respect to charge stripes, and that stable superconductivity requires the suppression of the charge stripes state by introducing next-nearest neighbor hopping, longer range hoppings, dynamical lattice effects and other orbital contributions Jiang and Devereaux (2019).
Theoretical studies of superconductivity in cuprates have mostly concentrated on the aforementioned Hubbard model and the related – model for which the fundamental interaction is non-retarded Anderson (2007). When interacting holes form Cooper pairs, the effective-mass change resulting from the pair formation may stabilize the superconducting state Hirsch (2002). On a microscopic scale a pairing-induced modification of the bare density response function Leggett (1999), magnon mediated-interactions Eschrig (2006); Scalapino (2012), plasmon-mediated interactions Bill et al. (2003), pairing mediated by the ionic electron polarizabilities Sawatzky et al. (2009); Yacoby and Girshberg (2016), and exciton-mediated pairing Weber et al. (1988); Zaanen and Oleś (1993); Feiner et al. (1992); Buda et al. (1994); Holcomb et al. (1994); Bucci et al. (1995); Little et al. (2007); Mazov (2012) derive from the Coulomb interaction between the electrons (for a short review see Ref. Oleś et al. (2019)), which does not involve lattice degrees of freedom in contrast to phonon-mediated pairing Maksimov et al. (2010). The concept of exciton-mediated pairing has been pioneered in the context of organic materials Little (1964), and sandwich structures Ginzburg (1970); Allender et al. (1973); Mazov (2012). It has also been considered for the cuprates Weber et al. (1988); Zaanen and Oleś (1993); Feiner et al. (1992); Buda et al. (1994); Holcomb et al. (1994); Bucci et al. (1995); Little et al. (2007); Mazov (2012), but experimental information has remained scarce. Excitons are bound states of an electron and a hole due to the attraction resulting from their opposite charge. The strongest binding occurs when the electron and the hole occupy the same site, namely, when an electron from one of the occupied , , , or states is excited into the partially filled state. Since this does not change the site occupancy there is no energy cost of order and the only contribution comes from the level splitting due to the crystal field Zaanen and Oleś (1993); Wang et al. (2011). Such excitons are the most prominent features of resonant inelastic x-ray scattering (RIXS) spectra at the Cu -edge Kuiper et al. (1998) and from numerous experimental Ghiringhelli et al. (2004, 2007); Moretti Sala et al. (2011); Dean et al. (2013, 2014) and theoretical Wang et al. (2011) studies it has become clear that they are robust for all experimentally achievable carrier concentrations.
It is known that phonons coupled to conduction electrons change energy and lifetime when entering the superconducting phase Axe and Shirane (1973); Shapiro et al. (1975); Altendorf et al. (1993). This behavior is attributed to a change of the self-energy of the phonons below due to the fact that they are coupled to the conduction electrons Zeyher and Zwicknagl (1990). On the other hand, when a exciton is created, there is an orbital flip from the to one of the other Cu levels. Thus, the excitons are firmly tied to the carriers at the Fermi level. Here we report the observation of the renormalization of excitons with energies in the range of – eV. Using RIXS we observe the impact of the superconducting order on the excitons in \ceBi2Sr2CaCu2O_8-x.
Experimental results
We measured RIXS spectra of crystals from the \ceBi_2Sr_2CaCu_2O_8-x bi-layer cuprate family across the superconducting dome: underdoped with carrier concentration and K, optimally doped (, K), and overdoped (, K). The measurements, performed at the ADRESS beamline of the Swiss Light Source at the Paul Scherrer Institut (PSI) Strocov et al. (2010); Ghiringhelli et al. (2006), were carried out using -polarization of the incoming x-rays with energy resonant at the Cu edge. We express the momentum vectors on the basis of the pseudo-tetragonal structure with planar lattice parameter Å along the CuO bonds and Å perpendicular to the planes. Each crystal was aligned on the sample holder using Laue diffraction, and data were collected for selected values of the momentum transfer in units of the reciprocal lattice, where is an integer number. Keeping in mind the periodicity in reciprocal space, we will use the shorthand notation .
The samples were cleaved at K in ultra high vacuum (UHV) directly on the manipulator for RIXS data acquisition.
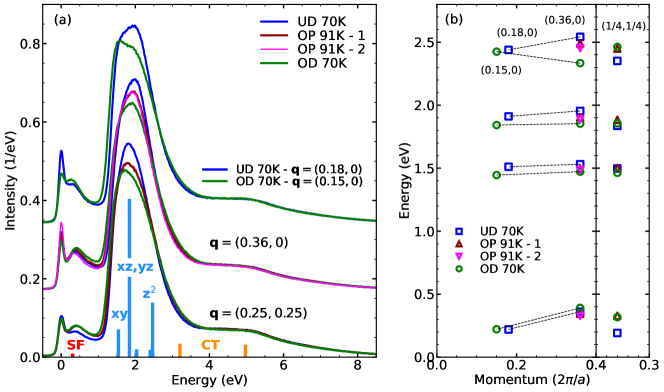
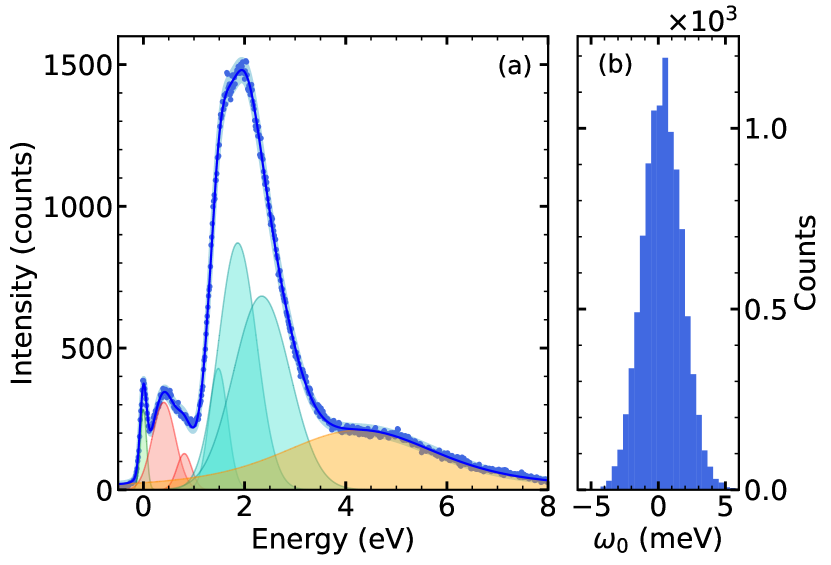
In Fig. 1(a) we compare RIXS spectra of Bi-2212 for different dopings and momentum values. Since as we will see below, the temperature dependence is too weak to be noticeable on this scale, for each given doping and momentum value the spectra were averaged in the temperature range of approximately K above and below . The vertical bars are theoretical predictions of the excitation energies following from a cluster calculation (see Appendix B). We see that the central peak at eV corresponds to the and excitons, the shoulder at eV to and the shoulder at eV to . We have fitted the spectra to a linear superposition of Voigt profiles (see Appendix A). The manifold is described by the three aforementioned peaks, with Gaussian profiles having a FWHM of around (0.5, 0.9, 0.4) eV respectively for (1.5, 1.9, 2.4) eV. This line shape has been shown by Lee et al. to originate in the Franck-Condon principle, resulting in phonon overtones of the electronic mode described by a Gaussian envelope Lee et al. (2014). We observe that, when the doping increases, the excitons shift to lower energy. In particular, from the peak positions extracted by fitting, we can see that for , where the effect is strongest, all excitons shift to lower energy.
The momentum dispersion for the three different dopings is shown in Fig. 1(b). We see that the peak positions have relatively small energy-momentum dispersion, which confirms the observations of Moretti et al. Moretti Sala et al. (2011). This finding underlines the strongly localized character of these excitations. The peak energy below 0.5 eV has strong momentum dependence, which is expected for a magnon.
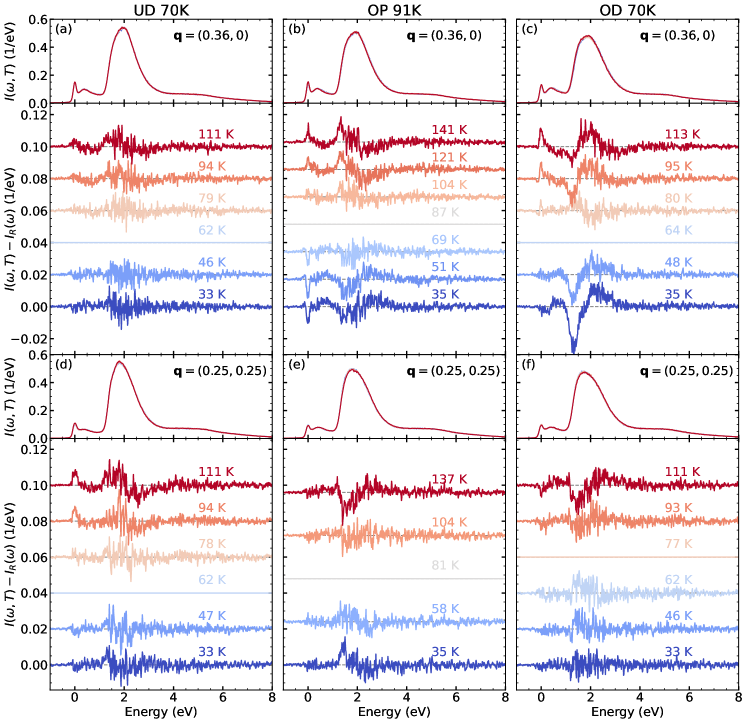
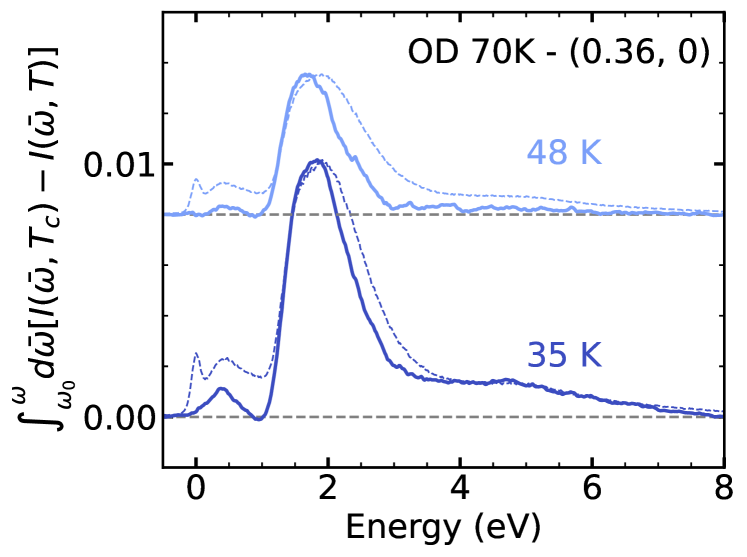
In the top panels of Fig. 2 we present the RIXS data for different dopings, momentum transfers and for different temperatures. The data in this figure are averages spanning intervals of K (UD 70K and OD 70K) and K (OP 91K) in order to minimize the statistical noise. In order to highlight the spectral temperature dependence, we show in the bottom panels the spectra from which the spectrum taken at is subtracted. The temperature dependence in the paramagnon region between eV and eV is very weak, which is consistent with the observations of Peng et al. Peng et al. (2015) for optimally doped Bi1.5Pb0.55Sr1.6La0.4CuO6+δ at K and K. Also the charge transfer region between 3.5 and 8 eV has negligible temperature dependence. The most significant temperature dependence occurs for the underdoped and overdoped samples in the part of the spectrum corresponding to the excitons. In particular the difference spectra show that spectral weight is redistributed between different parts of the manifold as a function of temperature. We calculated for each spectrum the average energy
| (1) |
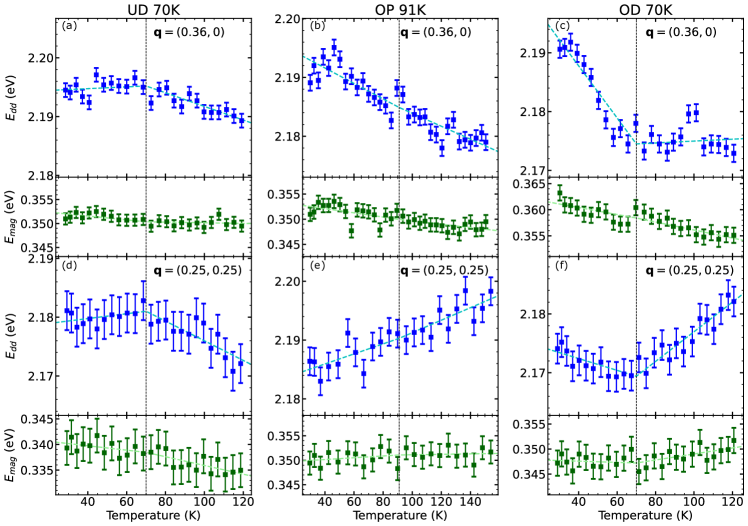
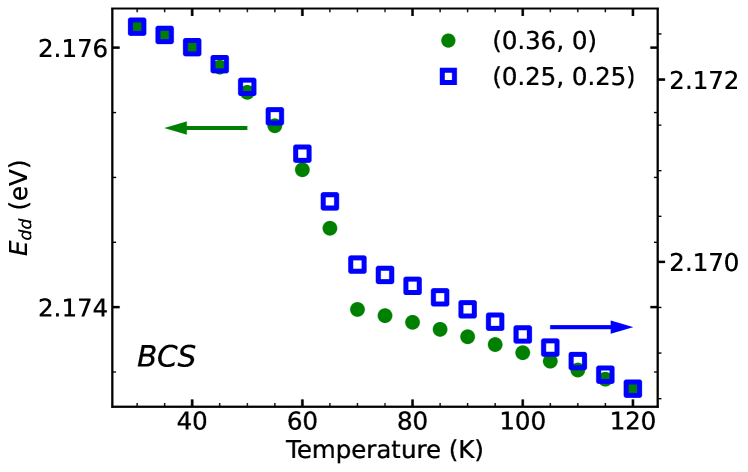
In Fig. 3 the temperature dependence of the magnon and exciton energies are displayed using Eq. (1). For the magnon we use the integration limits eV and eV, for the exciton eV and eV. In Appendix A we demonstrate that the temperature evolution is essentially a uniform shift of and , with a significantly smaller shift of . Since the latter component does not contribute very strongly to the overall spectral weight of the manifold, the average exciton energy provides a meaningful representation of the thermal evolution of the spectrum. We see that this energy shifts as function of temperature for different dopings. The temperature dependence shows an upward change of slope at for the overdoped case [in Fig. 3(c) and (f)], and a downward change with smaller magnitude in the underdoped sample [panels (a) and (d)]. In contrast the magnon peak shows a negligible, if not absent, superconductivity induced effect. It is of interest to make a connection to the doping dependence shown in Fig. 1, where we noticed that for the excitons soften with increasing doping. These trends are consistent with the evolution of either antiferromagnetic or singlet correlations as a function of doping and temperature. That said, for both doping and temperature dependence appear to follow a more complex pattern.
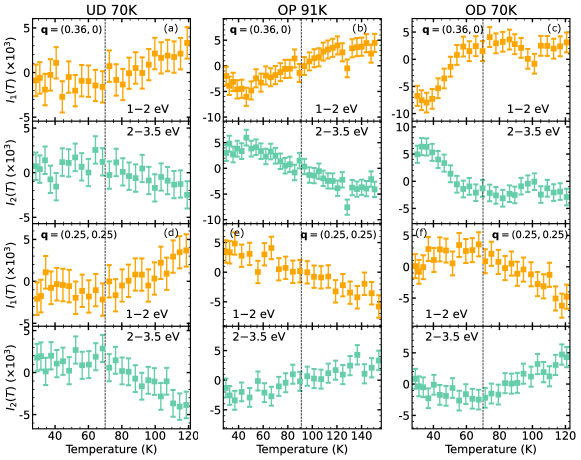
These temperature dependencies are also clearly revealed by the intensities of the left-hand side (1–2 eV) and right-hand side (2–3.5 eV) of the manifold, confirming the change of slope near for the underdoped and overdoped samples (see Fig. 4). To quantify these slope changes we have fitted the temperature dependence of the average energies of the magnon and the exciton manifold to
| (2) |
by adjusting the normal state parameters , , and the superconductivity induced change of energy . The dashed curves in Fig. 3 are least-squares fits of this expression to the experimental data points. In Fig. 4 we present the temperature dependence of the integrated intensity of the spectra shown in Fig. 2
| (3) |
in two regions defined by : – eV (region 1), and – eV (region 2). The split at 2 eV is motivated by the fact that for all panels in Fig. 2 the intensity on either side has opposite temperature dependence. It thus provides optimal signal-to-noise ratio of the temperature dependence in the exciton region. Comparing the intensity in regions 1 and 2, we see that, when entering the superconducting phase, for the overdoped case spectral weight is transferred from the low energy to the high energy side of the exciton spectrum and vice versa for the underdoped case. As in Fig. 3, we observe a change of slope in the temperature dependence around , except for the optimally doped sample. As can be seen in Fig. 3, for the OD 70K the contribution of the superconducting state is to shift the exciton peak to higher energies. This conclusion is consistent with the superconductivity-induced effect on the integrated intensity which indicates a transfer of the spectral weight towards higher energies.
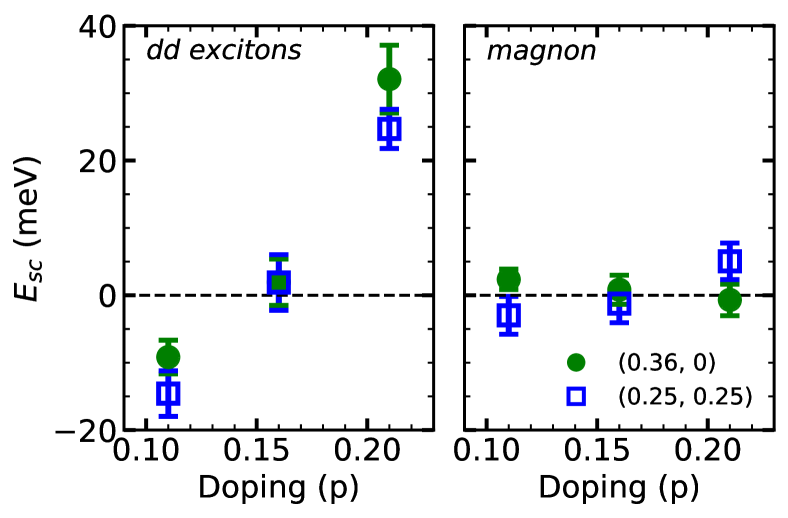
In Fig. 5 the superconductivity-induced energy changes of the excitons and of the magnon are compared for all samples and momentum directions. At the overdoped side the effect of the superconducting order is to shift the excitons from lower to higher energy, both along the nodal and antinodal directions. We observe the opposite trend for the underdoped sample, again for the nodal as well as the antinodal direction in momentum space. For the optimally doped sample the superconductivity-induced change is small along either direction. For the magnon, the influence of the superconducting phase transition, if it exists, falls within the experimental noise.
Discussion
The aforementioned electron-phonon coupling resulting in the Gaussian line shape Lee et al. (2014) can in principle lead to a finite temperature dependence of the excitons, if the coupled vibrational modes are sufficiently anharmonic. Such an effect has for example been observed in the vibronic spectra of BEH-PPV conjugated polymer films Oliveira et al. (2003), where the excitons have an Arrhenius type shift to higher energy with increasing temperature. The observed temperature dependence in the present case of the excitons may, at least in part, be due to the electron-phonon coupling. A natural question is whether the observed change of slope at the superconducting phase transition would also be a consequence of the electron-phonon coupling. To have such a strong effect requires that the phonon anharmonicity is strongly influenced by the superconducting phase transition. Refs. Ahn and Nagaosa (2021) and Chen and Huang (2021) discuss superconductivity induced change of orbital character and its impact on the optical spectra. With some modifications, similar notions come into play into the RIXS exciton spectra if, in conjunction with the SC phase transition, there is a change of orbital character of the bands. The influence on the excitonic spectrum is however very indirect and quantitatively much too small compared to our observations. Little and Holcomb Holcomb et al. (1994); Little et al. (2007) analyzed the optical conductivity in the superconducting and normal states and arrived at the conclusion that the charge carriers are coupled to the excitons. Vice versa one may expect a manifestation in the exciton spectrum of a mixing with the electron-hole continuum, causing a renormalization of the exciton energy by a self-energy . Here is the charge susceptibility and is a momentum dependent coupling constant. Husain et al. Husain et al. (2019) reported a strong temperature dependence of the imaginary part of the charge susceptibility at , with a change of sign from underdoped to overdoped. In the weak coupling approach this phenomenology translates into a temperature dependent exciton energy having a strong doping dependence of the temperature coefficient. When the material passes from normal to superconducting, the susceptibility changes, causing both an energy shift and a change of the lifetime of the exciton, similar to what happens in the case of electron-phonon coupling Axe and Shirane (1973); Shapiro et al. (1975); Altendorf et al. (1993); Zeyher and Zwicknagl (1990). The susceptibility function satisfies , where is the Coulomb potential and the dielectric function. For the dielectric function can be measured with great precision using optical techniques. Experimentally it was found that the electron-hole susceptibility of the cuprates near is significantly impacted by the superconducting order, even for energies higher than 1 eV Levallois et al. (2016). By considering the renormalization due to the BCS charge susceptibility, the temperature behavior calculated for the exciton is qualitatively similar to the experimental observations at the overdoped side (Appendix C). Quantitatively this weak-coupling model falls short in describing the experimental data: even with the electron-exciton coupling constant set to eV, the calculated shift is an order of magnitude smaller than in the experiment.
An explanation may be found in the fact that the superconducting carriers move in the bands, while a exciton is effectively a localized orbital flip of a hole to a different orbital. The circumstance that the electronic conductivity and the excitons involve the same electrons calls for a more radical approach than offered by the weak coupling scheme sketched above. In fact, if the material is superconducting the orbital flip of one of the holes necessarily breaks up a Cooper’s pair. Consequently when passing from the normal state to the superconducting state the exciton energy increases by the pair breaking energy. The observation of a weaker effect of the opposite sign for the underdoped sample appears to be, as we will argue below, a manifestation of the physics underlying the pseudogap in the cuprates. A deeper understanding is obtained by considering the following points:
-
•
The material is antiferromagnetic (AF) at zero doping. The lower bound of inter-site exchange energy is therefor , where is the nearest-neighbor exchange constant.
-
•
The -wave superconducting state corresponds to a condensate of local singlet pairs Kotliar and Liu (1988); Zhang et al. (1988); Yokoyama and Shiba (1988); Gros (1988). The exchange interaction of each singlet pair is strongest if the two electrons or holes occupy nearest neighbor sites. Consequently the lower bound of the exchange energy in the superconducting state is .
-
•
The antiferromagnetic state is suppressed by hole doping, but short-range (in particular nearest-neighbor) spin-correlations persist and diminish gradually as a function of increasing doping.
This scenario provides the formal basis for superconductivity by kinetic energy lowering in the underdoped cuprates Scalapino and White (1998); Hirsch (2002); Maier et al. (2004); Toschi et al. (2005); Haule and Kotliar (2007); Gull and Millis (2012); Fratino et al. (2016), and for understanding why for the underdoped cuprates the Drude spectral weight increases in the superconducting state Molegraaf et al. (2002); Deutscher et al. (2005); Gedik et al. (2005); Carbone et al. (2006); Giannetti et al. (2011). It also explains why this effect flips sign at the overdoped side, and why for overdoped cuprates the superconducting pairing is stabilized by lowering the interaction energy Levallois et al. (2016); Gull and Millis (2012); Fratino et al. (2016).
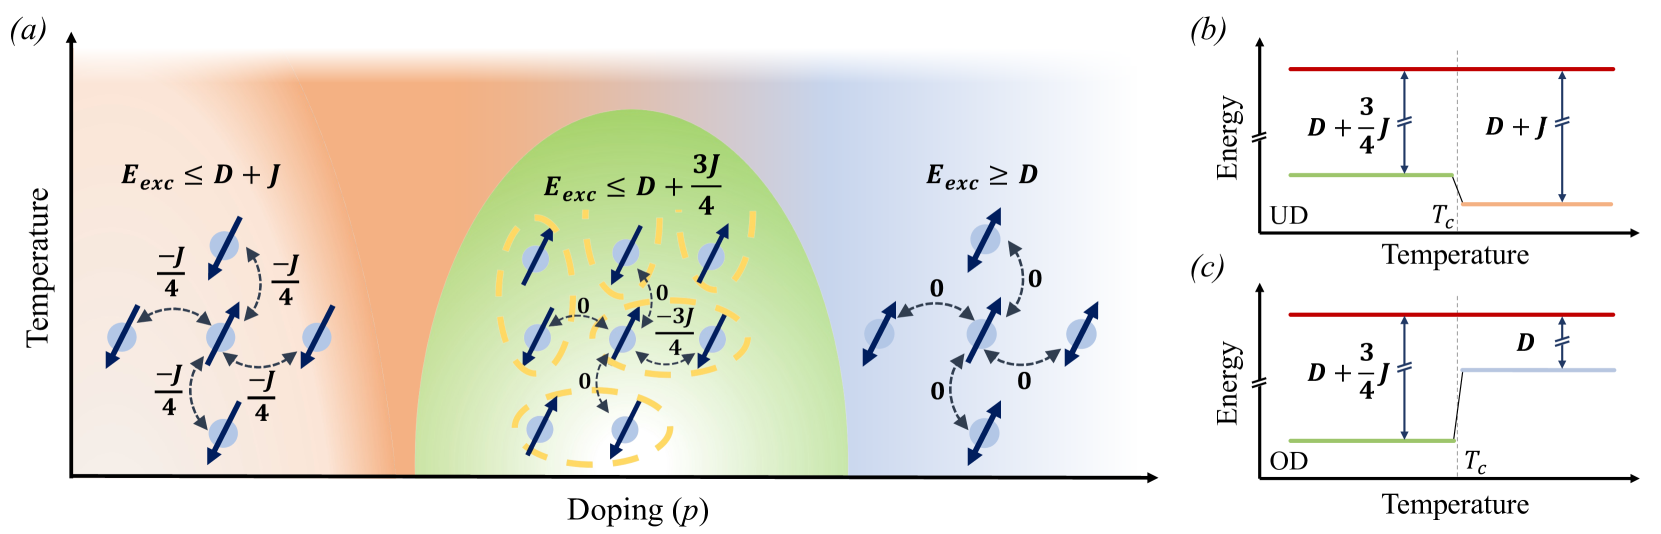
In the absence of interactions with the surrounding sites, the energies of the excitons are (). In what follows we assume for simplicity that is independent of doping and temperature. The excitons can be visualized as a flip of a hole in a orbital to one of the other orbitals. Since creating an exciton breaks the spin-correlations with the neighboring sites, the exciton energy is given by where () is the exchange interaction with the neighboring sites of the ground (excited) state. For , and the symmetry is such that the hopping matrix-element to a nearest-neighbor orbital vanishes. Consequently the exchange interaction with a hole on a neighboring orbital is zero, i.e. so that .
For zero doping due to the anti-ferromagnetic order and taking into account that there are 4 nearest neighbors, and the lower bound corresponds to full spin polarization. The following expressions for refer to the extremal value for each of the given phases. At optimal doping due to the d-wave superconducting order. At very high doping . Increasing temperature at the underdoped side changes the exchange energy from in the superconducting state to in the normal state. Correspondingly the exciton energy decreases by an amount . At the overdoped side changes from in the superconducting state to in the normal state, so that the exciton energy increases by an amount . Since at high temperature gradually diminishes as a function of doping, having and as the extremal values at zero doping and high doping respectively, a doping level exists where has the same value in the normal and superconducting phase. For this doping there is no superconductivity induced shift of the exciton energy. In practice, taking into account the experimental limitations on resolution, the superconductivity induced shift of falls below the resolution limit not only at a single doping level but in a range of dopings which, in view of Fig. 5, overlaps with optimal doping. This state of affairs is depicted in Fig. 6. These effects are strongest for the excitons. For the exciton all these effects are smaller due to mixing with the oxygen-copper charge transfer excitations.
We now return to the question to what extent coupling to excitons plays a role in the pairing mechanism of the cuprates. From the above discussion illustrated in Fig. 6 we can conclude that our observations neither exclude nor favor any of the pairing mechanisms described in the introduction. That said, our experiments expose a strong coupling between charge carriers and excitons. Therefore, it is reasonable to expect that electron-exciton coupling contributes to the energy balance of the different phases, including the part of the phase diagram where superconductivity is observed.
Conclusions
Using RIXS we have observed clear evidence for the coupling of the low-energy conduction electrons in Bi-2212 to excitons. The coupling is visible as a distinct change of the exciton peak at 2 eV when the material becomes superconducting. On the basis of cluster calculations the 2 eV peak is predominantly a exciton. While this doesn’t exclude that there exists coupling to the other excitons, their weak intensity makes those couplings harder to detect. By applying perturbation theory, we can qualitatively understand the experimental temperature dependence at the overdoped side as a renormalization of the excitons, but this model does not explain the change of sign of this effect as a function of doping. In an approach that takes into consideration that the superconducting pairs and the excitons involve the same electrons, we expect a blueshift of the exciton energy smaller than when the material turns superconducting. The change of sign of the superconductivity induced changes from underdoped to overdoped is a natural consequence of the presence (absence) of short-range AF correlations in normal state of the former (latter), which make way for d-wave singlet correlations in the superconducting phase.
Acknowledgments
We thank A. Georges, G. Ghiringelli and X. X. Huang for stimulating discussions. The RIXS experiments have been performed at the ADRESS beamline of the Swiss Light Source at the Paul Scherrer Institut (PSI). We acknowledge funding support from the Swiss National Science Foundation through projects No. 179157 (D.v.d.M.), 178867 (T.S.), and 160765 (T.S.). T.P.D. was supported by the U.S. Department of Energy (DOE), Office of Basic Energy Sciences, Division of Materials Sciences and Engineering, under Contract No. DE-AC02-76SF00515. T.C.A. acknowledges funding from the European Union’s Horizon 2020 research and innovation programme under the Marie Skłodowska-Curie grant agreement No. 701647 (PSI-FELLOW-II-3i program). The work at BNL was supported by the US Department of Energy, office of Basic Energy Sciences, contract No. DOE-sc0012704. Data and materials availability: The datasets generated and analyzed during the current study are available in Ref. Barantani et al. (2022). These will be preserved for 10 years.
Appendix A Experimental methods
Single crystals of Bi2Sr2CaCu2O8-x (Bi-2212) were prepared as described in Ref. Wen et al. (2008) with carrier concentrations (underdoped, K), (optimally doped, K), and (overdoped, K). An additional optimally doped sample (, K) was prepared as described in Ref. Weyeneth et al. (2009).
RIXS spectra were measured at the ADRESS beamline of the Swiss Light Source (Paul Scherrer Institut, Villigen PSI), using polarization of the incoming x-rays with incoming energy resonant at the Cu edge, eV. The scattering angle between the incoming and outgoing x-rays beams was set at 130 degrees. The sample manipulator allowed adjustment of azimutal and polar angles to a momentum transfer of , such that the out-of-plane momentum transfer was a multiple of the reciprocal lattice vector . The outgoing x-rays were detected without resolving the polarization. The energy resolution was eV (as obtained by measuring the elastic line on a tape containing graphite), which is sufficiently precise for measuring the exciton at 2 eV while maintaining good statistics. In order to define the nodal and antinodal directions, the samples were aligned using aa Laue setup. The samples were cleaved at the base temperature ( K) at a pressure of mbar.
For each doping and momentum direction, the spectra were acquired in the temperature range of approximately K below to K above . The temperature was swept at a fixed slow rate of K/min ( K/min for the optimally doped) while continuously sampling the spectra, resulting in 8 to 10 hours temperature scans. We binned the data in intervals of approximately K in temperature. To avoid radiation damage on the focus position of the x-ray beam, the beam was slowly scanned along a line of 50 during the data acquisition. We normalized the spectra to the total counts in the energy range from to eV. The zero energy position was obtained using the following procedure: For each temperature the spectra are fitted to the expression
| (4) | |||||
where describes the zero-energy position of the quasi-elastic peak, the relative energy of all other peaks, and and are the Lorentzian and Gaussian widths of the Voigt profile respectively. An additional weak peak at twice the magnon energy was needed in the fitting procedure to reproduce the asymmetric line-shape in the magnon region.
We used the following method to determine the error bar of the zero energy position . We have simulated the error in fitting due to the statistical noise. To do so, we consider an ideal spectrum given by the fit at low temperature, such that it reproduces the experimental spectrum for a particular doping and momentum transfer. We show the case of the OD 70K, which is representative for other dopings and momenta, all of which have similar features. To simulate the statistical noise we add a random Poissonian noise to the spectrum of equal magnitude as in the experimental data (i.e. we simulated the noise level of counts per channel as ). We then fitted the noisy spectrum with the previous starting parameters and repeated the procedure multiple times to generate a statistically significant sample. We considered 10000 realizations, the result of which corresponds to the distribution shown in Fig 7. For this particular example the distribution has a full width at half maximum meV corresponding to meV where is the standard deviation. This procedure was repeated for each momentum and doping giving the error bars of length in Figs. 3, and 8.
With incident polarization, due to direct re-emission the spectra present a reasonably intense elastic peak, which is convenient since all energies are measured relative to the position of the zero-loss peak. A possible complication arises if, given the finite resolution (in the present case around 130 meV) low energy inelastic features such as phonons also contribute to what we should now interpret as a quasi-elastic peak. If these contributions depend on temperature, this imports a temperature dependence in the quasi-elastic peak, which carries over to a spurious temperature dependence of the energy loss of e.g. the magnon peak and the excitons. Suzuki et al. Suzuki et al. (2018) have reported temperature dependence of the low energy continuum of Bi-2212 at small momentum transfer. On the other hand such contributions were not present in their data for high momentum transfer similar to the momentum values subject of the present study. In fact, if present, a spurious temperature dependence of the quasi-elastic peak will affect both the magnon and the exciton peak in exactly the same way. Here we observe that the temperature dependencies of magnon and exciton energies are completely different (see Fig. 3) and the temperature dependence of the magnon is extremely weak. Together, it indicates the absence of a spurious temperature dependence of the quasi-elastic peak for the high momentum transfers considered here, in accordance with the findings of Suzuki et al. Suzuki et al. (2018).
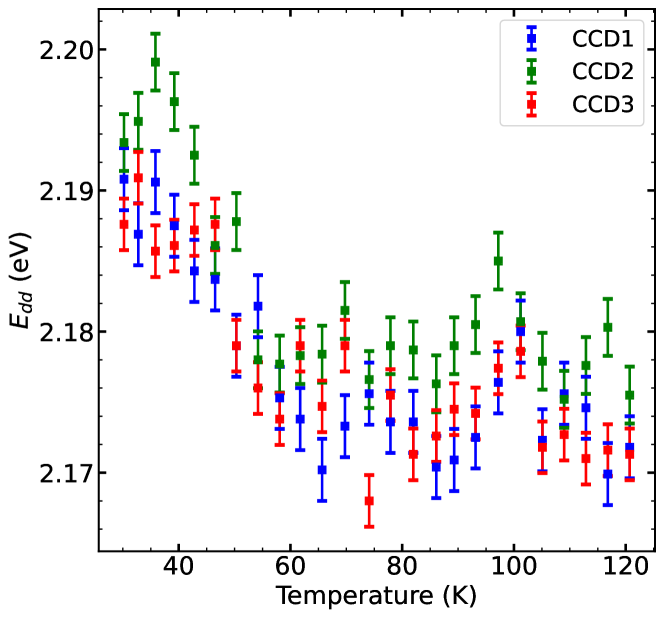
The RIXS spectra are collected by 3 separate CCD detectors. The spectra collected with each detector were analyzed separately. The zero-energy position of each spectrum was determined as detailed before. In Fig. 8 we report the average energy of the exciton region ( eV and eV) for the overdoped sample and momentum transfer , measured with the three detectors. Above K the average energy is almost temperature independent, and below K it gradually shifts to meV higher energy. The observation with three detectors of the same temperature dependence of energy indicates that these features are intrinsic properties of this material. For other momentum transfers and dopings we also observe temperature dependencies of the energy that are qualitatively similar, but the effects are weaker. The focus in this paper is therefore on the temperature shift of the average energy of the manifold.
In Fig. 9 we show the integral function defined as
| (5) |
for the overdoped sample at two temperatures , using the difference spectra reported in Fig. 2 and considering eV. The shape matches up to about 2 eV the RIXS spectra at the same temperature . Above 2 eV falls well below . Taken together this indicates that the temperature evolution is a shift of and while the shift of is significantly smaller.
Appendix B Cluster calculations of the exciton multiplets
The expression for the RIXS intensity is given by the Kramers-Heisenberg formula
| (6) | |||||
| , |
which is the largest resonant diagram at lowest order in the fine structure constant . Here, is the partition function, , are the initial and final state energies and eigenstates, respectively, , are the RIXS intermediate core hole states, is the core hole decay rate, , , are the incident, scattered x-ray polarization vectors, momenta, and energies, respectively, and . The dipole operator is evaluated in the Coulomb or “transverse” gauge , where is the light vector potential, and the dipole approximation is used.
RIXS is obtained via full matrix diagonalization of the generalized Hamiltonian
| (7) |
where the terms in the Hamiltonian are given in terms of second quantized operators that remove, create electrons in orbital in unit cell with spin as follows:
The Coulomb interaction
| (8) |
represent generalized local two-body interactions that can include both core and valence electrons, while the sum of single particle terms can be grouped together as
| (9) |
with the tensor having site energies, crystal fields and spin-orbit contributions (for terms), and hybridization among orbitals ().
We utilize a unit cell consisting of five copper orbitals, three copper core orbitals, and three oxygen ligand orbitals along the and bond directions, giving 14 orbitals per unit cell. We consider a 2-site cluster (28 orbitals) to yield momentum transfer in reciprocal lattice units. The Hilbert space is restricted to contain at most one core hole in the cluster.
The following set of parameters have been used (hole language is employed). All energies are in units of eV. Cu site energies: for , , , orbitals, respectively. O site energies: 2.8 for , , , and 0.8 for , orbitals, where denotes ligand orbital for site in the unit cell. Slater parameters for Cu : , , to approximately give Hubbard and Hund’s . Slater parameters for core Cu – interaction: , , , . Slater parameters for O : , . Core spin-orbit coupling: 10.5. Hybridizations: –, –, –, –. The core hole decay rate .
Finally, the incident photon polarization direction is taken to be along direction ( polarization in the scattering plane), and the outgoing photon is unpolarized. In Fig. 1 of the main text we show the peaks resulting from the calculations and the relative intensity normalized to the exciton.
Appendix C Weak-coupling model for the temperature dependence of the excitons
For a two-dimensional single-band superconductor, the temperature-dependent BCS charge susceptibility at wave-vector and complex energy is
| (10) |
The wave-vectors span the first Brillouin zone, is the Fermi distribution at temperature , and , are the normal and anomalous spectral functions, respectively. The spectral functions depend on the band dispersion measured from the temperature-dependent chemical potential, , and on the temperature-dependent superconducting gap function . They are best expressed in terms of the Bogoliubov excitation energies and coherence factors and , according to and .
For the band dispersion, we use a square-lattice tight-binding model with hopping amplitudes up to the fifth neighbors,
| (11) |
where is the lattice spacing. The parameters are meV, as determined in Norman et al. (1995). At each temperature, we adjust the chemical potential such that the hole density is , where the electron density is
| (12) |
The gap function has symmetry with an empirical temperature dependence that follows closely the numerical result of the BCS gap equation for a two-dimensional -wave superconductor:
| (13) |
where and the -wave gap reads . We set , K, and meV to represent the overdoped sample.
For the exciton spectral function the susceptibility enters via the self-energy correction
| (14) |
where is the unrenormalized energy of the exciton and represents the exciton intrinsic linewidth–mostly due to interaction with the phonons–that we represent phenomenologically with a constant scattering rate eV.
References
- Bednorz and Muller (1986) J. G. Bednorz and K. A. Muller, “Possible high superconductivity in the Ba-La-Cu-O system,” Z. Phys. B: Condens. Matter 64, 189–193 (1986).
- Anderson (1987) Philip W. Anderson, “The Resonating Valence Bond State in La2CuO4 and Superconductivity,” Science 235, 1196–1198 (1987).
- Zaanen et al. (1985) J. Zaanen, G. A. Sawatzky, and J. W. Allen, “Band gaps and electronic structure of transition-metal compounds,” Phys. Rev. Lett. 55, 418–421 (1985).
- Ghijsen et al. (1988) J. Ghijsen, L. H. Tjeng, J. van Elp, H. Eskes, J. Westerink, G. A. Sawatzky, and M. T. Czyzyk, “Electronic structure of Cu2O and CuO,” Phys. Rev. B 38, 11322–11330 (1988).
- Arovas et al. (2022) Daniel P. Arovas, Erez Berg, Steven A. Kivelson, and Srinivas Raghu, “The Hubbard Model,” Annual Review of Condensed Matter Physics 13, 239–274 (2022).
- Jiang and Devereaux (2019) Hong-Chen Jiang and Thomas P. Devereaux, “Superconductivity in the doped Hubbard model and its interplay with next-nearest hopping ,” Science 365, 1424–1428 (2019).
- Anderson (2007) Philip W. Anderson, “Is there glue in cuprate superconductors?” Science 316, 1705–1707 (2007).
- Hirsch (2002) J. E. Hirsch, “Why holes are not like electrons: A microscopic analysis of the differences between holes and electrons in condensed matter,” Phys. Rev. B 65, 184502 (2002).
- Leggett (1999) A. J. Leggett, “A “midinfrared” scenario for cuprate superconductivity,” Proc. Natl. Acad. Sci. U.S.A 96, 8365–8372 (1999).
- Eschrig (2006) Matthias Eschrig, “The effect of collective spin-1 excitations on electronic spectra in high-Tc superconductors,” Adv. Phys. 55, 47–183 (2006).
- Scalapino (2012) D. J. Scalapino, “A common thread: The pairing interaction for unconventional superconductors,” Rev. Mod. Phys. 84, 1383–1417 (2012).
- Bill et al. (2003) A. Bill, H. Morawitz, and V. Z. Kresin, “Electronic collective modes and superconductivity in layered conductors,” Phys. Rev. B 68, 144519 (2003).
- Sawatzky et al. (2009) G. A. Sawatzky, I. S. Elfimov, J. van den Brink, and J. Zaanen, “Heavy-anion solvation of polarity fluctuations in pnictides,” Europhys. Lett. 86, 17006 (2009).
- Yacoby and Girshberg (2016) Y. Yacoby and Y. Girshberg, “Cooper-like Pairing and Energy Gap Induced by Ion Electronic Polarizability,” J. Supercond. Novel Magn. 30, 379–386 (2016).
- Weber et al. (1988) W. Weber, A. L. Shelankov, and X. Zotos, “A Cu d-d excitation model for the pairing in the high-Tc cuprates,” Physica C 153-155, 1305–1306 (1988).
- Zaanen and Oleś (1993) J. Zaanen and A. M. Oleś, “Carriers binding to excitons: Crystal-field excitations in doped Mott-Hubbard insulators,” Phys. Rev. B 48, 7197–7215 (1993).
- Feiner et al. (1992) L. F. Feiner, M. Grilli, and C. Di Castro, “Apical oxygen ions and the electronic structure of the high-Tc cuprates,” Phys. Rev. B 45, 10647–10669 (1992).
- Buda et al. (1994) F. Buda, D.L. Cox, and M. Jarrell, “Random-phase-approximation analysis of orbital- and magnetic-fluctuation- mediated superconductivity in a two-band Hubbard model,” Phys. Rev. B 49, 1255–1268 (1994).
- Holcomb et al. (1994) M. J. Holcomb, J. P. Collman, and W. A. Little, “Optical evidence of an electronic contribution to the pairing interaction in superconducting Tl2Ba2Ca2 Cu3O10,” Phys. Rev. Lett. 73, 2360–2363 (1994).
- Bucci et al. (1995) F. Bucci, C. Castellani, C. Di Castro, and M. Grilli, “Charge fluctuations in the four-band extended Hubbard model,” Phys. Rev. B 52, 6880–6893 (1995).
- Little et al. (2007) W. A. Little, M. J. Holcomb, G. Ghiringhelli, L. Braicovich, C. Dallera, A. Piazzalunga, A. Tagliaferri, and N. B. Brookes, “A determination of the pairing interaction in the high cuprate superconductor Tl2Ba2CaCu2O8 (Tl2212),” Physica C 460-462 I, 40–43 (2007).
- Mazov (2012) L.S. Mazov, “Possible Room-Tc Superconductor with in-plane Ginzburg Sandwich in Cuprate-and Pnictide-like family of Compounds,” Physics Procedia 36, 735–740 (2012).
- Oleś et al. (2019) Andrzej M. Oleś, Krzysztof Wohlfeld, and Giniyat Khaliullin, “Orbital Symmetry and Orbital Excitations in High-Tc Superconductors,” Condens. Matter 4, 46 (2019).
- Maksimov et al. (2010) E. G. Maksimov, M. L. Kulić, and O. V. Dolgov, “Bosonic Spectral Function and the Electron-Phonon Interaction in HTSC Cuprates,” Adv. Condens. Matter Phys. 2010, 1–64 (2010).
- Little (1964) W. A. Little, “Possibility of Synthesizing an Organic Superconductor,” Phys. Rev. 134, A1416–A1424 (1964).
- Ginzburg (1970) V. L. Ginzburg, “The problem of high-temperature superconductivity. II,” Sov. Phys. Usp. 13, 335–352 (1970).
- Allender et al. (1973) David Allender, James Bray, and John Bardeen, “Model for an Exciton Mechanism of Superconductivity,” Phys. Rev. B 7, 1020–1029 (1973).
- Wang et al. (2011) Xin Wang, Hung The Dang, and Andrew J. Millis, “ orbital in high- cuprates: Excitonic spectrum, metal-insulator phase diagram, optical conductivity, and orbital character of doped holes,” Phys. Rev. B 84, 014530 (2011).
- Kuiper et al. (1998) Pieter Kuiper, J.-H. Guo, Conny Såthe, L.-C. Duda, Joseph Nordgren, J. J. M. Pothuizen, F. M. F. de Groot, and G. A. Sawatzky, “Resonant X-Ray Raman Spectra of Cu Excitations in ,” Phys. Rev. Lett. 80, 5204–5207 (1998).
- Ghiringhelli et al. (2004) G. Ghiringhelli, N. B. Brookes, E. Annese, H. Berger, C. Dallera, M. Grioni, L. Perfetti, A. Tagliaferri, and L. Braicovich, “Low Energy Electronic Excitations in the Layered Cuprates Studied by Copper Resonant Inelastic X-Ray Scattering,” Phys. Rev. Lett. 92, 117406 (2004).
- Ghiringhelli et al. (2007) G. Ghiringhelli, N. B. Brookes, C. Dallera, A. Tagliaferri, and L. Braicovich, “Sensitivity to hole doping of Cu resonant spectroscopies: Inelastic x-ray scattering and photoemission of LaSrCuO4,” Phys. Rev. B 76, 085116 (2007).
- Moretti Sala et al. (2011) M. Moretti Sala, V. Bisogni, C. Aruta, G. Balestrino, H. Berger, N. B. Brookes, G. M. De Luca, D. Di Castro, M. Grioni, M. Guarise, P. G. Medaglia, F. Miletto Granozio, M. Minola, P. Perna, M. Radovic, M. Salluzzo, T. Schmitt, K. J. Zhou, L. Braicovich, and G. Ghiringhelli, “Energy and symmetry of dd excitations in undoped layered cuprates measured By Cu resonant inelastic x-ray scattering,” New J. Phys. 13, 043026 (2011).
- Dean et al. (2013) M. P. M. Dean, A. J. A. James, R. S. Springell, X. Liu, C. Monney, K. J. Zhou, R. M. Konik, J. S. Wen, Z. J. Xu, G. D. Gu, V. N. Strocov, T. Schmitt, and J. P. Hill, “High-Energy Magnetic Excitations in the Cuprate Superconductor Bi2Sr2CaCuO8+δ: Towards a Unified Description of Its Electronic and Magnetic Degrees of Freedom,” Phys. Rev. Lett. 110, 147001 (2013).
- Dean et al. (2014) M. P. M. Dean, A. J. A. James, A. C. Walters, V. Bisogni, I. Jarrige, M. Hücker, E. Giannini, M. Fujita, J. Pelliciari, Y. B. Huang, R. M. Konik, T. Schmitt, and J. P. Hill, “Itinerant effects and enhanced magnetic interactions in Bi-based multilayer cuprates,” Phys. Rev. B 90, 220506(R) (2014).
- Axe and Shirane (1973) J. D. Axe and G. Shirane, “Influence of the Superconducting Energy Gap on Phonon Linewidths in Nb3Sn,” Phys. Rev. Lett. 30, 214–216 (1973).
- Shapiro et al. (1975) S. M. Shapiro, G. Shirane, and J. D. Axe, “Measurements of the electron-phonon interaction in Nb by inelastic neutron scattering,” Phys. Rev. B 12, 4899–4908 (1975).
- Altendorf et al. (1993) E. Altendorf, X. K. Chen, J. C. Irwin, R. Liang, and W. N. Hardy, “Temperature dependences of the 340-, 440-, and 500 cm-1 Raman modes of YBa2Cu3Oy for ,” Phys. Rev. B 47, 8140–8150 (1993).
- Zeyher and Zwicknagl (1990) R. Zeyher and G. Zwicknagl, “Superconductivity-induced phonon self-energy effects in high superconductors,” Z. Phys. B: Condens. Matter 78, 175–190 (1990).
- Strocov et al. (2010) V. N. Strocov, T. Schmitt, U. Flechsig, T. Schmidt, A. Imhof, Q. Chen, J. Raabe, R. Betemps, D. Zimoch, J. Krempasky, X. Wang, M. Grioni, A. Piazzalunga, and L. Patthey, “High-resolution soft X-ray beamline ADRESS at the Swiss Light Source for resonant inelastic X-ray scattering and angle-resolved photoelectron spectroscopies,” J. Synchrotron Radiat. 17, 631–643 (2010).
- Ghiringhelli et al. (2006) G. Ghiringhelli, A. Piazzalunga, C. Dallera, G. Trezzi, L. Braicovich, T. Schmitt, V. N. Strocov, R. Betemps, L. Patthey, X. Wang, and M. Grioni, “SAXES, a high resolution spectrometer for resonant x-ray emission in the 400–1600 eV energy range,” Rev. Sci. Instrum. 77, 113108 (2006).
- Lee et al. (2014) J. J. Lee, B. Moritz, W. S. Lee, M. Yi, C. J. Jia, A. P. Sorini, K. Kudo, Y. Koike, K. J. Zhou, C. Monney, V. Strocov, L. Patthey, T. Schmitt, T. P. Devereaux, and Z. X. Shen, “Charge-orbital-lattice coupling effects in the excitation profile of one-dimensional cuprates,” Phys. Rev. B 89, 041104(R) (2014).
- Peng et al. (2015) Y. Y. Peng, M. Hashimoto, M. M. Sala, A. Amorese, N. B. Brookes, G. Dellea, W.-S. Lee, M. Minola, T. Schmitt, Y. Yoshida, K.-J. Zhou, H. Eisaki, T. P. Devereaux, Z.-X. Shen, L. Braicovich, and G. Ghiringhelli, “Magnetic excitations and phonons simultaneously studied by resonant inelastic x-ray scattering in optimally doped ,” Phys. Rev. B 92, 064517 (2015).
- Oliveira et al. (2003) F. A. C. Oliveira, L. A. Cury, A. Righi, R. L. Moreira, P. S. S. Guimaraes, F. M. Matinaga, M. A. Pimenta, and R. A. Nogueira, “Temperature effects on the vibronic spectra of BEH-PPV conjugated polymer films,” The Journal of Chemical Physics 119, 9777–9782 (2003).
- Ahn and Nagaosa (2021) Junyeong Ahn and Naoto Nagaosa, “Superconductivity-induced spectral weight transfer due to quantum geometry,” Phys. Rev. B 104, L100501 (2021).
- Chen and Huang (2021) Weipeng Chen and Wen Huang, “Quantum-geometry-induced intrinsic optical anomaly in multiorbital superconductors,” Phys. Rev. Research 3, L042018 (2021).
- Husain et al. (2019) Ali A. Husain, Matteo Mitrano, Melinda S. Rak, Samantha Rubeck, Bruno Uchoa, Katia March, Christian Dwyer, John Schneeloch, Ruidan Zhong, G. D. Gu, and Peter Abbamonte, “Crossover of Charge Fluctuations across the Strange Metal Phase Diagram,” Phys. Rev. X 9, 041062 (2019).
- Levallois et al. (2016) J. Levallois, M. K. Tran, D. Pouliot, C. N. Presura, L. H. Greene, J. N. Eckstein, J. Uccelli, E. Giannini, G. D. Gu, A. J. Leggett, and D. van der Marel, “Temperature-Dependent Ellipsometry Measurements of Partial Coulomb Energy in Superconducting Cuprates,” Phys. Rev. X 6, 031027 (2016).
- Kotliar and Liu (1988) Gabriel Kotliar and Jialin Liu, “Superexchange mechanism and d-wave superconductivity,” Phys. Rev. B 38, 5142–5145 (1988).
- Zhang et al. (1988) F. C. Zhang, C. Gros, T. M. Rice, and H. Shiba, “A renormalised Hamiltonian approach to a resonant valence bond wavefunction,” Superconductor Science and Technology 1, 36–46 (1988).
- Yokoyama and Shiba (1988) Hisatoshi Yokoyama and Hiroyuki Shiba, “Variational Monte-Carlo Studies of Superconductivity in Strongly Correlated Electron Systems,” Journal of the Physical Society of Japan 57, 2482–2493 (1988).
- Gros (1988) Claudius Gros, “Superconductivity in correlated wave functions,” Phys. Rev. B 38, 931–934 (1988).
- Scalapino and White (1998) D. J. Scalapino and S. R. White, “Superconducting condensation energy and an antiferromagnetic exchange-based pairing mechanism,” Phys. Rev. B 58, 8222–8224 (1998).
- Maier et al. (2004) Th. A. Maier, M. Jarrell, A. Macridin, and C. Slezak, “Kinetic Energy Driven Pairing in Cuprate Superconductors,” Phys. Rev. Lett. 92, 027005 (2004).
- Toschi et al. (2005) A. Toschi, M. Capone, and C. Castellani, “Energetic balance of the superconducting transition across the BCS—Bose Einstein crossover in the attractive Hubbard model,” Phys. Rev. B 72, 235118 (2005).
- Haule and Kotliar (2007) K. Haule and G. Kotliar, “Optical conductivity and kinetic energy of the superconducting state: A cluster dynamical mean field study,” Europhysics Letters 77, 27007 (2007).
- Gull and Millis (2012) E. Gull and A. J. Millis, “Energetics of superconductivity in the two-dimensional Hubbard model,” Phys. Rev. B 86, 241106(R) (2012).
- Fratino et al. (2016) L. Fratino, P. Sémon, G. Sordi, and A.-M. S. Tremblay, “An organizing principle for two-dimensional strongly correlated superconductivity,” Scientific Reports 6, 22715 (2016).
- Molegraaf et al. (2002) H. J.A. Molegraaf, C Presura, D. Van der Marel, P H Kes, and M Li, “Superconductivity-induced transfer of in-plane spectral weight in Bi2Sr2CaCu2O8+δ,” Science 295, 2239–2241 (2002).
- Deutscher et al. (2005) Guy Deutscher, Andrés Felipe Santander-Syro, and Nicole Bontemps, “Kinetic energy change with doping upon superfluid condensation in high-temperature superconductors,” Phys. Rev. B 72, 092504 (2005).
- Gedik et al. (2005) N. Gedik, M. Langner, J. Orenstein, S. Ono, Yasushi Abe, and Yoichi Ando, “Abrupt Transition in Quasiparticle Dynamics at Optimal Doping in a Cuprate Superconductor System,” Phys. Rev. Lett. 95, 117005 (2005).
- Carbone et al. (2006) F. Carbone, A. B. Kuzmenko, H. J. A. Molegraaf, E. van Heumen, V. Lukovac, F. Marsiglio, D. van der Marel, K. Haule, G. Kotliar, H. Berger, S. Courjault, P. H. Kes, and M. Li, “Doping dependence of the redistribution of optical spectral weight in Bi2Sr2CaCuO8+δ,” Phys. Rev. B 74, 064510 (2006).
- Giannetti et al. (2011) Claudio Giannetti, Federico Cilento, Stefano Dal Conte, Giacomo Coslovich, Gabriele Ferrini, Hajo Molegraaf, Markus Raichle, Ruixing Liang, Hiroshi Eisaki, Martin Greven, Andrea Damascelli, Dirk van der Marel, and Fulvio Parmigiani, “Revealing the high-energy electronic excitations underlying the onset of high-temperature superconductivity in cuprates,” Nat. Commun. 2, 353 (2011).
- Barantani et al. (2022) F. Barantani, M. K. Tran, I. Madan, I. Kapon, N. Bachar, T. C. Asmara, E. Paris, Y. Tseng, W. Zhang, Y. Hu, E. Giannini, G. Gu, T. P. Devereaux, C. Berthod, F. Carbone, T. Schmitt, and D. van der Marel, “Open Data,” doi:10.26037/yareta:e6a76wuxsfa3vpcluyei5k2kru (2022).
- Wen et al. (2008) J. S. Wen, Z. J. Xu, G. Y. Xu, M. Hucker, J. M. Tranquada, and G. D. Gu, “Large Bi-2212 single crystal growth by the floating-zone technique,” J. Cryst. Growth 310, 1401–1404 (2008).
- Weyeneth et al. (2009) S. Weyeneth, T. Schneider, and E. Giannini, “Evidence for Kosterlitz-Thouless and three-dimensional critical behavior in ,” Phys. Rev. B 79, 214504 (2009).
- Suzuki et al. (2018) Hakuto Suzuki, Matteo Minola, Yi Lu, Yingying Peng, Roberto Fumagalli, Emilie Lefrançois, Toshinao Loew, Juan Porras, Kurt Kummer, Davide Betto, Shigeyuki Ishida, Hiroshi Eisaki, Cheng Hu, Xingjiang Zhou, Maurits W. Haverkort, Nicholas B. Brookes, Lucio Braicovich, Giacomo Ghiringhelli, Matthieu Le Tacon, and Bernhard Keimer, “Probing the energy gap of high-temperature cuprate superconductors by resonant inelastic x-ray scattering,” npj Quantum Materials 2018 3:1 3, 1–8 (2018).
- Norman et al. (1995) M. R. Norman, M. Randeria, H. Ding, and J. C. Campuzano, “Phenomenological models for the gap anisotropy of Bi2Sr2CaCu2O8 as measured by angle-resolved photoemission spectroscopy,” Phys. Rev. B 52, 615–622 (1995).