A mathematical model for phenotypic heterogeneity in breast cancer with implications for therapeutic strategies
Abstract
Inevitably, almost all cancer patients develop resistance to targeted therapy. Intratumor heterogeneity (ITH) is a major cause of drug resistance. Mathematical models that explain experiments quantitatively is useful in understanding the origin of ITH, which then could be used to explore scenarios for efficacious therapy. Here, we develop a mathematical model to investigate ITH in breast cancer by exploiting the observation that HER2+ and HER2- cells could divide symmetrically or asymmetrically. Our predictions for the evolution of cell fractions are in quantitative agreement with single-cell experiments. Remarkably, the colony size of HER2+ cells emerging from a single HER2- cell (or vice versa), which occurs in about four cell doublings, agrees perfectly with experimental results, without tweaking any parameter in the model. The theory quantitatively explains experimental data on the responses of breast cancer tumor under different treatment protocols. We then used the model to predict that, not only the order of two drugs, but also the treatment period for each drug and the tumor cell plasticity could be manipulated to improve the treatment efficacy. Mathematical models, when integrated with data on patients, make possible exploration of a broad range of parameters readily, which might provide insights in devising effective therapies.
Introduction
Nearly 10 million people died of cancer worldwide in 2020Sung2021 , despite innovations in the development of many novel drugs. In principle, the advent of new technologies ought to make drugs highly efficacious while minimizing toxicity. The next-generation sequencing allows us to design personalized therapy, targeting specific genetic variants which drive disease progressionross2014new ; ellis2009resistance . However, drug resistance ultimately occurs, regardless of targeted therapeutic protocols, which poses a formidable challenge for oncologistsahronian2017strategies . A deeper understanding of the underlying resistance mechanism could be useful in controlling the tumor burden and its relapse.
Intratumor heterogeneity (ITH), which denotes the coexistence of cancer cell subpopulations with different genetic or phenotypic characteristics in a single tumor almendro2013cellular ; burrell2013causes , is the prominent cause of drug resistance and recurrence of cancersmarusyk2012intra ; dagogo2018tumour ; Filho21CancerDiscovery . With the development of deep-sequencing technologies and sequencing at the single cell levelkoboldt2013next ; shapiro2013single , intratumor genetic heterogeneity has been observed in many cancer types gerlinger2012intratumor ; vogelstein2013cancer ; de2014spatial ; navin2011tumour ; swanton2012intratumor ; li2019share . Meanwhile, increasing evidence shows that phenotypic variations in tumor cells (without clear genetic alterations) also play a crucial role in cancer development, and is presumed to be one of the major reasons for the development of drug resistance in cancer therapymeacham2013tumour ; marusyk2012intra . However, the underlying mechanism of ITH induced by the phenotypic variability of cancer cells is still elusive, which represents an obstacle for the development of efficient treatments for cancer patientsaltrock2015mathematics .
The phenotypic heterogeneity of normal cells can emerge from cellular plasticity, which is the ability of a cell to adopt different identities. Cellular plasticity is widespread in multicellular organisms, dictating the development of organism, wound repair and tissue regenerationmoore2006stem ; reya2001stem ; blanpain2014plasticity . One of the best known examples is the differentiation hierarchies in stem cells, which leads to the production of progenitor cells, followed by the mature differentiated cellsjopling2011dedifferentiation ; gupta2019phenotypic .
It has been proposed that cancer might be derived from cancer stem (or initiating) cells (CSCs). The CSCs are similar to normal stem cell, but possess the ability to produce all cell types found in a tumor sample, resulting in ITHal2003prospective ; clevers2011cancer ; kreso2014evolution . However, the prospects of a hierarchical organization, and also the unidirectional differentiation of CSCs have been challenged by recent experimental observationsgupta2011stochastic ; chaffer2011normal ; shackleton2009heterogeneity ; quintana2010phenotypic . Some ‘differentiated’ cancer cells are capable of switching back to the CSCs in breast cancer gupta2011stochastic ; chaffer2011normal . Melanoma cells do not show any hierarchically organized structure as cells are capable of switching between different phenotypes reversiblyshackleton2009heterogeneity ; quintana2010phenotypic . Several models that assume reversible state transitions have been proposed to explain the observed stable equilibrium among cancer cell subpopulations with different phenotypesgupta2011stochastic ; zhou2014nonequilibrium . However, a detailed understanding of the underlying mechanism driving the cell state transition is still lacking, as most previous experimental observations are based on measurements from bulk cell populationsgupta2011stochastic ; chaffer2011normal ; quintana2010phenotypic .
A recent insightful experiment tracked the evolution of a single circulating tumor cell (CTC) derived from estrogen-receptor (ER)-positive/human epidermal growth factor receptor 2 (HER2)-negative (ER+/HER2-) breast cancer patients in vitrojordan2016her2 . Surprisingly, HER2+ cells (with expression of HER2) emerge from a cell colony grown from a single HER2- cell within four cell doublings and vice versa. The single-cell level experiment demonstrates that reversible transitions occurred between the two breast cancer cell types, thus providing a clue to understanding the nature of cancer cell plasticity observed in this and other experimentsgupta2011stochastic ; chaffer2011normal ; quintana2010phenotypic ; jordan2016her2 . Because normal stem cell can differentiate into non-stem cells through asymmetric cell divisionjopling2011dedifferentiation , it is possible that cancer cells might also change their identity by asymmetric divisiongranit2018regulation , which is a potential cause of ITH.
We noticed that the emergence of an altered cell phenotype is to be coupled to cell division, as indicated by the experiments that a cell of a specific genotype produces daughter cells with an altered phenotypejordan2016her2 . Based on this observation, we developed a theoretical model to describe the establishment of ITH from a single type of breast CTCs. In quantitative agreement with experiments, our model captures the tumor growth dynamics under different initial conditions. It also naturally explains the emergence and evolution of ITH, initiated from a single cell type, as discovered in a recent experimentjordan2016her2 . Without adjusting any free parameter in the model, we predict the evolution of cell fractions and also the colony size for the appearance of HER2+ (HER2-) cell types starting from a single HER2- (HER2+) cell. Remarkably, the predictions agree perfectly with the experimental observations. As a consequence of ITH, drug resistance develops rapidly, which we also reproduce quantitatively. By exploring a range of parameters in the mathematical model, we found that several factors strongly influence the growth dynamics of the tumor. The insights from our study may be useful in devising effective therapiessharma2010chromatin ; jordan2016her2 .
Results
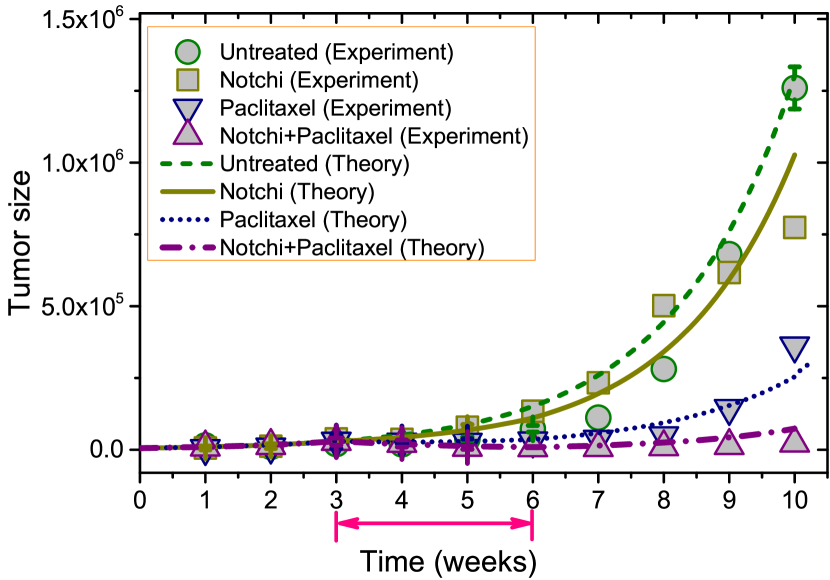
Drug response in a heterogeneous breast cancer cell population: To set the stage for the mathematical model, we first summarize the results of experiments. It is known that HER2+ cells appear in patients initially diagnosed with ER+/HER2- breast cancer during treatmentarteaga2014erbb ; houssami2011her2 . Although each cell subpopulation is sensitive to a specific drug, the heterogeneous tumor shows varying responses for distinct treatment protocols (see Fig. 1 as an example). The size of an untreated tumor increases rapidly (see the green circles), illustrating that a mixture of two cell types together has the ability to promote tumor growth. A clear response is noted when Paclitaxel (targeting HER2+ cells) is utilized, which results in reduced tumor growth (see the navy down triangles) during the treatment. Surprisingly, the tumor continues to grow rapidly, with no obvious response, if treated by Notchi inhibitor (see the dark yellow squares). This is unexpected as the growth of HER2- cells (sensitive to Notchi inhibitor) is supposed to be inhibited by the drug. Finally, the combination therapy with both the drugs, Paclitaxel and Notchi inhibitor, administered to the tumors simultaneously effectively delays the tumor recurrence (see the violet up triangles). However, as both drugs have adverse toxic side effects on normal tissueskim2001vivo ; tolcher2012phase , the use of the two drugs simultaneously might not be advisable. These observations suggest that instead of developing new efficacious drugs, more could be done to optimize the current treatment methodseisenhauer2021connecting , which requires an understanding of the drug resistance mechanism, and evolutionary dynamics of each subpopulations quantitatively. Here, we develop a theoretical model (see Fig. 2a for the illustration of the model) to explain the occurrence of phenotypic heterogeneity in breast cancer, and explore diverse responses under different drug treatments (Fig. 1).
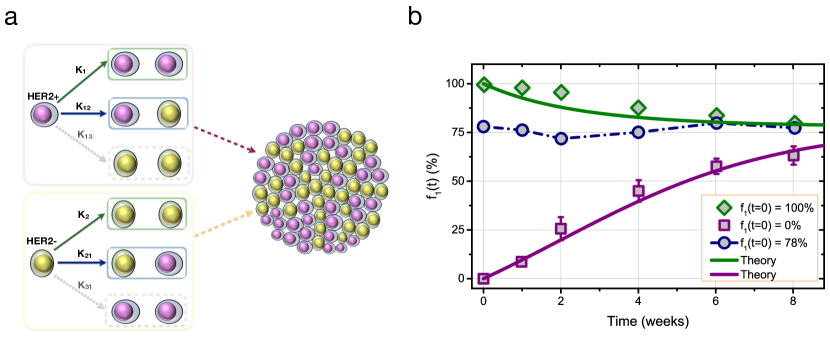
Phenotypic equilibrium in a heterogeneous cancer cell population: As mentioned above, it is found that HER2+ and HER2- breast cancer cells transition from one phenotype to anotherarteaga2014erbb . To demonstrate the observed cellular plasticity, fluorescence-activated cell sorting (FACS)-purified HER2+ and HER2- cells were grown in culture for eight weeks independently in the experiments (see SI for more experimental details)jordan2016her2 . Surprisingly, HER2- (HER2+) cell, naturally emerges from the initial HER2+ (HER2-) cell seeding within four weeks. The time course of the HER2+ cell fraction, , is shown in Fig. 2b for different initial conditions. The fraction decreases slowly, reaching a plateau with after eight weeks of growth (see the green diamonds in Fig. 2b) starting exclusively from HER2+ cells. On the other hand, increases to (without reaching a plateau) from zero rapidly during the same time period, if the cell colony is seeded only from HER2- cells (see the violet squares in Fig. 2b). Finally, the HER2+ cell faction, , almost does not change with time if the initial population is a mixture of both cell types derived from the parental cultured CTCs directly (see the navy circles in Fig. 2b). Therefore, a steady state level (with , the value in the parental cultured CTCs) is established between the two different cell phenotypes at long times, irrespective of the initial cell fraction.
To understand the experimental findings summarized in Fig. 2b, we developed a mathematical model in which the cell plasticity is coupled to cell division, as illustrated in Fig. 2a (see SI for additional details). We first assume an equal rate for the production of HER2- from HER2+ and vice versa. We also neglected the symmetric division (, ), one cell producing two identical daughter cells of the other type, because they rarely occurjordan2016her2 . We found that the two rates ( and ) are small (see the following discussions), and it is not necessary to give different values in order to explain all the experimental results. With these assumptions, Eq. (S3) in the SI can be simplified as,
| (1) |
where is the fraction of HER2+ cell in the whole population, and . Given the initial condition, , we find that from Eq. (1) directly. Therefore, the parameter value per week is obtained using the first two data points from the experiments starting with only HER2- cells (see the violet squares in Fig. 2b). Finally, the value of can be calculated from Eq. (S5) in the SI, which leads to given the stable equilibrium condition () found in the two cell populations in experiments (see Fig. 2b). Hence, the time course of can be calculated by solving Eq. (1), given any initial condition, , (see the two examples illustrated in Fig. 2b by green and violet solid lines). Our theoretical predictions agree quantitatively with experiments, which is interesting considering that we only used two experimental data points. We also found that the cell fraction conversion from HER2+ to HER2- is very slow, while the reverse process is rapid (see Fig. S1 and discussion in the SI).
Growth dynamics of cancer cell populations: The CTCs of HER2+ have a higher proliferation rate compared to HER2-, as noted both in in vitro and in vivo experiments (see the green and blue symbols in Fig. S2 in the SI). It is consistent with the predictions of our model, which shows that the rate difference, , between the two cell types. Combined with the assumption that , it also explains both the fast increase in for the case when growth is initiated from HER2- cells, and the slowly decay of as initial condition is altered (Fig. 2b). The different dynamics of HER2+ cell is also associated with it being a more aggressive phenotype, including increased invasiveness, angiogenesis and reduced survivaldean2008her2 ; carey2006race .
To understand the growth dynamics of the cell populations as a function of initial conditions (Fig. S2) quantitatively, we need to determine either or . The other rate constant can be calculated using, . Using or , the growth dynamics can be derived directly from Eqs. (S1) - (S2) in the SI with the condition where and are the population sizes of the two cell types. The model quantitatively describes the growth behaviors of the tumor using only (see the green and navy solid lines in Fig. S1 in the SI) as an unknown parameter. Note that implies that . We can also predict the growth dynamics at different initial conditions, which could be tested in similar experiments. From the values of the rate constants, we would expect that the frequency for symmetric cell division (the two daughter cells are identical to the parent cell) is much higher than the asymmetric case for both the cell types (). This prediction could be tested using single cell experiments.
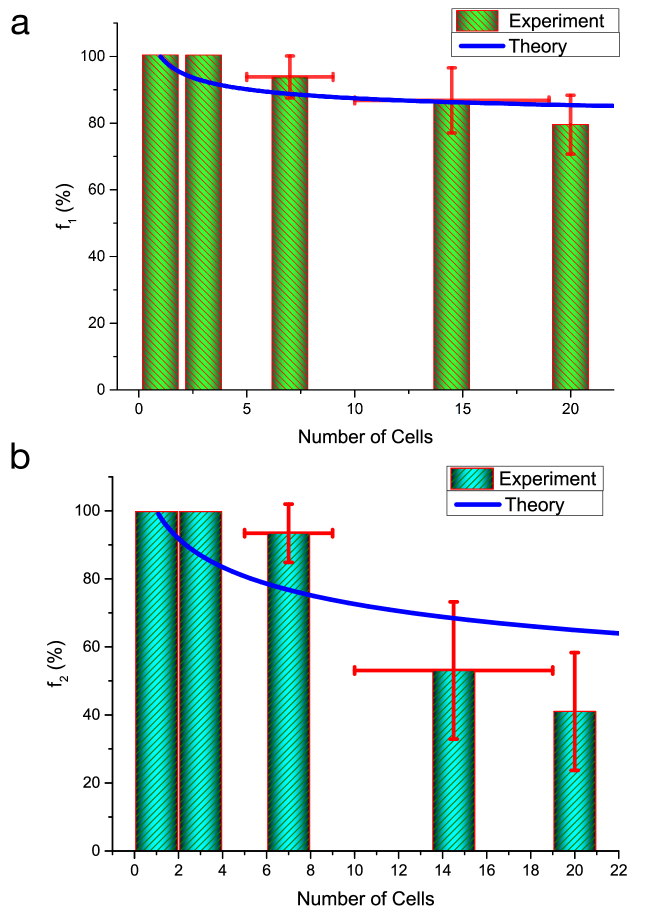
Cancer cell plasticity observed in single cell experiments: To further validate the model, we calculated the percentage of HER2+/HER2- cells as a function of the cell colony size starting from a single HER2+ or HER2- cell. The sizes of the cell colony have been measured in experiments (see the histograms in Fig. 3)jordan2016her2 . From Eqs. (S1) - (S2) in the SI, we computed the HER2+ (HER2-) cell fraction, , as a function of the cell colony size with the initial conditions, and ( and ) using the same parameter values as given above. Our theoretical results (see the solid line in Figs. 3a and 3b) are in good agreement with the experimental observations without adjusting any parameter. We also found that the HER2- cell fraction () decreases faster than the HER2+ cell fraction () as a function of the colony size (), which is due to the higher symmetric division rate () of HER2+ cells.
Similarly, based on Eqs. (S1)–(S2) in the SI or derived from the solid lines in Figs. 3a and 3b directly, we calculated the cell colony size , corresponding to the emergence of HER2+ cell starting from a single HER2- cell, and vice versa. The value of is around 5 and 8 obtained from our model for HER2+ and HER2- cells, respectively. And the experimental values are found to be 5 to 9 cells, which agrees well with our theoretical predictions. Therefore, the model explains the experimental observation that one cell phenotype can emerge from the other spontaneously after four cell divisions.
Quantitative description for the drug responses of HER2+ and HER2- cell populations: We next investigated the drug response in a heterogeneous population in (Fig. 1) using our model. Parameter values that are similar to the ones used to describe the experimental results in vitro are used but with minimal adjustments in order to capture the tumor growth observed in in vivo experiments. We rescaled the parameters and by a factor (2.06), which leads to with or (see Table 1 in the SI). With these values, we found that the tumor growth dynamics in vivo is recapitulated for the untreated tumor (see the green circles and dashed line in Fig. 1).
HER2+ cells have a higher proliferation rate (see Fig. S2 in the SI), and is sensitive to cytotoxic/oxidative stress (such as Paclitaxel treatment) while the HER2- cell shows a negligible response to Paclitaxel. On the other hand, Notch and DNA damage pathways are activated in the HER2- cell leading to sensitivity to Notch inhibition. However, the HER2+ cells are resistant to drugs for Notch inhibitionjordan2016her2 . To assess the influence of drugs on tumor growth, we set the effective growth rate () of symmetric cell division to (the negative sign mimics the higher death rate compared to the birth rate) when the drug, Paclitaxel (Notchi inhibitor), is utilized during treatment. We did not change the values of the asymmetric division rate constants, and .
Following the experimental protocol, we first let the tumor grow from a parental CTCs ( of HER2+ and of HER2- cells) with an initial size taken at week one. We then mimicked drug treatment from the third week to the sixth week. Surprisingly, our theory describes the growth dynamics of the heterogeneous tumor for different drug treatments well (see the different lines in Fig. 1). Our model successfully captured the inhibition of tumor growth under either Paclitaxel or the combination of Paclitaxel and Notchi inhibitor. Also the weak response of tumor under the treatment of Notchi inhibitor also emerges from our model naturally.
To understand the three distinct responses of the tumors to the drug treatments, shown in Fig. 1 further, we computed the time dependence of the tumor size in the first six weeks derived from our model with the treatment of either Notchi inhibitor or Paclitaxel (see Figs. S3a and S3b in the SI). The tumor continues to grow rapidly without showing any clear response when treated with Notchi inhibitor (see the symbols in navy in Fig. S3a), inhibiting the growth of HER2- cells. Although unexpected, the observed response can be explained from the cellular composition of the tumor. The fraction of HER2+ cells is high () before drug treatment, and it increases monotonically to even higher values () during treatment, as shown in Fig. S3c in the SI. Considering the proliferation rate of HER2+ cells is higher than HER2- cells, it is clear that tumor response under Notchi inhibitor only targets a minority of the tumor cell population and its reduction can be quickly replenished by the rapid growth of HER2+ (see the simple illustration in Fig. S3e under the treatment of Notchi inhibitor). Such a weak response is explained directly from the mean fitness, the growth rate , landscape of the population, (see Fig. S4 and detailed discussion in the SI).
In contrast to the negligible effect of Notchi inhibitor to the progression of the heterogeneous tumor, Paclitaxel treatment that targets the HER2+ cell leads to a clear reduction in the tumor size, and delays cancer recurrence (see Fig. S3b in the SI). Such a response is due to the high fraction of the HER2+ cell in the tumor. It leads to the slowly growing of HER2- cells, which cannot compensate for the quick loss of HER2+ cells at the start of the treatment (see the rapid decay of HER2+ cell fraction in Fig. S3d and Fig. S3e for illustration). However, the tumor recovers the fast growing phase in the fourth week (see Fig. S3b) after the drug is used, corresponding to the time when the fraction of HER2+ cell reaches around (derived from our model with , and see also Fig. S3d). Once the fraction of HER2+ cells decreases to small values, the proliferation of resistant HER2- cells can compensate for the loss of HER2+ cells. Just as discussed above, such a response can also be seen directly from the fitness landscape of the population under treatment of Paclitaxel (see Fig. S4 and detailed discussion in the SI).
The fraction of HER2+ cells quickly recovers to the value in the stationary state after drug removal (see Figs. S3c and S3d), and the tumor grows aggressively again (see Fig. 1 and Fig. S3e for illustration). Therefore, the progression of the heterogeneous tumor cannot be controlled by a single drug, as demonstrated in the experiments, explained here quantitatively.
Sequential treatment strategy: Our theory, and more importantly experiments, show that the utilization of two drugs simultaneously could significantly delay the recurrence of tumors compared to the treatments using only a single drug of either type (see Fig. 1). However, the quantity of drugs used in the former protocol is much higher than in the latter case. Also, both drugs (Paclitaxel and Notchi inhibitor) have strong toxic side effects on normal tissueskim2001vivo ; tolcher2012phase . In the following, we consider a sequential treatment strategy with one drug followed by the treatment with the other, which would reduce the quantity of drugs used, and possibly reduce the toxic side effectslin2020using .
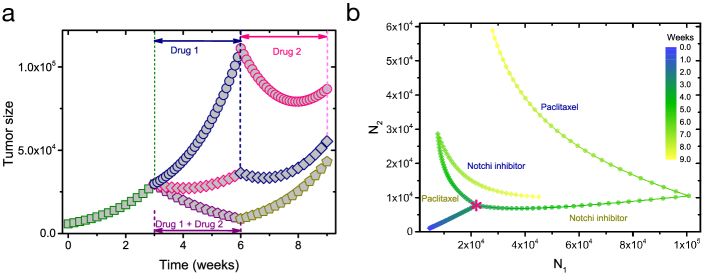
In the sequential treatment, there are two alternative methods depending on the order in which the drugs are administered. We first let the tumor grows till the third week, and then apply the first drug, Notchi inhibitor (Paclitaxel), from the third to the sixth week followed by the utilization of the second drug, Paclitaxel (Notchi inhibitor), from the sixth to the ninth week. We used the same parameter values as taken in Fig. 1. Interestingly, we predict a dramatic difference between the responses of the tumors to the two treatment methods (see Fig 4a). The tumor size shows no clear response to the treatment by Notchi inhibitor, increasing rapidly until Paclitaxel is used (see the circles in navy in Fig. 4a and a schematic illustration in the upper panel of Fig. 4c). From the phase trajectory (see the circles in Fig. 4b), a rapid increase of HER2+ cell population () is found while HER2- cell population () decays slowly. In contrast, just as shown in Fig. 1, a clear delay is observed for the tumor growth when treated with Paclitaxel first followed by Notchi inhibitor (see the diamonds in pink and navy in Fig. 4a). Meanwhile, HER2+ and HER2- cell populations shrink rapidly during each drug treatment, as illustrated by the phase trajectory in Fig. 4b (see the diamonds). It indicates the effectiveness of these two drugs. In addition, the tumor size is always much smaller in the second protocol compared to the first, reaching three fold difference in size (see the tumor size at the sixth week in Fig. 4a). It follows that the order of drug administration greatly influences the treatment effects in the sequential treatment method, which is consistent with recent studieslin2020using ; salvador2020cdk4 . We also illustrate the tumor response when treated with the two drugs simultaneously (see the pentagons in Fig. 4a). A much better response is predicted compared to the first treatment method (see the circles in Fig. 4a). However, the second approach shows a similar good response with a close tumor burden at the end of treatment (see the diamond and pentagon in Fig. 4a). Hence, it is possible to find an optimal strategy to obtain a similar treatment effect with attenuated side effect.
Effect of duration of treatment: In the previous sections, a futile treatment with rapid tumor growth is frequently found (see Fig. 1 or the data in Figs. 4a–4b). We surmise that one drug should be removed at an appropriate time once it produces no benefits. We studied the influence of treatment period length () on tumor responses. First, we investigated the sequential treatment by Notchi inhibitor followed by Paclitaxel for different values (see Fig. 5a). The phase trajectories show that the variations in , and and their maximum values become smaller as is shortened. In addition, the response for each drug treatment is strengthened and the total tumor size (see the inset in Fig. 5a) is always smaller for a smaller . Therefore, a small should be used when such a treatment method is applied.
Next, we performed a similar analysis for the treatment with Paclitaxel first, followed by Notchi inhibitor (see Figs. 5b-5c). In contrast to the situation described above, the variations for , , and their responses to each drug treatment are similar even as varies. However, the total population size (see the inset in Figs. 5b-5c) is smaller for the two-week treatment compared to three and one-week treatment. We surmise that instead of using one-week treatment for each drug, a two-week period would be a better choice in this treatment strategy. Fig. 5 shows that the minimum values of , (see Figs. 5a and 5c) and the total minimum tumor size (see the inset in Fig. 5) at each treatment cycle increases with time, irrespective of the value of . This would result in uncontrolled tumor growth. In the following section, we will discuss potential approaches to control the tumor burden even if it cannot be fully eradicated.
Control of tumor burden and Cellular plasticity leads to failure of treatments: Despite the good response through certain treatment protocols as discussed above, tumor suppression is only transient, and the tumor recurs sooner or later due to drug resistance. Nevertheless, we can still seek, at least theoretically, a stable tumor burden as a compromise, which is similar to the goals of adaptive therapygatenby2009adaptive . For the breast CTC consisting of HER2+ and HER2- cells, the model suggests that it is possible to control the tumor maintained at a constant size (with relatively small variations, see Fig. S5 and detailed discussion in the SI). Finally, we have learned from our calculations that the plasticity of breast cancer cells is one of the leading reasons for ITH, which in turn leads to drug resistance during therapy. We investigate how such a property influences the tumor response during treatment further. By varying the values of (), we found that a strong transition between the two cell states can lead to total failure of treatments (see Fig. S6a), while it is much easier to control the tumor burden as the cellular plasticity is inhibited (see Figs. S6b-S6c and more discussions in the SI). Therefore, theoretical models based on the tumor evolutionary process are likely to be useful in predicting the tumor progression, the clinical response, and possibly in designing better strategies for cancer therapyli2020cooperation ; anderson2008integrative ; enriquez2016exploiting ; malmi2018cell ; sinha2020spatially .
Discussion:
We investigated the emergence of intratumor heterogeneity in breast cancer arising from cellular plasticity, which is embodied in the conversion between the HER2+ and HER2- phenotypes. In contrast to the unidirectional differentiation of normal stem cellswichterle2002directed ; keller2005embryonic , many cancer cells demonstrate a great degree of plasticity that results in reversible transitions between different phenotypes, leading to ITH without genetic mutationsquintana2010phenotypic ; gupta2011stochastic . Such transitions are frequently observed in rapidly growing tumors, which is often neglected in theoretical modelsgupta2011stochastic . Although some studies have recognized the need for taking a growing population, the models typically have many unknown parameterszhou2013population ; zhou2014nonequilibrium , which are hard to interpret.
By introducing a direct coupling between cell division and transition between phenotypes into a theoretical model, we provide a quantitative explanation for the emergence of a stable ITH, a hallmark in HER-negative breast cancer patients. Our model accurately describes the evolution of different cancer cell fractions, and also the total tumor size observed in a recent single-cell experiment successfully. We predicted that the symmetric cell division appears more frequently compared to the asymmetric case for both types of cells found in breast CTCs. Without adjusting any parameter, our theoretical predictions for the cell fraction as a function of the cell colony size agrees extremely well with experimental results. The cell colony size (58 cells) calculated from our theory for the emergence of one cell phenotype from the other is in good agreement with the experimental observations (59 cells).
The asymmetric cell division has not been observed in the breast CTC experiment directly, although the experiment implies that cells of one phenotype produce daughters of the other phenotypejordan2016her2 . However, in a more recent experiment this was detected in breast cancergranit2018regulation . It was found that the newly formed cell doublet, after one cell division, can be the same cell type (symmetric division) or different (asymmetric division, producing two daughter cells with one expressing the cytokeratin K14 while the other does not). It is also possible that the state transition is not only coupled to cell division but can also appear through tumor microenvironment remodelingliotta2001microenvironment . However, inclusion of these processes will add two more free parameters to our model, which is not needed to give the excellent agreement between theory and experiments. In addition, such a state transition is not observed after cytokinesis was inhibited in breast cancer experimentgranit2018regulation . Nevertheless, our mathematical model could be extended to incorporate these possibilities should this be warranted in the future.
Although the asymmetric cell division explains the bidirectional state transition, the underlying mechanism for such an asymmetric division is still unclear. In the experimentsgupta2011stochastic ; jordan2016her2 ; granit2018regulation , the different states of cancer cells are mainly determined by the expression level of one or several proteins. It is possible that these proteins (HER2, K14, etc.) are redistributed in the daughter cells unequally during cell division, which could be realized through a stochastic process or regulation of other proteinsgranit2018regulation ; marantan2016stochastic ; balazsi2011cellular .
The reversible phenotype transitions in cells have been found in many different types of cancers shaffer2017rare ; van2017neuroblastoma ; menard2001her2 , which not only lead to the development of drug resistance but also induce very complex drug responses, as discussed here. Although each cell type is sensitive to one specific drug, the heterogeneous tumor derived from breast CTC shows an obvious response to Paclitaxel but not to Notchi inhibitor. Our model provides a quantitative explanation for the different time courses of the tumor under distinct treatments. The failure of the Notchi inhibitor, even at the initial treatment is due to its target, HER2- cell which is a minority in the heterogeneous cell population, and has a slower proliferation rate compared to the HER2+ cell. Both experiments and our theory show a significant delay of tumor recurrence under the combination treatment with two drugs applied to the tumor simultaneously. We also predict that a sequential treatment strategy with Paclitaxel first, followed by Notchi inhibitor (not in a reverse order of drugs) can show similar treatment effect as the one with two drugs used at the same time. In addition, the sequential treatment reduces the quantity of drugs administered each time, which can reduce the adverse effects in principlelin2020using .
One advantage of the mathematical model is that we can steer the evolutionary dynamics of each subpopulation by applying the right drug at the appropriate time to control the tumor burden. This allows for a fuller exploration of the parameter space, which cannot be easily done in experiments. Finally, we propose that patients could benefit from drugs which inhibit the plasticity of the cancer cellsgranit2018regulation . Taken together, our model could be applied to explore ITH found in other type of cancersshaffer2017rare ; van2017neuroblastoma ; menard2001her2 ; granit2018regulation . From the examples presented here and similar successful studies, we expect that the physical and mathematical models may provide a quantitative understanding for the cancer progression and also stimulate new ideas in oncology researchaltrock2015mathematics ; li2020cooperation ; li2020imprints ; bocci2019toward ; gatenby2003mathematical . We should emphasize that mathematical models sharpen the questions surrounding the mechanisms of ITH, but real data from patients are needed to understand the origins of ITH.
Acknowledgements
We are grateful to Shaon Chakrabarti, Abdul N Malmi-Kakkada, and Sumit Sinha for discussions and comments on the manuscript. This work is supported by the National Science Foundation (PHY 17-08128), and the Collie-Welch Chair through the Welch Foundation (F-0019).
Author contributions
X.L. and D.T. conceived and designed the project, and co-wrote the paper. X.L. performed the research.
Competing financial interests
The authors declare no competing financial interests.
References
- (1) Sung H, Ferlay J, Siegel RL, Laversanne M, Soerjomataram I, Jemal A, et al. Global cancer statistics 2020: GLOBOCAN estimates of incidence and mortality worldwide for 36 cancers in 185 countries. CA: A Cancer Journal for Clinicians. 2021;n/a(n/a).
- (2) Ross JS, Wang K, Gay L, Al-Rohil R, Rand JV, Jones DM, et al. New routes to targeted therapy of intrahepatic cholangiocarcinomas revealed by next-generation sequencing. The oncologist. 2014;19(3):235.
- (3) Ellis LM, Hicklin DJ. Resistance to targeted therapies: refining anticancer therapy in the era of molecular oncology. Clinical Cancer Research. 2009;15(24):7471–7478.
- (4) Ahronian LG, Corcoran RB. Strategies for monitoring and combating resistance to combination kinase inhibitors for cancer therapy. Genome medicine. 2017;9(1):1–12.
- (5) Almendro V, Marusyk A, Polyak K. Cellular heterogeneity and molecular evolution in cancer. Annual Review of Pathology: Mechanisms of Disease. 2013;8:277–302.
- (6) Burrell RA, McGranahan N, Bartek J, Swanton C. The causes and consequences of genetic heterogeneity in cancer evolution. Nature. 2013;501(7467):338–345.
- (7) Marusyk A, Almendro V, Polyak K. Intra-tumour heterogeneity: a looking glass for cancer? Nature Reviews Cancer. 2012;12(5):323–334.
- (8) Dagogo-Jack I, Shaw AT. Tumour heterogeneity and resistance to cancer therapies. Nature reviews Clinical oncology. 2018;15(2):81.
- (9) Metzger Filho O, Viale G, Stein S, Trippa L, Yardley DA, Mayer IA, et al. Impact of HER2 heterogeneity on treatment response of early-stage HER2-positive breast cancer: phase II neoadjuvant clinical trial of T-DM1 combined with pertuzumab. Cancer Discovery. 2021;.
- (10) Koboldt DC, Steinberg KM, Larson DE, Wilson RK, Mardis ER. The next-generation sequencing revolution and its impact on genomics. Cell. 2013;155(1):27–38.
- (11) Shapiro E, Biezuner T, Linnarsson S. Single-cell sequencing-based technologies will revolutionize whole-organism science. Nature Reviews Genetics. 2013;14(9):618–630.
- (12) Gerlinger M, Rowan AJ, Horswell S, Larkin J, Endesfelder D, Gronroos E, et al. Intratumor heterogeneity and branched evolution revealed by multiregion sequencing. N Engl j Med. 2012;366:883–892.
- (13) Vogelstein B, Papadopoulos N, Velculescu VE, Zhou S, Diaz LA, Kinzler KW. Cancer genome landscapes. Science. 2013;339(6127):1546–1558.
- (14) de Bruin EC, McGranahan N, Mitter R, Salm M, Wedge DC, Yates L, et al. Spatial and temporal diversity in genomic instability processes defines lung cancer evolution. Science. 2014;346(6206):251–256.
- (15) Navin N, Kendall J, Troge J, Andrews P, Rodgers L, McIndoo J, et al. Tumour evolution inferred by single-cell sequencing. Nature. 2011;472(7341):90.
- (16) Swanton C. Intratumor heterogeneity: evolution through space and time. Cancer research. 2012;72(19):4875–4882.
- (17) Li X, Thirumalai D. Share, but unequally: a plausible mechanism for emergence and maintenance of intratumour heterogeneity. Journal of the Royal Society Interface. 2019;16(150):20180820.
- (18) Meacham CE, Morrison SJ. Tumour heterogeneity and cancer cell plasticity. Nature. 2013;501(7467):328–337.
- (19) Altrock PM, Liu LL, Michor F. The mathematics of cancer: integrating quantitative models. Nature Reviews Cancer. 2015;15(12):730–745.
- (20) Moore KA, Lemischka IR. Stem cells and their niches. Science. 2006;311(5769):1880–1885.
- (21) Reya T, Morrison SJ, Clarke MF, Weissman IL. Stem cells, cancer, and cancer stem cells. nature. 2001;414(6859):105–111.
- (22) Blanpain C, Fuchs E. Plasticity of epithelial stem cells in tissue regeneration. Science. 2014;344(6189):1242281.
- (23) Jopling C, Boue S, Belmonte JCI. Dedifferentiation, transdifferentiation and reprogramming: three routes to regeneration. Nature reviews Molecular cell biology. 2011;12(2):79–89.
- (24) Gupta PB, Pastushenko I, Skibinski A, Blanpain C, Kuperwasser C. Phenotypic plasticity: driver of cancer initiation, progression, and therapy resistance. Cell stem cell. 2019;24(1):65–78.
- (25) Al-Hajj M, Wicha MS, Benito-Hernandez A, Morrison SJ, Clarke MF. Prospective identification of tumorigenic breast cancer cells. Proceedings of the National Academy of Sciences. 2003;100(7):3983–3988.
- (26) Clevers H. The cancer stem cell: premises, promises and challenges. Nature medicine. 2011;17(3):313.
- (27) Kreso A, Dick JE. Evolution of the cancer stem cell model. Cell stem cell. 2014;14(3):275–291.
- (28) Gupta PB, Fillmore CM, Jiang G, Shapira SD, Tao K, Kuperwasser C, et al. Stochastic state transitions give rise to phenotypic equilibrium in populations of cancer cells. Cell. 2011;146(4):633–644.
- (29) Chaffer CL, Brueckmann I, Scheel C, Kaestli AJ, Wiggins PA, Rodrigues LO, et al. Normal and neoplastic nonstem cells can spontaneously convert to a stem-like state. Proceedings of the National Academy of Sciences. 2011;108(19):7950–7955.
- (30) Shackleton M, Quintana E, Fearon ER, Morrison SJ. Heterogeneity in cancer: cancer stem cells versus clonal evolution. Cell. 2009;138(5):822–829.
- (31) Quintana E, Shackleton M, Foster HR, Fullen DR, Sabel MS, Johnson TM, et al. Phenotypic heterogeneity among tumorigenic melanoma cells from patients that is reversible and not hierarchically organized. Cancer cell. 2010;18(5):510–523.
- (32) Zhou JX, Pisco AO, Qian H, Huang S. Nonequilibrium population dynamics of phenotype conversion of cancer cells. PloS one. 2014;9(12).
- (33) Jordan NV, Bardia A, Wittner BS, Benes C, Ligorio M, Zheng Y, et al. HER2 expression identifies dynamic functional states within circulating breast cancer cells. Nature. 2016;537(7618):102–106.
- (34) Granit RZ, Masury H, Condiotti R, Fixler Y, Gabai Y, Glikman T, et al. Regulation of cellular heterogeneity and rates of symmetric and asymmetric divisions in triple-negative breast cancer. Cell reports. 2018;24(12):3237–3250.
- (35) Sharma SV, Lee DY, Li B, Quinlan MP, Takahashi F, Maheswaran S, et al. A chromatin-mediated reversible drug-tolerant state in cancer cell subpopulations. Cell. 2010;141(1):69–80.
- (36) Arteaga CL, Engelman JA. ERBB receptors: from oncogene discovery to basic science to mechanism-based cancer therapeutics. Cancer cell. 2014;25(3):282–303.
- (37) Houssami N, Macaskill P, Balleine RL, Bilous M, Pegram MD. HER2 discordance between primary breast cancer and its paired metastasis: tumor biology or test artefact? Insights through meta-analysis. Breast cancer research and treatment. 2011;129(3):659–674.
- (38) Kim SC, Kim DW, Shim YH, Bang JS, Oh HS, Kim SW, et al. In vivo evaluation of polymeric micellar paclitaxel formulation: toxicity and efficacy. Journal of Controlled Release. 2001;72(1-3):191–202.
- (39) Tolcher AW, Messersmith WA, Mikulski SM, Papadopoulos KP, Kwak EL, Gibbon DG, et al. Phase I study of RO4929097, a gamma secretase inhibitor of Notch signaling, in patients with refractory metastatic or locally advanced solid tumors. Journal of clinical oncology. 2012;30(19):2348.
- (40) Eisenhauer E. Connecting communities to tackle cancer from many sides. Cell. 2021;184(8):1949–1952.
- (41) Dean-Colomb W, Esteva FJ. Her2-positive breast cancer: herceptin and beyond. European Journal of Cancer. 2008;44(18):2806–2812.
- (42) Carey LA, Perou CM, Livasy CA, Dressler LG, Cowan D, Conway K, et al. Race, breast cancer subtypes, and survival in the Carolina Breast Cancer Study. Jama. 2006;295(21):2492–2502.
- (43) Lin KH, Rutter JC, Xie A, Pardieu B, Winn ET, Dal Bello R, et al. Using antagonistic pleiotropy to design a chemotherapy-induced evolutionary trap to target drug resistance in cancer. Nature genetics. 2020;52(4):408–417.
- (44) Salvador-Barbero B, Álvarez-Fernández M, Zapatero-Solana E, El Bakkali A, del Camino Menéndez M, López-Casas PP, et al. CDK4/6 inhibitors impair recovery from cytotoxic chemotherapy in pancreatic adenocarcinoma. Cancer Cell. 2020;37(3):340–353.
- (45) Gatenby RA, Silva AS, Gillies RJ, Frieden BR. Adaptive therapy. Cancer research. 2009;69(11):4894–4903.
- (46) Li X, Thirumalai D. Cooperation among tumor cell subpopulations leads to intratumor heterogeneity. Biophysical Reviews and Letters. 2020;15(02):99–119.
- (47) Anderson AR, Quaranta V. Integrative mathematical oncology. Nature Reviews Cancer. 2008;8(3):227–234.
- (48) Enriquez-Navas PM, Kam Y, Das T, Hassan S, Silva A, Foroutan P, et al. Exploiting evolutionary principles to prolong tumor control in preclinical models of breast cancer. Science translational medicine. 2016;8(327):327ra24–327ra24.
- (49) Malmi-Kakkada AN, Li X, Samanta HS, Sinha S, Thirumalai D. Cell growth rate dictates the onset of glass to fluidlike transition and long time superdiffusion in an evolving cell colony. Physical Review X. 2018;8(2):021025.
- (50) Sinha S, Malmi-Kakkada AN, Li X, Samanta HS, Thirumalai D. Spatially heterogeneous dynamics of cells in a growing tumor spheroid: Comparison between theory and experiments. Soft Matter. 2020;16(22):5294–5304.
- (51) Wichterle H, Lieberam I, Porter JA, Jessell TM. Directed differentiation of embryonic stem cells into motor neurons. Cell. 2002;110(3):385–397.
- (52) Keller G. Embryonic stem cell differentiation: emergence of a new era in biology and medicine. Genes & development. 2005;19(10):1129–1155.
- (53) Zhou D, Wu D, Li Z, Qian M, Zhang MQ. Population dynamics of cancer cells with cell state conversions. Quantitative Biology. 2013;1(3):201–208.
- (54) Liotta LA, Kohn EC. The microenvironment of the tumour–host interface. Nature. 2001;411(6835):375–379.
- (55) Marantan A, Amir A. Stochastic modeling of cell growth with symmetric or asymmetric division. Physical Review E. 2016;94(1):012405.
- (56) Balázsi G, van Oudenaarden A, Collins JJ. Cellular decision making and biological noise: from microbes to mammals. Cell. 2011;144(6):910–925.
- (57) Shaffer SM, Dunagin MC, Torborg SR, Torre EA, Emert B, Krepler C, et al. Rare cell variability and drug-induced reprogramming as a mode of cancer drug resistance. Nature. 2017;546(7658):431–435.
- (58) van Groningen T, Koster J, Valentijn LJ, Zwijnenburg DA, Akogul N, Hasselt NE, et al. Neuroblastoma is composed of two super-enhancer-associated differentiation states. Nature genetics. 2017;49(8):1261.
- (59) Ménard S, Fortis S, Castiglioni F, Agresti R, Balsari A. HER2 as a prognostic factor in breast cancer. Oncology. 2001;61(Suppl. 2):67–72.
- (60) Li X, Thirumalai D. Imprints of tumor mutation burden on chromosomes and relation to cancer risk in humans: A pan-cancer analysis, https://www.biorxiv.org/content/10.1101/2020.04.20.050989. bioRxiv. 2021;.
- (61) Bocci F, Gearhart-Serna L, Boareto M, Ribeiro M, Ben-Jacob E, Devi GR, et al. Toward understanding cancer stem cell heterogeneity in the tumor microenvironment. Proceedings of the National Academy of Sciences. 2019;116(1):148–157.
- (62) Gatenby RA, Maini PK. Mathematical oncology: cancer summed up. Nature. 2003;421(6921):321–321.
[figure]style=plain,subcapbesideposition=top
[figure]style=plain,subcapbesideposition=top
[figure]style=plain,subcapbesideposition=top
[figure]style=plain,subcapbesideposition=top
[figure]style=plain,subcapbesideposition=top