Aeolian sand transport: Scaling of mean saltation length and height and implications for mass flux scaling
Abstract
Wind tunnel measurements of the mean saltation length and of different proxies of the mean saltation height in saturated aeolian sand transport indicate that and are relatively insensitive to both the wind speed and grain diameter . The latter result is currently unexplained and contradicts the theoretical prediction . This prediction is based on the assumption that the characteristic velocity of bed grains ejected by the splash of an impacting grain controls the average saltation kinematics. Here, we show that a recent analytical saltation model that considers only rebounds of saltating grains, but neglects splash ejection, is consistent with the measurements. The model suggests that the buffer layer of the inner turbulent boundary layer, which connects the viscous sublayer with the log-layer, is partially responsible for the insensitivity of and to . In combination, the measurements and model therefore indicate that splash ejection, though important to sustain saltation, does not significantly affect the average saltation kinematics. This finding represents a strong argument against the Ungar and Haff [1987]-scaling and in favor of the Durán et al. [2011]-scaling of the saturated saltation mass flux, with implications for ripple formation on Mars. Furthermore, it supports the recent controversial claim that this flux is insensitive to soil cohesion.
keywords:
aeolian sand transport , saltation trajectories , mass flux , ripple formation , cohesion1 Introduction
The evolution of windblown dry planetary sand surfaces is determined by spatial changes of the mass flux associated with sand transport. Since the seminal work by Bagnold [1941], there has been an ongoing debate about the scaling of for saturated (i.e., equilibrium) transport conditions. A large part of this debate has focused on the question of how increases with the wind friction velocity . While many theoretical studies proposed various cubic relationships between on [e.g., Bagnold, 1941, Owen, 1964, Sørensen, 2004, Durán and Herrmann, 2006], a consensus has emerged in the last two decades in favor of the quadratic relationship [e.g., Ungar and Haff, 1987, Durán et al., 2011, Kok et al., 2012, Valance et al., 2015], where is the dynamic threshold value of below which is predicted to vanish. This quadratic relationship has been directly confirmed by sophisticated wind tunnel [Creyssels et al., 2009, Ho et al., 2011] and field measurements of [Martin et al., 2013, Martin and Kok, 2017]. Additionally, it is supported by wind tunnel [Rasmussen and Sørensen, 2008, Creyssels et al., 2009, Ho et al., 2011, 2014] and field measurements [Greeley et al., 1996, Namikas, 2003, Martin and Kok, 2017] showing nearly -independent average kinematic transport layer properties. Recently, it has been predicted [Pähtz and Durán, 2020] and subsequently experimentally confirmed [Ralaiarisoa et al., 2020] that the quadratic scaling turns into a quartic one, , for very intense aeolian sand transport. The reason is a transition from a saltation regime, in which transported grains bounce along the surface in ballistic trajectories, to a collisional regime, in which grain trajectories are substantially affected by midair collisions [Carneiro et al., 2013, Pähtz and Durán, 2020, Ralaiarisoa et al., 2020].
However, the debate about the scaling of has not been settled. While there is a consensus in favor of for the saturated saltation regime, different research groups have made two different predictions about the scaling of the prefactors in this relationship:
| Ungar and Haff [1987]: | (1) | ||||
| Durán et al. [2011]: | (2) |
where is the fluid density, is the median grain diameter, and , with the particle density, is the buoyancy-reduced value of the gravitational constant . Equation (1), first proposed by Ungar and Haff [1987], is favored by Jenkins and Valance [2014], Valance et al. [2015], Berzi et al. [2016], and Ralaiarisoa et al. [2020], while Eq. (2) is favored by Durán et al. [2011], Kok et al. [2012], Pähtz and Durán [2020], and Pähtz et al. [2021].
Eqs. (1) and (2) are based on two different physical understandings of the so-called replacement capacity condition, that is, the bed boundary condition that ensures that, on average, a single grain leaves the sand bed per grain impacting the bed. Proponents of Eq. (1) argue that both the rebound of the impacting grain and the ejection of new bed grains should be considered in the modeling of the replacement capacity condition [Valance et al., 2015], which implies that is the predominant velocity scale controlling the average saltation kinematics [Berzi et al., 2016]. In contrast, proponents of Eq. (2) argue that only rebounding grains should be considered [Pähtz et al., 2020], which implies that the threshold wind friction velocity is the predominant velocity scale [Pähtz and Durán, 2020]. These two physical understandings are mutually exclusive, since it is agreed upon that is generally not a constant. Rather, it depends on further dimensionless quantities, such as the particle-fluid-density ratio and Galileo number , where is the kinematic fluid viscosity [Kok, 2010, Berzi et al., 2016, 2017, Pähtz and Durán, 2018, Pähtz et al., 2020, Andreotti et al., 2021, Pähtz et al., 2021]. That is, the predictions of Eqs. (1) and (2) can be very different from each other across atmospheric conditions.
Ho et al. [2014] carried out wind tunnel experiments of saturated aeolian sand transport for various and two sands with significantly different grain diameters (). They measured the mean saltation length , the mean saltation height of grains hopping at least high, and the so-called focus height (i.e., the highest elevation below which the local wind velocity is insensitive to ), the latter two of which are proxies for the mean saltation height of all grains. Importantly, they noted that the corresponding measured values and (insensitive to ) and are inconsistent with the notion that the average saltation kinematics are controlled by the velocity scale as this notion would imply . Similarly, from the surface roughness data of Rasmussen et al. [1996] for five different sands within the range , Andreotti [2004] (his Fig. 12(b)) estimated that scales with rather than with (see also inset of Fig. 24 of Durán et al. [2011]). Both data sets cause doubt on Eq. (1) and remain unexplained.
Here, we show that the recent analytical saltation model of Pähtz et al. [2021] (introduced in section 2), which is based on the same physical understanding of the replacement capacity condition as Eq. (2), is consistent with both data sets (section 3). This model suggests that and obey a relatively simple previously unreported scaling behavior.
2 Analytical Saltation Model of Pähtz et al. [2021]
The analytical saltation model of Pähtz et al. [2021] predicts the average saltation kinematics for transport threshold conditions (). We assume that this model also applies to saltation conditions far from the threshold because experiments indicate that the average saltation kinematics is insensitive to [Ho et al., 2014]. Since only a few grains are in motion near threshold conditions, the model assumes that saltation is driven by an undisturbed inner turbulent boundary layer velocity profile , which is a function of , the particle Reynolds number , and the nondimensionalized elevation above the sand bed surface :
| (3) |
For , the function covers two extreme regimes [Julien, 2010]:
| Viscous sublayer (): | (4a) | ||||
| Log-layer (): | (4b) | ||||
where is the von Kármán constant and [Guo and Julien, 2007, Sleath, 1984]
| (5) |
is the surface roughness across smooth () and rough () conditions. The buffer layer () connects the viscous sublayer with the log-layer. However, for , only the log-layer exists. An empirical unifying expression across all regimes, the so-called Law of the Wall, is given by [Guo and Julien, 2007, Julien, 2010]
| (6) |
where . Note that there are alternative empirical expressions that work similarly well [Julien, 2010]. However, to be consistent with Pähtz et al. [2021], Eq. (6) is used in the model unless mentioned otherwise.
The model represents the entire grain motion by grains saltating in identical periodic trajectories. That is, it combines the equations of motion for an individual saltating grain, linking the grain impact velocity to the grain lift-off (or rebound) velocity (i.e., ), with boundary conditions that describe the average outcome of a grain-bed rebound (). For given values of , , and , the model then calculates the value of the Shields number for which the grain trajectory is periodic (i.e., ), summarized by the following set of equations (explained shortly):
| (7a) | ||||
| (7b) | ||||
| (7c) | ||||
| (7d) | ||||
where the velocities have been nondimensionalized via , with the average terminal settling velocity of saltating grains, calculated by
| (8) |
Eqs. (7a)-(7d) and (8) were derived starting from linearizing the fluid drag acceleration acting on saltating grains via approximating the fluid-particle-velocity difference as , where the overbar represents the saltation trajectory average. This linearization then led to a decoupling of the equation of vertical motion from the equation of streamwise motion, allowing them to be readily solved analytically. Eq. (7a), in which denotes the principal branch of the Lambert- function, was derived from the exact solution of this decoupled equation of vertical motion. Eqs. (7b) and (7c), where and , are empirical laws describing the mean rebound restitution coefficient and vertical rebound restitution coefficient in agreement with measurements by Beladjine et al. [2007], who carried out experiments of the collision process between an incident grain and a three-dimensional granular packing. Eq. (7d), where is the dimensionless elevation of a grain’s center of mass during its rebound with the sand bed relative to the virtual zero-level of , was derived from an approximate solution of the equation of streamwise motion. Eq. (8) is a direct consequence of the linearization of the fluid drag law by Camenen [2007], where the values of the parameters and depend on the grain shape (discussed later).
For given values of , , and , solving Eqs. (7a)-(7d) and (8) yields a unique value of . The saltation threshold Shields number is then calculated as the smallest value of for which a solution exists:
| (9) |
From the value of corresponding to this threshold solution, we then obtain and via Eqs. (7a) and (8) and
| (10) | ||||
| (11) |
Like Eqs. (7a)-(7d) and (8), Eqs. (10) and (11) were derived from the equation of streamwise and vertical motion, respectively, associated with the linearized fluid drag law.
3 Results
Figure 1 compares the model predictions of the mean saltation length and height with measurements. The comparison includes wind tunnel measurements of and by Ho et al. [2014] (symbols labeled ‘H14’), who used a novel measurement method that, in contrast to previous methods, did not require tracking the trajectories of single grains. Ho et al. [2014] also reported field data of extracted from applying their method to the streamwise mass flux distribution field data by Namikas [2003] (symbols labeled ‘N03’). Note that data obtained from older grain tracking-based methods [e.g., Nalpanis et al., 1993, Zhang et al., 2007] are prone to error for various reasons, such as the fact that the grains’ lateral motion may cause them to leave the observation window [Ho et al., 2014], and are therefore excluded from the comparison. The comparison in Fig. 1 also includes direct wind tunnel measurements of the focus height by Ho et al. [2014], field measurements of by Bagnold [1938] (symbols labeled ‘B38’), and estimations of by Andreotti [2004] (see his Fig. 12(b) or the inset of Fig. 24 of Durán et al. [2011]), which he obtained from the surface roughness wind tunnel data of Rasmussen et al. [1996] (symbols labeled ‘R96’). Note that Ho et al. [2014] reported a further field measurement of for the experiments by Namikas [2003], which they estimated from the velocity profile data reported in Namikas et al. [2003]. However, we were unable to reproduce their estimation, since those velocity profile data in Namikas et al. [2003] that correspond to the experiments by Namikas [2003] exhibit a too narrow range of (varying only between and ) to reliable estimate .
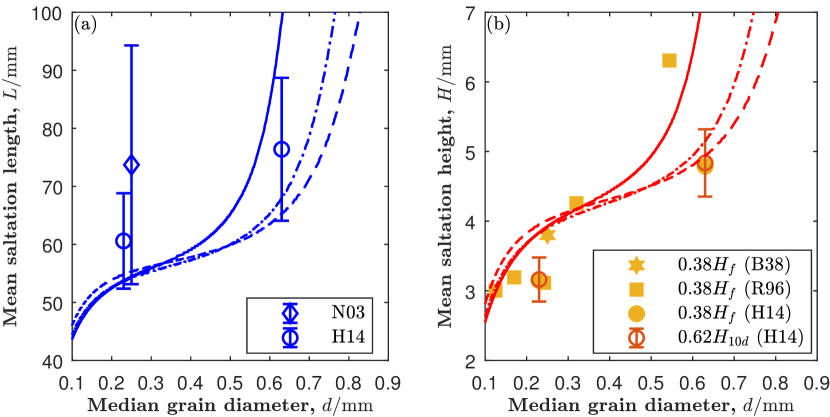
Because both and are proxies of and proportional to each other () for Earth’s atmospheric conditions [Ho et al., 2014], we have assumed and fitted the proportionality constant to best agreement between model predictions and measurements of , yielding and thus . However, we note that these proportionalities may not necessarily hold generally across atmospheric conditions.
The three different model predictions in Fig. 1 correspond to three different combinations of and . The values and (solid lines) are approximately valid for spherical grains, while smaller values of and larger values of are associated with more angular grains [Camenen, 2007]. In particular, the values and (dash-dotted lines) are close to those recommended for natural sand grains by Camenen [2007] and the values and (dashed lines) are those that Ho et al. [2014] used to reproduce their measured saltation length and height distributions with their numerical model. Consistently, it can be seen in Fig. 1 that the model prediction corresponding to and agrees better with the largest- data points of Ho et al. [2014] than the model prediction corresponding to and , whereas the opposite is true for the largest- data point of Rasmussen et al. [1996]. In contrast, for sufficiently small , the different model predictions are all consistent with the experimental data and differ only very slightly from each other. This is because the drag force is dominated by its Stokes drag component for sufficiently small , resulting in the dimensionless settling velocity (Eq. (8) for small Galileo number ), which is independent of and . Note that it is not surprising that different experimental data sets require different combinations of and for good model agreement, since typical shapes of sand grains can vary substantially across sites on Earth [Raffaele et al., 2020].
In Fig. 2, we replotted the measurements and model predictions using dimensionless parameters that capture most of the variation with and and also most of the variation with the particle-fluid-density ratio , namely, , , and , where , with [i.e., in the limit of negligible vertical drag, obtained from Eqs. (7b) and (7c), Pähtz et al., 2021]. It can be seen that there are essentially two distinct regimes: one regime for in which and are very slightly increasing (i.e., roughly constant) and another regime for in which roughly .
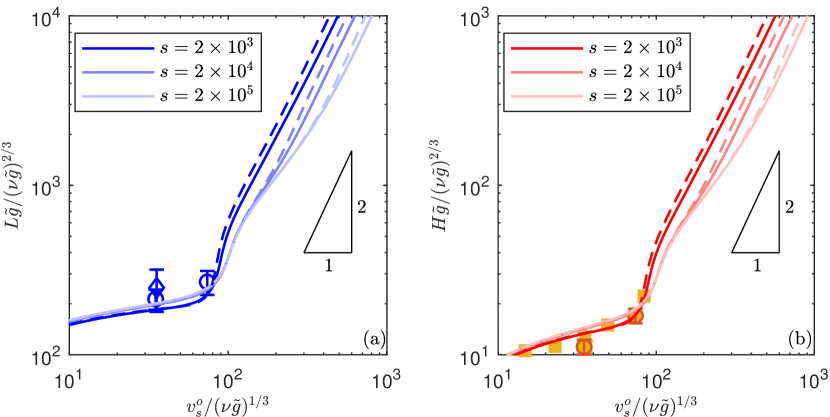
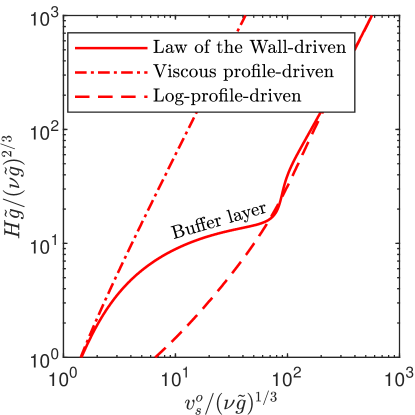
The regime of roughly constant and is strongly linked to the buffer layer of inner turbulent boundary layer, which connects the viscous sublayer with the log-layer, as shown in Fig. 3 for . In fact, when replacing the general Law of the Wall driving flow (Eq. (6), solid line in Fig. 3) in the model by a pure viscous profile driving flow (Eq. (4a), dash-dotted line in Fig. 3) or a pure log-profile driving flow (Eq. (4b), dashed line in Fig. 3), increases comparably strongly with .
4 Discussion and Conclusions
The analytical saltation model of Pähtz et al. [2021] predicts the average saltation kinematics for transport threshold conditions. Using this model, assuming that the average saltation kinematics is insensitive to the wind friction velocity [Ho et al., 2014], we have provided an explanation for previously unexplained measurements of a surprisingly weak dependency of the mean saltation length and height on the grain diameter (Fig. 1).
The model links this behavior to a regime in which and are roughly constant with the particle-fluid-density ratio and with the nondimensionalized settling velocity within the range (Fig. 2). For , the scaling changes to roughly , which is equivalent to when the Galileo number is sufficiently large (from Eq. (8)). Note that , and thus this regime transition, depends on the typical shape of saltating grains. However, we are unaware of saltation trajectory wind tunnel or field data for large median grain diameters ( on Earth, see Fig. 1) that would be required to test this predicted regime transition. Note that we refrained from testing our model against measurements of the e-folding length of vertical concentration or mass flux profiles, which also exist for large [Dong and Qian, 2007, Zhang et al., 2017], since measured values for similar conditions vary by more than an order of magnitude between the different studies [Ho, 2012, Table 5.3], suggesting problems with some of the applied experimental methods. It is also unclear how strongly the saltation kinematics depends on grain size heterogeneity and turbulent wind fluctuations. The fact that the model, which assumes monodisperse sand and a mean turbulent flow, is consistent with field measurements (very heterogeneous sand and strong turbulent wind fluctuations), as shown in Figs. 1 and 2 (see also Figs. 5(d) and 5(g) of Pähtz et al. [2021]), hints on relatively weak effects. However, more data are needed to draw reliable conclusions.
By comparing model predictions for different driving flows, we have linked the regime of roughly constant and to the buffer layer of the inner turbulent boundary layer (Fig. 3), which connects the viscous sublayer with the log-layer. This leads to the conclusion that the viscous sublayer and buffer layer, which are usually assumed to be negligible [e.g., Kok, 2010, Berzi et al., 2016, 2017, Lämmel and Kroy, 2017], actually have a substantial impact on the statistical properties of saltation.
A further crucial difference between the model of Pähtz et al. [2021] and previous analytical saltation models concerns the modeling of the replacement capacity condition, that is, the bed boundary condition that ensures that, on average, a single grain leaves the sand bed per grain impacting the bed. The difference lies in the notion of when a grain should be considered as leaving the bed. Most previous models assume that a grain can be considered as leaving the bed when it escapes the bed pocket in which it is resting, that is, when it is lifted a distance , which requires a lift-off velocity [Claudin and Andreotti, 2006, Kok, 2010, Berzi et al., 2016, 2017, Andreotti et al., 2021]. Under the approximation that grains impacting the bed nearly never fail to rebound, this assumption implies that is also the predominant velocity scale controlling the average saltation kinematics [Berzi et al., 2016]. Under the further approximation that the vertical drag on saltating grains can be neglected, this implication leads to the prediction . However, as noted in the introduction (see also Figs. 1 and 2), this prediction is inconsistent with measurements, suggesting potential problems with the modeling of the replacement capacity condition underlying this prediction.
One such potential problem was pointed out by Pähtz and Durán [2018] and Pähtz et al. [2020]: Even if a grain initially escapes the bed surface pocket in which it is resting, it will still be quickly captured by the bed if it, on average, loses more energy in its subsequent impact(s) on the bed than it gains during its subsequent saltation hop(s) through wind drag acceleration (i.e., if the grain is net decelerated). In other words, grains should only be considered as leaving the bed if they are net accelerated after escaping their bed surface pocket [note that a similar definition was recently also applied to aerodynamic entrainment, Jia and Wang, 2021]. The analytical saltation model of Pähtz et al. [2021] therefore only considers rebounding grains in the modeling of the replacement capacity condition. That is, the velocity scale plays no role in this model, resulting in our novel predictions for and . Consistently, the model predicts that, in the limit of threshold conditions, the minimal lift-off velocity that a grain needs to become net accelerated in its subsequent motion is larger than the largest possible lift-off velocity of splash-ejected grains [Pähtz et al., 2021].
The velocity scale , associated with splash ejection, dictates the scaling of the average streamwise velocity of saltating grains in the widely-used Ungar and Haff [1987]-scaling (Eq. (1)) of the saturated saltation mass flux [Valance et al., 2015]. Our result that has no significant effect on the average saltation kinematics therefore represents a strong argument against this scaling and in favor of the Durán et al. [2011]-scaling (Eq. (2)) of , the latter of which only requires considering the rebound dynamics of saltating grains, but not splash ejection [Pähtz and Durán, 2020]. This in turn supports the recent controversial claim that the scaling of is insensitive to soil cohesion [Comola et al., 2019, Pähtz et al., 2021], since this rebound dynamics, in contrast to splash ejection, is not much affected by cohesive bonds between bed grains [Pähtz et al., 2021].
Our results seem to be at odds with the recent wind tunnel experiments by Andreotti et al. [2021], who measured that the wavelength of aeolian impact ripples emerging from a flat bed is insensitive to the atmospheric conditions across a large range of the particle-fluid-density ratio (). In fact, these authors were able to theoretically explain their measurements only when assuming the Ungar and Haff [1987]-scaling of , whereas the Durán et al. [2011]-scaling would not have worked for them, contrary to our main conclusion here. A possible explanation for this discrepancy lies in the fact that, for most of their tested atmospheric conditions, sand transport was undersaturated, possibly strongly undersaturated, at the end of the wind tunnel test section and that this undersaturation was mainly because most grains did not have nearly enough fetch to be net accelerated toward their steady state velocity [Andreotti et al., 2021]. Under such circumstances, it seems, indeed, reasonable that most saltating grains exhibit a velocity close to the one associated with their splash ejection from the bed, that is, . In other words, the insensitivity of to the atmospheric conditions measured by Andreotti et al. [2021] may, indeed, be explained using the Ungar and Haff [1987]-scaling. However, one should be cautious with extrapolating this finding to field conditions on Mars, where sand transport may have had a sufficiently long fetch to saturate during the initial phase of ripple formation. In fact, the Durán et al. [2011]-scaling, favored by our study for saturated conditions, leads to a fundamentally different dependency of on the atmospheric conditions [Durán et al., 2014].
Apart from weighing in on the ongoing debate about the scaling of , our results may also improve predictions of aeolian dune formation. In fact, the wavelength of dunes emerging from a flat bed scales with the so-called saturation length [Sauermann et al., 2001, Kroy et al., 2002], the scaling of which is controversial [Claudin and Andreotti, 2006, Andreotti et al., 2010, Pähtz et al., 2013, 2015, Lämmel and Kroy, 2017, Jenkins and Valance, 2018, Selmani et al., 2018]. A reasonable assumption is that scales with the saltation length above the aerodynamic entrainment threshold [Lämmel and Kroy, 2017]. If this assumption turns out to be true, our study will provide the simple prediction across a large range of atmospheric conditions, including typical conditions on Mars.
Acknowledgments
References
- Andreotti [2004] Andreotti, B., 2004. A two-species model of aeolian sand transport. Journal of Fluid Mechanics 510, 47–70. doi:10.1017/S0022112004009073.
- Andreotti et al. [2021] Andreotti, B., Claudin, P., Iversen, J.J., Merrison, J.P., Rasmussen, K.R., 2021. A lower than expected saltation threshold at martian pressure and below. Proceedings of the National Academy of Sciences of the United States of America 118, e2012386118. doi:10.1073/pnas.2012386118.
- Andreotti et al. [2010] Andreotti, B., Claudin, P., Pouliquen, O., 2010. Measurements of the aeolian sand transport saturation length. Geomorphology 123, 343–348.
- Bagnold [1938] Bagnold, R.A., 1938. The measurement of sand storms. Proceedings of the Royal Society London Series A 167, 282–291. doi:10.1098/rspa.1938.0132.
- Bagnold [1941] Bagnold, R.A., 1941. The Physics of Blown Sand and Desert Dunes. Methuen, New York.
- Beladjine et al. [2007] Beladjine, D., Ammi, M., Oger, L., Valance, A., 2007. Collision process between an incident bead and a three-dimensional granular packing. Physical Review E 75, 061305. doi:10.1103/PhysRevE.75.061305.
- Berzi et al. [2016] Berzi, D., Jenkins, J.T., Valance, A., 2016. Periodic saltation over hydrodynamically rough beds: aeolian to aquatic. Journal of Fluid Mechanics 786, 190–209. doi:10.1017/jfm.2015.601.
- Berzi et al. [2017] Berzi, D., Valance, A., Jenkins, J.T., 2017. The threshold for continuing saltation on Earth and other solar system bodies. Journal of Geophysical Research: Earth Surface 122, 1374–1388. doi:10.1002/2016JF003982.
- Camenen [2007] Camenen, B., 2007. Simple and general formula for the settling velocity of particles. Journal of Hydraulic Engineering 133, 229–233. doi:10.1061/(ASCE)0733-9429(2007)133:2(229).
- Carneiro et al. [2013] Carneiro, M.V., Araújo, N.A.M., Pähtz, T., Herrmann, H.J., 2013. Midair collisions enhance saltation. Physical Review Letters 111, 058001. doi:10.1103/PhysRevLett.111.058001.
- Claudin and Andreotti [2006] Claudin, P., Andreotti, B., 2006. A scaling law for aeolian dunes on Mars, Venus, Earth, and for subaqueous ripples. Earth and Planetary Science Letters 252, 30–44. doi:10.1016/j.epsl.2006.09.004.
- Comola et al. [2019] Comola, F., Gaume, J., Kok, J.F., Lehning, M., 2019. Cohesion-induced enhancement of aeolian saltation. Geophysical Research Letters 46, 5566–5574. doi:10.1029/2019GL082195.
- Creyssels et al. [2009] Creyssels, M., Dupont, P., Ould El Moctar, A., Valance, A., Cantat, I., Jenkins, J.T., Pasini, J.M., Rasmussen, K.R., 2009. Saltating particles in a turbulent boundary layer: experiment and theory. Journal of Fluid Mechanics 625, 47–74. doi:10.1017/S0022112008005491.
- Dong and Qian [2007] Dong, Z., Qian, G., 2007. Characterizing the height profile of the flux of wind-eroded sediment. Environmental Geology 51, 835–845. doi:10.1007/s00254-006-0363-5.
- Durán et al. [2011] Durán, O., Claudin, P., Andreotti, B., 2011. On aeolian transport: Grain-scale interactions, dynamical mechanisms and scaling laws. Aeolian Research 3, 243–270. doi:10.1016/j.aeolia.2011.07.006.
- Durán et al. [2014] Durán, O., Claudin, P., Andreotti, B., 2014. Direct numerical simulations of aeolian sand ripples. Proceedings of the National Academy of Sciences of the United States of America 111, 15665–15668. doi:10.1073/pnas.1413058111.
- Durán and Herrmann [2006] Durán, O., Herrmann, H.J., 2006. Modelling of saturated sand flux. Journal of Statistical Mechanics 2006, P07011. doi:10.1088/1742-5468/2006/07/P07011.
- Greeley et al. [1996] Greeley, R., Blumberg, D.G., Williams, S.H., 1996. Field measurements of the flux and speed of wind-blown sand. Sedimentology 43, 41–52. doi:10.1111/j.1365-3091.1996.tb01458.x.
- Guo and Julien [2007] Guo, J., Julien, P.Y., 2007. Buffer law and transitional roughness effect in turbulent open-channel flows, in: The Fifth International Symposium on Environmental Hydraulics (ISEH V), 5, University of Nebraska - Lincoln, Tempe, Arizona. pp. 1–6.
- Ho [2012] Ho, T.D., 2012. Etude expérimentale du transport de particules dans une couche limite turbulente. Ph.D. thesis. University of Rennes 1. Rennes, France.
- Ho et al. [2011] Ho, T.D., Valance, A., Dupont, P., Ould El Moctar, A., 2011. Scaling laws in aeolian sand transport. Physical Review Letters 106, 094501. doi:10.1103/PhysRevLett.106.094501.
- Ho et al. [2014] Ho, T.D., Valance, A., Dupont, P., Ould El Moctar, A., 2014. Aeolian sand transport: Length and height distributions of saltation trajectories. Aeolian Research 12, 65–74. doi:10.1016/j.aeolia.2013.11.004.
- Jenkins and Valance [2014] Jenkins, J.T., Valance, A., 2014. Periodic trajectories in aeolian sand transport. Physics of Fluids 26, 073301. doi:10.1063/1.4885576.
- Jenkins and Valance [2018] Jenkins, J.T., Valance, A., 2018. Two-phase continuum theory for windblown sand. Physical Review Fluids 3, 034305. doi:10.1103/PhysRevFluids.3.034305.
- Jia and Wang [2021] Jia, S., Wang, Z., 2021. Simulation of aerodynamic entrainment with interparticle cohesions based on discrete element method. Earth Surface Processes and Landforms 46, 1410–1418. doi:10.1002/esp.5109.
- Julien [2010] Julien, P.Y., 2010. Erosion and Sedimentation, Second Edition. Cambridge University Press, Cambridge.
- Kok [2010] Kok, J.F., 2010. An improved parametrization of wind blown sand flux on Mars that includes the effect of hysteresis. Geophysical Research Letters 37, L12202. doi:10.1029/2010GL043646.
- Kok et al. [2012] Kok, J.F., Parteli, E.J.R., Michaels, T.I., Karam, D.B., 2012. The physics of wind-blown sand and dust. Reports on Progress in Physics 75, 106901. doi:10.1088/0034-4885/75/10/106901.
- Kroy et al. [2002] Kroy, K., Sauermann, G., Herrmann, H.J., 2002. A minimal model for sand dunes. Physical Review Letters 64, 054301. doi:10.1103/PhysRevLett.88.054301.
- Lämmel and Kroy [2017] Lämmel, M., Kroy, K., 2017. Analytical mesoscale modeling of aeolian sand transport. Physical Review E 96, 052906. doi:10.1103/PhysRevE.96.052906.
- Martin et al. [2013] Martin, R.L., Barchyn, T.E., Hugenholtz, C.H., Jerolmack, D.J., 2013. Timescale dependence of aeolian sand flux observations under atmospheric turbulence. Journal of Geophysical Research: Atmospheres 118, 9078–9092. doi:10.1002/jgrd.50687.
- Martin and Kok [2017] Martin, R.L., Kok, J.F., 2017. Wind-invariant saltation heights imply linear scaling of aeolian saltation flux with shear stress. Science Advances 3, e1602569. doi:10.1126/sciadv.1602569.
- Nalpanis et al. [1993] Nalpanis, P., Hunt, J.C.R., Barrett, C.F., 1993. Saltating particles over flat beds. Journal of Fluid Mechanics 251, 661–685. doi:10.1017/S0022112093003568.
- Namikas [2003] Namikas, S.L., 2003. Field measurement and numerical modelling of aeolian mass flux distributions on a sandy beach. Sedimentology 50, 303–326. doi:10.1046/j.1365-3091.2003.00556.x.
- Namikas et al. [2003] Namikas, S.L., Bauer, B.O., Sherman, D.J., 2003. Influence of averaging interval on shear velocity estimates for aeolian transport modeling. Geomorphology 53, 235–246. doi:10.1016/S0169-555X(02)00314-8.
- Owen [1964] Owen, P.R., 1964. Saltation of uniform grains in air. Journal of Fluid Mechanics 20, 225–242.
- Pähtz et al. [2020] Pähtz, T., Clark, A.H., Valyrakis, M., Durán, O., 2020. The physics of sediment transport initiation, cessation, and entrainment across aeolian and fluvial environments. Reviews of Geophysics 58, e2019RG000679. doi:10.1029/2019RG000679.
- Pähtz and Durán [2018] Pähtz, T., Durán, O., 2018. The cessation threshold of nonsuspended sediment transport across aeolian and fluvial environments. Journal of Geophysical Research: Earth Surface 123, 1638–1666. doi:10.1029/2017JF004580.
- Pähtz and Durán [2020] Pähtz, T., Durán, O., 2020. Unification of aeolian and fluvial sediment transport rate from granular physics. Physical Review Letters 124, 168001. doi:10.1103/PhysRevLett.124.168001.
- Pähtz et al. [2013] Pähtz, T., Kok, J.F., Parteli, E.J.R., Herrmann, H.J., 2013. Flux saturation length of sediment transport. Physical Review Letters 111, 218002. doi:10.1103/PhysRevLett.111.218002.
- Pähtz et al. [2021] Pähtz, T., Liu, Y., Xia, Y., Hu, P., He, Z., Tholen, K., 2021. Unified model of sediment transport threshold and rate across weak and intense subaqueous bedload, windblown sand, and windblown snow. Journal of Geophysical Research: Earth Surface 126, e2020JF005859. doi:10.1029/2020JF005859.
- Pähtz et al. [2015] Pähtz, T., Omeradžić, A., Carneiro, M.V., Araújo, N.A.M., Herrmann, H.J., 2015. Discrete element method simulations of the saturation of aeolian sand transport. Geophysical Research Letters 42, 2063–2070. doi:10.1002/2014GL062945.
- Raffaele et al. [2020] Raffaele, L., Bruno, L., Sherman, D.J., 2020. Statistical characterization of sedimentation velocity of natural particles. Aeolian Research 44, 100593. doi:10.1016/j.aeolia.2020.100593.
- Ralaiarisoa et al. [2020] Ralaiarisoa, J.L., Besnard, J.B., Furieri, B., Dupont, P., Ould El Moctar, A., Naaim-Bouvet, F., Valance, A., 2020. Transition from saltation to collisional regime in windblown sand. Physical Review Letters 124, 198501. doi:10.1103/PhysRevLett.124.198501.
- Rasmussen et al. [1996] Rasmussen, K.R., Iversen, J.D., Rautahemio, P., 1996. Saltation and wind-flow interaction in a variable slope wind tunnel. Geomorphology 17, 19–28.
- Rasmussen and Sørensen [2008] Rasmussen, K.R., Sørensen, M., 2008. Vertical variation of particle speed and flux density in aeolian saltation: Measurement and modeling. Journal of Geophysical Research: Earth Surface 113, F02S12. doi:10.1029/2007JF000774.
- Sauermann et al. [2001] Sauermann, G., Kroy, K., Herrmann, H.J., 2001. A continuum saltation model for sand dunes. Physical Review E 64, 031305. doi:10.1103/PhysRevE.64.031305.
- Selmani et al. [2018] Selmani, H., Valance, A., Ould El Moctar, A., Dupont, P., Zegadi, R., 2018. Aeolian sand transport in out-of-equilibrium regimes. Geophysical Research Letters 45, 1838–1844. doi:10.1002/2017GL076937.
- Sleath [1984] Sleath, J.F.A., 1984. Sea Bed Mechanics (Ocean Engineering). John Wiley and Sons Inc., New York, NY, USA.
- Sørensen [2004] Sørensen, M., 2004. On the rate of aeolian sand transport. Geomorphology 59, 53–62. doi:10.1016/j.geomorph.2003.09.005.
- Ungar and Haff [1987] Ungar, J.E., Haff, P.K., 1987. Steady state saltation in air. Sedimentology 34, 289–299. doi:10.1111/j.1365-3091.1987.tb00778.x.
- Valance et al. [2015] Valance, A., Rasmussen, K.R., Ould El Moctar, A., Dupont, P., 2015. The physics of aeolian sand transport. Comptes Rendus Physique 16, 105–117. doi:10.1016/j.crhy.2015.01.006.
- Zhang et al. [2007] Zhang, W., Kang, J.H., Lee, S.J., 2007. Tracking of saltating sand trajectories over a flat surface embedded in an atmospheric boundary layer. Geomorphology 86, 320–331. doi:10.1016/j.geomorph.2006.09.005.
- Zhang et al. [2017] Zhang, Z., Dong, Z., Qian, G., 2017. Field observations of the vertical distribution of sand transport characteristics over fine, medium and coarse sand surfaces. Earth Surface Processes and Landforms 42, 889–902. doi:10.1002/esp.4045.