Spatial analysis of COVID-19 and socio-economic factors in Sri Lanka
Abstract
The spread of the global COVID-19 pandemic affected Sri Lanka similar to how it affected other countries across the globe. The Sri Lankan government took many preventive measures to suppress the pandemic spread. To aid policy makers in taking these preventive measures, we propose a novel district-wise clustering based approach. Using freely available data from the Epidemiological Department of Sri Lanka, a cluster analysis was carried out based on the COVID-19 data and the demographic data of districts. K-Means clustering and spectral clustering models were the selected clustering techniques in this study. From the many district-wise socio-economic factors, population, population density, monthly expenditure and the education level were identified as the demographic variables that exhibit a high similarity with COVID-19 clusters. This approach will positively impact the preventive measures suggested by the relevant policy making parties of the Sri Lankan government.
Index Terms:
COVID-19, k-means clustering, spectral clustering, spatial analysis, Sri LankaI Introduction
The daily cases of the novel Coronavirus (COVID-19) are increasing rapidly throughout the world, with Sri Lanka being no exception. Along with many neighbouring countries, Sri Lanka too was affected by COVID-19 with the first reported case being on the 11th of March 2020 [1]. The Sri Lankan government took preventive measures by enforcing lockdown strategies starting from 20th March 2020 continuing for 2 months. The continuous curfews and halting inter-district travels lead to a temporary suppression of the pandemic spread. However, studies have shown that policies and lockdown measures taken without adequate data-driven analysis results in side effects from multiple points of view[2, 3, 4]. For example, lack of social interactions has resulted in students of universities worldwide experiencing negative psychological impacts[5, 6, 7, 8]. In an economic sense, small business owners and labour workers have been affected by excessive lockdown measures and closure of industries[9]. Adverse effects have also occurred in Sri Lanka[10], mainly due to the sudden and uncontrolled lockdown procedures. This calls for optimal decision making when planning and scheduling travel restrictions and lockdown procedures.
Mathematically modelling COVID-19 in time and space is a major contributor for data-driven analysis and optimal decision making of COVID-19 related policies and lockdown measures[11]. One such straightforward method is the use of clustering algorithms to cluster sub-regions of a larger region based on COVID-19 related data. This allows for decisions to be made cluster-wise, thereby minimising economic and social effects due to lockdowns in safer regions. Clustering is the process of identifying similar points from a large sea of points and grouping them together, based on one or more properties[12]. To overcome and prevent the unfavourable situations on a community, multiple studies making use of clustering exists in literature. Clustering techniques have been used to study the hardships in living environments in India [13]. It was determined that clusters mainly depends on the availability of basic services for which spatial clustering has been utilized. In the COVID-19 domain, a group of experts have analysed the effectiveness of dimension reduction algorithms to analyse and cluster large volumes of COVID-19 genome sequences [14]. A spatial analysis of COVID-19 in the city of New York, USA has been carried out where the effect of multiple socio-economic factors on the average number of COVID-19 cases and deaths in each county is analysed[15].
Considering Sri Lanka, a study has been carried out to predict the total number of COVID-19 cases using statistical models[16]. However, as per the authors’ best knowledge, there exists a lack of published research on spatial analysis of COVID-19 in Sri Lanka, and how various socio-economic factors affect the severity of COVID-19 within the country. To bridge the gap in this research, the authors propose a spatial analysis of COVID-19 using a clustering based model which attempts to group similar districts of Sri Lanka exhibiting similar pandemic behaviours. These groups are then compared with various socio-economic factors, which in turn will take a step towards aiding policy makers determine strategies to suppress the disease spread optimally.
As the case study. freely available COVID-19 data from the Epidemiological Department of Sri Lanka was obtained. For this dataset, multiple pre-processing techniques were incorporated. Existing clustering algorithms were implemented to cluster these districts based on the COVID-19 cases and socio-economic features. The clustering of COVID-19 cases based on socio-economic features of districts was carried out to show that different demographics of different districts plays a major role in the pandemic spread. The results of this study show the correlations between a number of chosen demographic variables and COVID-19 severity in district clusters of Sri Lanka. Thereby, if additional preventive measures are imposed on the districts falling in the same cluster depending on their severity, the disease spread throughout the country can be drastically reduced and the health sector of the country can plan ahead with sufficient health resources. Thus, policy makers will be capable of taking preventive measures on similar districts which will aid in suppressing the disease spread.
II Methodology
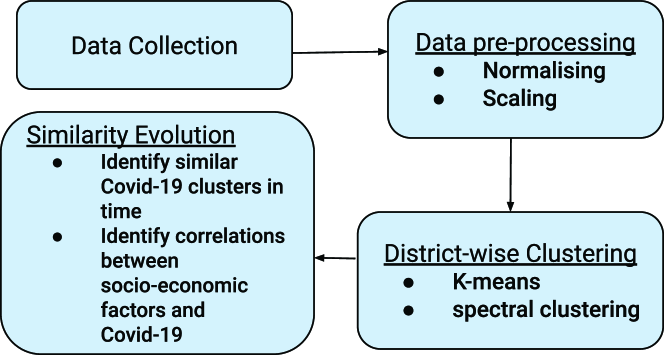
The Methodology is structured as follows. First, district-wise COVID-19 and relevant socio-economic and demographic data was obtained. Then, the data was pre-processed and standardised to allow for unbiased evaluations, followed by an implementation of multiple clustering algorithms to cluster districts of Sri Lanka based on COVID-19 cases in time. Using this, the optimal clustering algorithm was chosen, where the cluster labels were consistent with time. This clustering algorithm was then used to cluster socio-economic variables in each district. Finally, the similarity of clusters of COVID-19 and the chosen socio-economic variables were evaluated using a proposed dissimilarity metric. For further clarity, a process flow diagram of the methodology is depicted by Fig. 1.
II-A Data Preparation
| Feature type | Feature | Intuition | ||
| Population | Population | Potential capacity of COVID-19 spread | ||
| Population Density | Crowded-ness in public places | |||
| Economic | Total Monthly Expenditure |
|
||
| Monthly Expenditure on Food and non-Food items | Self-sufficency of households | |||
| Poverty rate | Measure of buying power | |||
| Education and Technology | Persons using Internet | Exposure to new information regarding COVID-19 | ||
| Number of years spent in Education |
|
|||
| Occupation | Persons engaging in skilled labour | A measure of social-distancing whilst carrying on their professsion | ||
| Persons engaging in unskilled labour | ||||
| Persons engaging in Agriculture | ||||
| Unemployment rate | Measure of both poverty and education level |
II-A1 Data collection
COVID-19 data was obtained from the Epidemiological Department of Sri Lanka[17] . This dataset contains daily district-wise information for the total number of COVID-19 confirmed cases from 15 November 2020 to 15 March 2021. Furthermore, demographic and socio-economic data was collected from the Department of Census and Statistics [18] of Sri Lanka. From the large repository of data, it was important to obtain the necessary district-wise information based on how it may affect the spread and severity of COVID-19. Therefore, a finite number of demographic and socio-economic variables was chosen. A list of these variables and the premise at which they were chosen is shown in Table I.
II-A2 Pre-processing
The importance of data pre-processing arises in the presence of data which is badly scaled, or that contains skewed distributions. However, altering the shape of the distribution of COVID-19 data would result in important information being left out of the dataset. Therefore, as a pre-processing step, multiple normalising and scaling techniques were implemented to pre-process the given dataset. Initially, the cluster analysis was carried out for the original dataset, void of any pre-processing techniques. Then, a number of techniques were implemented as summarised in Table II.
| Technique | Computation | Result Dataset |
|---|---|---|
| Population Normalisation | Divides the number of cases by the total population of each region | Cases per million persons |
| z-score standardisation | Epicurve of a region is subtracted by its mean value, then divided by its standard deviation | Distribution centered at 0 |
| Min-max scaling (district-wise) | Values in an epicurve are divided by the maximum value of that epicurve | Each epicurve ranges from 0 to 1 |
| Min-max scaling (total) | Values in an epicurve are divided by the maximum value of all epicurves dataset. | Whole dataset ranges from 0 to 1 |
II-B Clustering Districts of Sri Lanka Based on COVID-19 and Demographic Data
In this study, clustering techniques were carried out to cluster the districts of Sri Lanka based on COVID-19 cases. In particular, k-means clustering and spectral clustering[19, 20] algorithms were implemented. The choice of the aforementioned clustering algorithms was based on the principles that each algorithm uses to separate clusters. For instance, a clustering algorithm such as Gaussian Mixture Models (GMM)[21], often used in image-segmentation, would not be suitable to recognise time-series data such as COVID-19 cases as it is primarily a density estimation technique. Similar to clustering based on COVID-19, the aforementioned clustering algorithms were used to cluster districts based on socio-economic factors.
II-B1 k-means clustering
K-means clustering is one of the basic intuitive clustering algorithms. The objective is to cluster observations in to clusters where each observation belongs to cluster with the nearest cluster mean.
First, initial cluster centers are randomly initialized. Then, a cluster is assigned to each observation (point) by computing its nearest cluster center. Afterwards, a new cluster center is calculated using observations belonging to the particular cluster. This operation is repeated until clusters are converged. i.e. until the change of cluster mean after an iteration is less than a small value . This algorithm results in a clustering of observations that minimizes the within cluster variance.
II-B2 Spectral clustering
The idea behind spectral clustering algorithm uses connectivity in a graph to cluster each node (observation) in the graph [22]. The advantage of using spectral clustering is that there does not exist an assumption on the shape of the clusters.
First, the observations are represented as a graph by defining adjacency matrix using a distance metric between two observations. Then, the Laplacian of the adjacency matrix is obtained. By obtaining the Eigen-values of the Laplacian, we can identify the nature of the connectivity of the graph. The first nonzero eigenvalue is called the spectral gap. The spectral gap gives some notion of the density of the graph. The second eigenvalue is called the Fiedler value, and the corresponding vector is the Fiedler vector. The Fiedler value approximates the minimum graph cut needed to separate the graph into two connected components. If the graph already has two connected components Fiedler value will be 0. Using the Fiedler vector we can identify to which connected component each node belongs.
Spectral clustering algorithm looks for the first large gap between eigenvalues in order to find the number of clusters. The first eigen-vectors before this gap gives information about the cuts that will cluster the data into given number of clusters. We use K-means clustering on these first eigen-vectors to find the clustering labels of each observation.
II-C Similarity Evaluation of Clusters
II-C1 Modelling COVID-19 clusters in time
For policy makers to make decisions based on COVID-19 in a given region on a long-term basis, it is crucial that the nature of COVID-19 spread exhibits similar properties in the long term. To analyse this, the dataset was first divided into four 30-day periods. Then, districts of Sri Lanka were clustered based on COVID-19 cases of the first 30 days in the dataset using clustering algorithms mentioned in Section II-B. The change in districts in these clusters for the remaining three 30-day windows was computed according to Algorithm 1. This gives a measure of the number districts belonging to a specific cluster along the time axis. In other words, the similarity that each cluster maintains throughout a longer time period is quantified. The reason for using Algorithm 1 as opposed to a standard correlation analysis is due to spectral clustering being an unsupervised clustering algorithm, hence cluster labels are assigned randomly at each iteration. For example, if two clusters are generated using the same dataset at two instances, the algorithm at the first instance may label Cluster 1 as 0 and Cluster 2 as 1, whilst it may be the inverse in the second instance. Therefore, it is necessary to match the labels of clusters generated in multiple instances.
The optimal pre-processing technique and clustering technique among those which were mentioned previously in Section II-A and Section II-B respectively, were chosen based on the pair of techniques which result in the highest similarity of the district clusters in time, computed using Algorithm 1. In addition, the number of points in each cluster was considered, and parameters which resulted in biased clusters were avoided. This pair of techniques was then used to obtain comparisons between districts clustered according to COVID-19 cases and districts clustered based on socio-economic factors.
II-C2 Comparing effects of socio-economic factors on COVID-19 clusters
To analyse the effect of socio-economic factors on how districts have been clustered based on COVID-19 cases, a similar approach to Section II-C1 was carried out. Districts of Sri Lanka were clustered based on each socio-economic variable mentioned in Table I. As each variable is one-dimensional and each district corresponds to a single scalar value, cluster indexes were pre-set in increasing order. This method of clustering provides meaning and context to the output clusters. For instance, districts which belong to the cluster based on ’population’ with the smallest centroid value, will contain the districts with the smallest populations. The dissimilarity metric () between these clustered districts based on each socio-economic variable and COVID-19 were computed using Algorithm 1, similar to Section II-C1.
To outline the differences between the dissimilarity metrics () of two similar cluster outputs vs dissimilar cluster outputs, Algorithm 1 was carried out for both cluster outputs being known (which produces ), and also with one of the cluster outputs being a randomised array including cluster labels. For example, if district clusters based on population and COVID-19 were to be compared, a dissimilarity metric would also be obtained for district clusters obtained population and a randomly generated array of cluster labels. A Monte Carlo simulation would be carried out to obtain the mean dissimilarity () between the known cluster output and the randomised array. In this study, a total of 100 Monte Carlo simulations was carried out for such an instance. If , it would imply that there is a high similarity between the two chosen cluster outputs.
All code has been written in Python 3.8, on the online Google Collaboratory software (colab.google.io). Tensorflow 2.0 has been used as a Machine Learning tool, in addition to the conventional data science libraries in Python 3.8. The complete codebase can be found at: https://github.com/pdncovid/covid_clustering.
III Results and Discussion
| (i) | 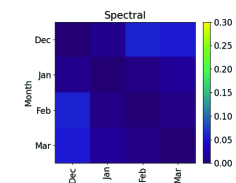 |
 |
|---|---|---|
| (ii) | 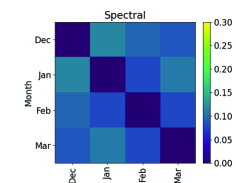 |
 |
| (a) | (b) |
III-A District-wise Clusters Based on COVID-19 Cases
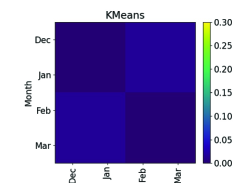
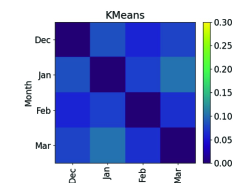
Fig. 2 shows the dissimilarity metric of districts clustered using k-means clustering based on COVID-19 cases in each month, for both original and min-max normalised data. In this figure, the lighter shade (higher end of the spectrum) corresponds to higher dissimilarities. It can be observed that both spectral clustering and k-means clustering show high similarity between months, for original data over normalised data. This is due to the mean value of each epicurve contributing to the clustering process. Similar to Fig. 2, comparisons were carried out for the remaining normalisation techniques in Table II, and original data was chosen as it contained the highest similarities between months.
Although k-means clustering exhibits a higher similarity between months when compared to spectral clustering even on original data, upon analysis of the number of points in each cluster, it was observed that almost all the points belong to a single cluster. This resulted in a biased cluster output, hence an omission of the k-means algorithm in the evaluations between clusters of COVID-19 and socio-economic variables.
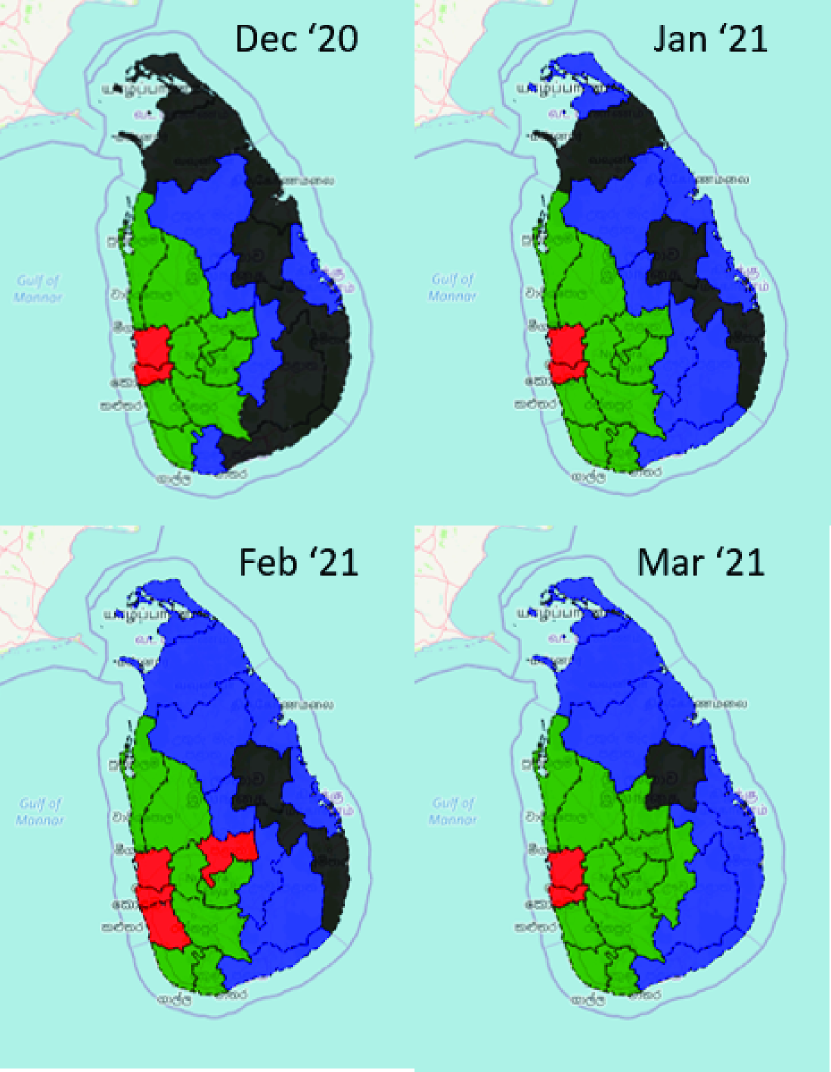
In contrast to k-means clustering, spectral clustering algorithm tends to optimally balance out the number of points in each output cluster. Therefore, spectral clustering using original COVID-19 data was used for further evaluations. A map of clustered districts in each month is shown in Fig. 3. Here, it is observed that the districts belonging to each cluster change minimally when moving from one month to another. This allows for the assumption that the nature of COVID-19 in a given region remains unchanged roughly throughout a period of one month, hence allowing for mid to long-term planning of lockdowns and other preventive measures.
III-B Similarity Between COVID-19 Clusters and Socio-economic Variables
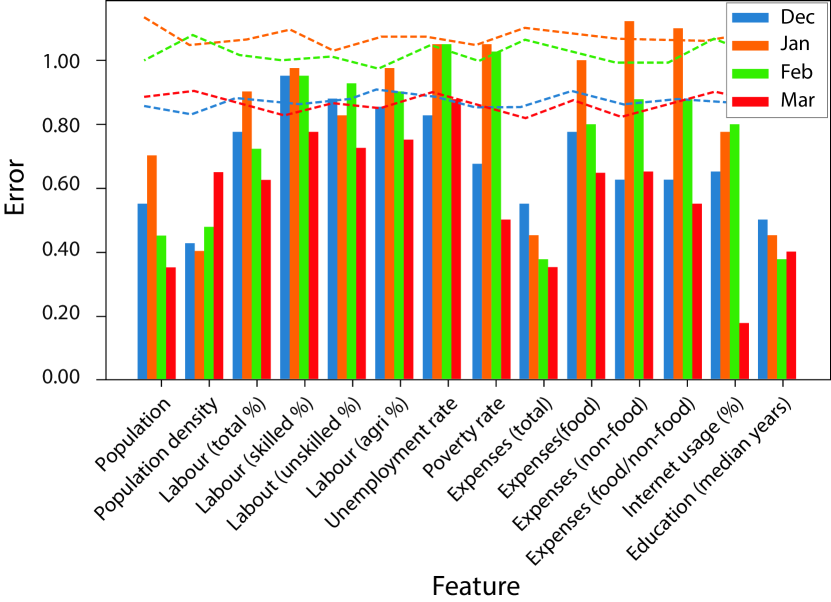
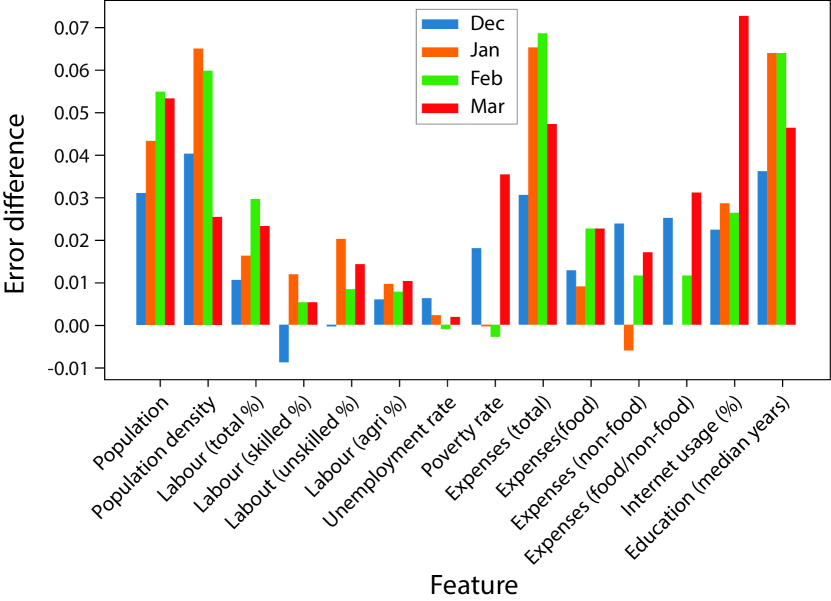
Fig. 4 depicts the dissimilarity metrics between each socio-economic variable and COVID-19 cluster for each month. To better represent the effect of socio-economic variables on COVID-19 the difference between random cluster and known cluster dissimilarities is computed for each socio-economic variable, as shown in Fig. 5. It can be observed that Population, Population density, Total monthly expenses and Median years spent in education have a low dissimilarity metric, as opposed to comparisons with other features and random labels. Another important observation is that the low dissimilarity of the these factors is consistent throughout the four months of study. This implies that policy makers should take into consideration the aforementioned socio-economic factors in their decision making process.
IV Conclusion and Future Directions
This study analyses the effect of socio-economic factors on COVID-19 in Sri Lanka. The authors propose spectral clustering on non-normalised data as the optimal technique to cluster districts of Sri Lanka based on COVID-19. Out of numerous socio-economic variables, population, population density, monthly expenditure and education level are suggested as the main factors that policy makers should consider when enforcing policies such as lockdown measures and travel restrictions. As the districts clustered based on COVID-19 cases contain high similarity throughout the time period, the proposed clustering technique will also promote localised decision making to control COVID-19 in the country.
This approach of data-driven analysis aids to bridge the gap between optimal and non-optimal decision making for COVID-19 policies in Sri Lanka. A challenge encountered during this research was the presumed disparity between actual COVID-19 cases and observed COVID-19 cases, thereby depicting an inaccurate measure of COVID-19 severity. The authors aim to analyze the actual infected cases from the observed tested cases, using an AI-based simulation model. This will further alleviate the quality of COVID-19 research in Sri Lanka, as it can be utilized as a foundation for many other epidemiological models and compartmental models which will aid in a better understanding of the pandemic situation.
References
- [1] T. Climate. Covid-sl-timeline. [Online]. Available: https://disease.lk/covid-sl-timeline/
- [2] J. Gao, P. Zheng, Y. Jia, H. Chen, Y. Mao, S. Chen, Y. Wang, H. Fu, and J. Dai, “Mental health problems and social media exposure during COVID-19 outbreak,” PLoS ONE, vol. 15, no. 4, pp. 1–10, 2020.
- [3] J. P. Ioannidis, “Coronavirus disease 2019: The harms of exaggerated information and non-evidence-based measures,” European Journal of Clinical Investigation, vol. 50, no. 4, pp. 1–5, 2020.
- [4] N. Bourdillon, S. Yazdani, L. Schmitt, and G. P. Millet, “Effects of COVID-19 lockdown on heart rate variability,” PLoS ONE, vol. 15, no. 11 November, pp. 1–10, 2020.
- [5] A. Kecojevic, C. H. Basch, M. Sullivan, and N. K. Davi, “The impact of the COVID-19 epidemic on mental health of undergraduate students in New Jersey, cross-sectional study,” PLoS ONE, vol. 15, no. 9 September, pp. 1–16, 2020.
- [6] M. H. Browning, L. R. Larson, I. Sharaievska, A. Rigolon, O. McAnirlin, L. Mullenbach, S. Cloutier, T. M. Vu, J. Thomsen, N. Reigner, E. C. Metcalf, A. D’Antonio, M. Helbich, G. N. Bratman, and H. O. Alvarez, “Psychological impacts from COVID-19 among university students: Risk factors across seven states in the United States,” PloS one, vol. 16, no. 1, 2021.
- [7] M. Akhtarul Islam, S. D. Barna, H. Raihan, M. Nafiul Alam Khan, and M. Tanvir Hossain, “Depression and anxiety among university students during the COVID-19 pandemic in Bangladesh: A web-based cross-sectional survey,” PLoS ONE, vol. 15, no. 8 August, pp. 1–12, 2020.
- [8] T. Gonzalez, M. A. De la Rubia, K. P. Hincz, M. Comas-Lopez, L. Subirats, S. Fort, and G. M. Sacha, “Influence of COVID-19 confinement on students’ performance in higher education,” PLoS ONE, vol. 15, no. 10 October, pp. 1–23, 2020.
- [9] A. W. Bartik, M. Bertrand, Z. Cullen, E. L. Glaeser, M. Luca, and C. Stanton, “The impact of COVID-19 on small business outcomes and expectations,” Proceedings of the National Academy of Sciences of the United States of America, vol. 117, no. 30, pp. 17 656–17 666, 2020.
- [10] “Gendered Impacts of COVID-19 on Small and Medium-Sized Enterprises in Sri Lanka,” 2020. [Online]. Available: www.ifc.org
- [11] K. Gombos, R. Herczeg, B. Eross, S. Z. Kovács, A. Uzzoli, T. Nagy, S. Kiss, Z. Szakács, M. Imrei, A. Szentesi, A. Nagy, A. Fábián, P. Hegyi, and A. Gyenesei, “Translating Scientific Knowledge to Government Decision Makers Has Crucial Importance in the Management of the COVID-19 Pandemic,” Population Health Management, vol. 24, no. 1, pp. 35–45, 2021.
- [12] R. Xu and D. Wunsch, “Survey of clustering algorithms,” IEEE Transactions on neural networks, vol. 16, no. 3, pp. 645–678, 2005.
- [13] A. Das, S. Ghosh, K. Das, T. Basu, I. Dutta, and M. Das, “Living environment matters: Unravelling the spatial clustering of covid-19 hotspots in kolkata megacity, india,” Sustainable Cities and Society, vol. 65, p. 102577, 2021.
- [14] Y. Hozumi, R. Wang, C. Yin, and G.-W. Wei, “Umap-assisted k-means clustering of large-scale sars-cov-2 mutation datasets,” Computers in biology and medicine, vol. 131, p. 104264, 2021.
- [15] J. Cordes and M. C. Castro, “Spatial analysis of covid-19 clusters and contextual factors in new york city,” Spatial and Spatio-temporal Epidemiology, vol. 34, p. 100355, 2020.
- [16] D. S. Ediriweera, N. R. de Silva, G. N. Malavige, and H. J. de Silva, “An epidemiological model to aid decision-making for COVID-19 control in Sri Lanka,” PLoS ONE, vol. 15, no. 8 August, pp. 1–10, 2020.
- [17] “Corona virus 2020, epidemiology unit official website.” [Online]. Available: https://epid.gov.lk
- [18] “Department of census and statistics, sri lanka.” [Online]. Available: http://www.statistics.gov.lk/
- [19] A. Likas, N. Vlassis, and J. J. Verbeek, “The global k-means clustering algorithm,” Pattern recognition, vol. 36, no. 2, pp. 451–461, 2003.
- [20] U. Von Luxburg, “A tutorial on spectral clustering,” Statistics and computing, vol. 17, no. 4, pp. 395–416, 2007.
- [21] D. A. Reynolds, “Gaussian mixture models.” Encyclopedia of biometrics, vol. 741, pp. 659–663, 2009.
- [22] D. B. West et al., Introduction to graph theory. Prentice hall Upper Saddle River, 2001, vol. 2.