latexText page 12 contains only floats \WarningFilterlatexText page 13 contains only floats
BERT-based distractor generation for Swedish reading comprehension questions using a small-scale dataset
Abstract
An important part when constructing multiple-choice questions (MCQs) for reading comprehension assessment are the distractors, the incorrect but preferably plausible answer options. In this paper, we present a new BERT-based method for automatically generating distractors using only a small-scale dataset. We also release a new such dataset of Swedish MCQs (used for training the model), and propose a methodology for assessing the generated distractors. Evaluation shows that from a student’s perspective, our method generated one or more plausible distractors for more than 50% of the MCQs in our test set. From a teacher’s perspective, about 50% of the generated distractors were deemed appropriate. We also do a thorough analysis of the results.
1 Introduction
Multiple-choice questions (MCQs) are widely used for student assessments, from high-stakes graduation tests to lower-stakes reading comprehension tests. An MCQ consists of a question (stem), the correct answer (key) and a number of wrong, but plausible options (distractors). The problem of automatically generating stems with a key has received a great deal of attention, e.g., see the survey by Amidei et al. (2018). By comparison, automatically generating distractors is substantially less researched, although Welbl et al. (2017) report that manually finding reasonable distractors was the most time-consuming part in writing science MCQs. Indeed, reasonable distractors should be grammatically consistent and similar in length compared to the key and within themselves.
Given the challenges above, we attempt using machine learning (ML) to aid teachers in creating distractors for reading comprehension MCQs. The problem is not new, however most of the prior work has been done for English. In this paper we propose the first such solution for Swedish (although the proposed method is novel even for English, to the best of our knowledge). The key contributions of this work are: proposing a BERT-based method for generating distractors using only a small-scale dataset, releasing SweQUAD-MC111The dataset and implementation of our models are available in this GitHub repository, a dataset of Swedish MCQs, and proposing a methodology for conducting human evaluation aimed at assessing the plausibility of distractors.
2 Background
| Property | Training | Development | Test |
|---|---|---|---|
| # of texts | 434 | 64 | 45 |
| # of MCQs | 962 | 126 | 102 |
| # of D | |||
| Len(Text) | |||
| Len(A) | |||
| Len(D) | |||
| Len(A) - Len(D) |
2.1 BERT for NLG
Devlin et al. (2019) introduced BERT as the first application of the Transformer architecture (Vaswani et al., 2017) to language modelling. BERT uses only Transformer’s encoder stacks (with multi-head self-attention, MHSA), while the NLG community relies more on Transformer’s decoder stacks (with masked MHSA) for text generation, e.g., GPT (Radford et al., 2018). However, Wang and Cho (2019) showed that BERT is a Markov random field, meaning that BERT learns a joint probability distribution over all sentences of a fixed length, and one could use Gibbs sampling to generate a new sentence. The authors compared samples generated autoregressively left-to-right by BERT and GPT, and found the perplexity of BERT samples to be higher than GPT’s (BERT samples are of worse quality), but the n-gram overlap between the generated texts and texts from the dataset to be lower (BERT samples are more diverse).
Liao et al. (2020) show a way to improve BERT’s generation capabilities via changing the masking scheme to a probabilistic one at training time. Probabilistically masked language models (PMLMs) assume that the masking ratio for each sentence is drawn from a prior distribution . The authors proposed to train a PMLM with a uniform prior (referred to as u-PMLM). The absence of the left-to-right restriction allows the model to generate sequences in an word arbitrary order. In fact, Liao et al. (2020) propose to generate sentences by randomly selecting the masked position, predicting a token for it, replacing the masked token with the predicted one and repeating the process until no masked tokens are left. The authors showed that the perplexity of the texts generated by u-PMLM is comparable to the ones by GPT.
2.2 Convolution partial tree kernels
As mentioned previously, plausible distractors should be grammatically consistent with the key. Hence, a metric measuring grammatical consistency would be useful both for quantitative evaluation and as a basis for a baseline method. We propose to use convolution partial tree kernels (CPTK) for these purposes. CPTK were proposed by Moschitti (2006) for dependency trees and essentially calculate the number of common tree structures (not only full subtrees) between two given trees. However, CPTKs can not handle labeled edges and were applied to dependency trees containing only lexicals. Another solution, proposed by Croce et al. (2011) and used in this article, is to include edge labels, i.e., grammatical relations (GR), as separate nodes. A resulting computational structure is Grammatical Relation Centered Tree (GRCT), which transforms the original dependency tree by making each PoS-tag a child of a GR node and a father of a lexical node. CPTKs can take any non-negative values and are thus hard to interpret. Hence, we use normalized CPTK (NCPTK) shown in Equation (1), where is the CPTK applied to the dependency trees and .
| (1) |
Evidently, when and are the same, equals to 1, which is the highest value it can take.
3 Data
We have collected a Swedish dataset, henceforth referred to as SweQUAD-MC, consisting of texts and MCQs for the given texts. The dataset was created by three paid linguistics students instructed to pose unambiguous and independent questions. They were also asked to identify the key with at least two distractors, all of which are contiguous phrases in a given text. Additionally, as the distractors were required to be in the same grammatical form as the key (e.g., both in plural), the students were allowed to change the grammatical form of phrases if they constituted plausible distractors after this change. The exact instructions given to the students along with more details on the used texts are provided in Appendix A.
Each datapoint in SweQUAD-MC consists of a base text and an MCQ, i.e. a stem, the key and at least two distractors. The same text can be reused for different MCQs, but the sets of texts in training (), development () and test () datasets are disjoint. However, some overlap in sentences is possible, since the texts might come from the same source. Descriptive statistics of all SweQUAD-MC splits is provided in Table 1.
4 Method
Given the small scale of SweQUAD-MC we have decided to fine-tune a pretrained BERT222bert-base-cased for Swedish Malmsten et al. (2020) on the task of distractor generation (DG). For achieving this, we have added on top of BERT two linear layers with layer normalization Ba et al. (2016) in the middle to be trained from scratch (see architecture in Figure 1). The last linear layer is followed by a softmax activation giving probabilities over the tokens in the vocabulary for each position in the text. We trained the model using cross-entropy loss only for tokens in masked positions.
Recall that each MCQ consists of a base text T, the stem Q based on T, the key A and (on average) two distractors D1 and D2. The DG problem is then to generate distractors conditioned on the context, consisting of T, Q and A. We provide all context components as input to the BERT model, separated from each other by the special separator token [SEP]. Given that BERT’s maximum input length is 512 tokens, we trim T to the first 384 tokens (later referred to as T_384), since that is the average text length of the training set.
We have explored two different solution variants of DG. The first variant aims at generating distractors autoregressively, left to right. At generation time, the input to BERT consists of a context CTX (T_384, Q and A separated by [SEP] token), a [SEP] token, and a [MASK] token at the end. After a forward pass through BERT, the [MASK] token gets replaced by the word with the highest softmax score, which becomes the first word of the first distractor (dubbed D11). The generation of the first distractor continues by appending a [MASK] token after each forward pass until the network generates a separator token [SEP], which concludes the generation of the first distractor D1. The next distractor D2 is generated in the same way, except that the CTX is extended by D1. At training time, we use the same procedure, but with teacher forcing, allowing us to use the correct distractor tokens as targets for the cross-entropy loss (see example training datapoints for one MCQ in Table 2).
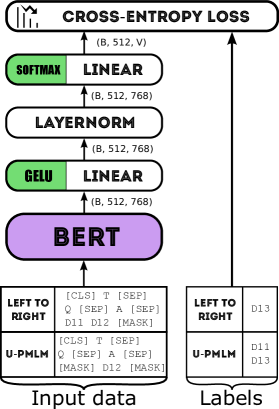
The second variant is inspired by u-PMLM, and aims at generating distractors autoregressively, but in an arbitrary word order. At generation time, the input to BERT consists of a context CTX, a [SEP] token, and a predefined number of [MASK] tokens (see Section 6.1). The generation proceeds by unmasking the token at the position where the model is most confident. This differs from unmasking a random position, proposed by Liao et al. (2020). The training procedure largely follows a masking scheme employed by u-PMLM by drawing the masking ratio from the uniform distribution (see example training datapoints for one MCQ in Table 2). Note that we do not include the [SEP] token when training, since we found that the trained model would constantly generate [SEP] tokens.
Each sampled masking ratio for the u-PMLM variant means that each token in the distractors from the dataset has a probability to be masked. Hence, different will potentially result in different number of masked tokens and at different positions. The number of times we draw per distractor DX is proposed to be .
| Input for left-to-right variant | Target |
| [CLS] CTX [SEP] [MASK] | D11 |
| [CLS] CTX [SEP] D11 [MASK] | D12 |
| [CLS] CTX [SEP] D11 D12 [MASK] | [SEP] |
| [CLS] CTX [SEP] D11 D12 [SEP] [MASK] | D21 |
| [CLS] CTX [SEP] D11 D12 [SEP] D21 [MASK] | D22 |
| [CLS] CTX [SEP] D11 D12 [SEP] D21 D22 [MASK] | D23 |
| [CLS] CTX [SEP] D11 D12 [SEP] D21 D22 D23 [MASK] | [SEP] |
| Input for u-PMLM variant | Target(s) |
| [CLS] CTX [SEP] D11 [MASK] | D12 |
| [CLS] CTX [SEP] [MASK] D12 | D11 |
| [CLS] CTX [SEP] D11 D12 [SEP] D21 [MASK] [MASK] | D22, D23 |
| [CLS] CTX [SEP] D11 D12 [SEP] D21 [MASK] D23 | D22 |
| [CLS] CTX [SEP] D11 D12 [SEP] [MASK] D22 [MASK] | D21, D23 |
4.1 Baseline
As mentioned in Section 2.2, NCPTK measures grammatical consistency between the key and a distractor. Our baseline uses NCPTK on Universal Dependencies (UD) trees (Nivre et al., 2020) in the following way. For each given MCQ, we exclude the sentence containing the key from the base text and then parse each remaining sentence of the text, and the key using the UD parser for Swedish. Let and denote a dependency tree corresponding to and the key respectively. For each , we find all subtrees with the root having the same universal PoS-tag and the same universal features (representing morphological properties of the token) as the root of . If no subtrees are found, no distractors can be suggested for this MCQ. Otherwise, we calculate NCPTK between each found subtree and (both as GRCT, but without lexicals). Then we take the textual representation of the subtrees with the highest NCPTK as the distractor suggestions.
5 Experimental setup
We have used Huggingface’s Transformers library Wolf et al. (2020) for implementing the DG model. The training hardware setup included 16 Intel Xeon CPU E5-2620 v4 (2.10GHz), 64 GB of RAM and 1 NVIDIA GeForce RTX 2080 Ti (11 GB VRAM). For this setup, we have fixed the random seed to 42, the number of training epochs to 6, the batch size to 4 (for both training and dev sets) and MAX_MASKINGS to 20 (for u-PMLM variant only). With these settings, training took about 3.67h for the left-to-right and 3h for the u-PMLM variant.
UD trees for the baseline were obtained using Stanza package Qi et al. (2020) and convolution partial tree kernels on the UD trees were calculated using UDon2 library Kalpakchi and Boye (2020). Baseline requires no training and running our implementation of the baseline takes about a minute on the development or test set.
6 Evaluation
Following the analysis of Rodriguez (2005), we generate three distractors per MCQ for each model. Due to prohibitively high costs of human evaluation, we have divided the evaluation process into two stages. The first stage is quantitative evaluation, which gives limited information about the model’s quality, but is sufficient for model selection. The second stage is human evaluation of the best model, selected during the first stage.
6.1 Quantitative evaluation
Automatic evaluation metrics, such as BLEU (Papineni et al., 2002), ROUGE (Lin, 2004), METEOR (Denkowski and Lavie, 2014), CIDEr (Vedantam et al., 2015), became popular in NLG in recent years. Essentially, these metrics rely on comparing word overlap between a generated distractor and a reference one. Such metrics can yield a low score even if the generated distractor is valid but just happens to be different from the reference one, or a high score even though the distractor is ungrammatical but happens to have a high word overlap with the reference one (see the article by Callison-Burch et al. (2006) for a further discussion). Furthermore, they do not take into account how well a generated distractor is aligned with the key grammatically or how challenging the whole group of generated distractors would be.
To account for the properties mentioned above, we have experimented with a number of quantitative metrics and propose the following set to be used (the whole list is available in Appendix B). In the following list MCQ% means “Percentage of MCQ” and DIS means “generated distractor(s)”.
-
1.
DisRecall. Distractor recall.
-
2.
AnyDisRefMatch. MCQ% with at least 1 DIS matching a reference one.
-
3.
AnyDisInText. MCQ% with at least 1 DIS appearing in the base text.
-
4.
KeyInDis. MCQ% with key being among DIS.
-
5.
AnySameDis. MCQ% with identical DIS.
-
6.
AllSameDis. MCQ% with all identical DIS.
-
7.
AnyDisRep. MCQ% with DIS containing repetitive words contiguously.
-
8.
AnyDisEmpty. MCQ% with DIS being an empty string333After excluding the special tokens, e.g., [SEP].
-
9.
AnyDisFromTrainDis. MCQ% with at least 1 DIS matching with a distractor from training data, but not appearing in the base text.
-
10.
MeanNCPTK, MedianNCPTK, ModeNCPTK. Mean, median, and mode NCPTK for pairs of UD trees for DIS and keys (all trees as GRCT, but ignoring nodes corresponding to lexicals).
The first group consists of metrics 1-3. The first two metrics count exact matches between generated and reference distractors. The rationale behind metric 3 is our assumption that distractors coming from the same text are more challenging. The higher the values of all these metrics are, the better.
The second group contains metrics 4-8, which give an idea of how challenging the whole group of distractors would be. For instance, duplicate distractors or ones with word repetitions could be excluded by students using common sense. The lower the metrics in this group are, the better.
The third group consists only of metric 9, serving as an overfitting indicator. The metric accounts for the distractors appearing as distractors in training data and high percentage indicates an overfitting possibility. The lower the values, the better.
The final group (item 10) measures how syntactically aligned generated distractors and the respective keys are. We employ NCPTK to measure the similarity of syntactic structures between each distractor and the respective key. Then we take mean, median and mode of the sequence of NCPTKs obtained in the previous step. The higher the values of these metrics are, the better.
| Metric | Baseline | u-PMLM |
|---|---|---|
| DisRecall | 1.44% | 15.31% |
| AnyDisRefMatch | 2.94% | 26.47% |
| AnyDisInText | 100.0% | 72.55% |
| KeyInDis | 0.00% | 4.9% |
| AnySameDis | 4.9% | 13.73% |
| AllSameDis | 0.00% | 1.96% |
| AnyDisRep | 0.00% | 2.94% |
| AnyDisEmpty | 11.76% | 0.00% |
| AnyDisFromTrainDis | NA | 0.98% |
| MeanNCPTK | 0.43 | 0.43 |
| MedianNCPTK | 0.28 | 0.28 |
| ModeNCPTK | 1.0 | 1.0 |
| (20.56%) | (20.69%) |
Based on these metrics, we performed a model selection on the development set and chose the models performing best on the most of these metrics. Left-to-right model generated distractors token by token until either a [SEP] token was generated or the length of the distractor was 20 tokens. In contrast, u-PMLM needs the lengths of the distractors to be decided in beforehand, which we set to be the lengths of the two reference distractors and the length of the key444If reference distractors are not available, we propose to generate distractors with the length differing by at most two words compared to the length of the key.. Surprisingly, the order of distractors in terms of their length also matters for generation with u-PMLM, so we have tested three options: shortest first, longest first and random order. According to the results of model selection on the development set (presented in detail in Appendix C), u-PMLM models outperformed left-to-right models by a substantial margin.
The best u-PMLM model (generating shortest distractors first) and the baseline have been evaluated on the test set (see Table 3). Interestingly, the similarity of syntactic structures between the key and distractors (assessed by NCPTK) is the same for both baseline (that actually relies on NCPTK) and u-PMLM. At the same time, u-PMLM generates more distractors matching the reference ones compared to the baseline (as seen from DisRecall and AnyDisRefMatch). The baseline generates at least one empty string as a distractor 11.76% of the time (compared to no such cases for u-PMLM) limiting possibilities of using the baseline in the real-life applications.
6.2 Human evaluation
We have used distractors generated on the test set by the best u-PMLM model (selected after quantitative evaluation in Section 6.1) to conduct human evaluation in 2 stages: from a perspective of a student and a teacher.
6.2.1 Student’s perspective
A desirable property of reading comprehension MCQs is that the students should be unable to answer them correctly without reading the actual text. To put more formally, the average number of correctly answered MCQs without reading the actual text (denoted ) should not differ significantly from the average number of correctly answered MCQs when choosing the answer uniformly at random (denoted ). To test for this property, we have formulated the following two hypotheses.555Preregistration is available here
: .
: .
For MCQs with 4 options, , which for our test set would be equal to . The appropriate statistical test in this case is one-sample two-tailed t-test with the aim of not being able to reject . Given that the purpose is to show that the data supports , we have set both the probability of type I errors and the probability of type II errors to be . Then we have used G*Power (Faul et al., 2009) to calculate the required sample size for finding a medium effect size (0.5) and the given and , which turned out to be 54 subjects.
Following the calculations above, we have recruited 54 subjects on the Prolific platform666https://www.prolific.co/, and instructed them to choose the most plausible answer to a number of reading comprehension MCQs without providing the original texts. The collected data did not violate any assumptions for a one-sample t-test (see Appendix D.1 for more details). On average, the subjects correctly answered a significantly larger number of questions than (, , ). To summarize, the chances of this sample to be collected are very low if were true.
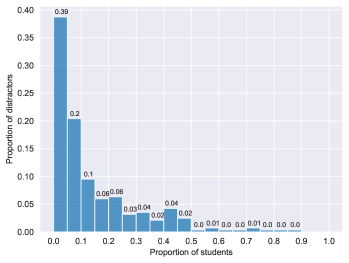
However, evidently some of the generated distractors were actually plausible, given that . To investigate the matter we have plotted the histogram of the frequency of choice of distractors by the subjects in Figure 2. As suggested by Haladyna and Downing (1993), distractors that are chosen by less than 5% of students should not be used, which in our case amounts to 39% of the distractors (the leftmost bar in Figure 2). If we eliminate these low-frequency distractors (LF-DIS), 68 MCQs (66.67%) will lose at least one distractor, 10 MCQs (9.8%) will lose all distractors and thus 34 MCQs (33.33%) will keep all 3 distractors.
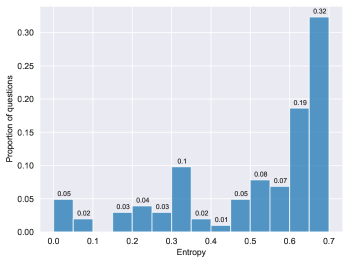
A more relaxed question is how many MCQs had at least one plausible distractor, which can be estimated by calculating the entropy for each question as shown in Equation (2), where is the key, is a distractor, is the stem, () is the probability that the key (any distractor) is chosen for by a subject.
| (2) |
The distribution of entropies per question is shown in Figure 3. Assuming the natural logarithm, the highest theoretically possible value for is , if . 32% of MCQs had an entropy larger than 0.65, whereas 51% had an entropy larger than 0.6, which means that half of MCQs had at least one plausible distractor.
6.2.2 Teacher’s perspective
Bearing in mind the findings of Section 6.2.1, it is interesting to see which of the proposed distractors (especially, among LF-DIS) teachers would mark as acceptable. Given the complexity of such evaluation, using the whole test set was infeasible. To get a representative sample, we used entropy per question (shown in Figure 3). All MCQs were divided into 5 equally sized buckets by entropy and 9 MCQs were sampled uniformly at random from each bucket, resulting in 45 MCQs in total.
We asked 5 teachers to evaluate each MCQ (presented in a random order for each of them). Each MCQ contained the base text, the stem, the key and the generated distractors. The teachers were instructed to select those of generated distractors (if any) deemed suitable for testing reading comprehension. Additionally, we asked to provide their reasons for each rejected distractor in a free-text input. The inter-annotator agreement (IAA) was estimated using Goodman-Kruskal’s Goodman and Kruskal (1979), specifically its multirater version proposed by Kalpakchi and Boye (2021). On the scale proposed by Rosenthal (1996), we have found a very large agreement (, see Appendix D.2.2 for more details on IAA calculations).
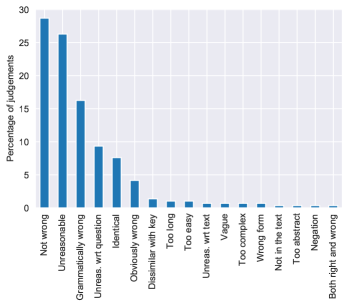
On average, 1.47 distractors per MCQ were accepted by a teacher. Their reasons for rejections are distributed as shown in Figure 4. All teachers accepted at least one generated distractor for 39 MCQs (86.7%), whereas the majority of teachers did so for 27 MCQs (60%). Interestingly, there are no MCQs in which all 5 teachers have either accepted or rejected all generated distractors. However, the majority of teachers has accepted or rejected all distractors for 4 MCQs (8.9%) and 6 MCQs (13.3%) respectively.
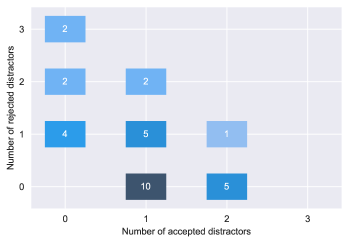
Out of 45 MCQs, 31 (68.9%) had at least one LF-DIS, as defined in Section 6.2.1. For these 31 MCQs we report a distribution of accepted/rejected LF-DIS by the majority of teachers in Figure 5. Let us call the 15 MCQs with all LF-DIS accepted by the majority of teachers as mismatch MCQs (lowest row in Figure 5). Interestingly, 12 of the 15 mismatch MCQs had at least one more distractor in addition to LF-DIS being accepted by the majority of teachers. Furthermore, all mismatch MCQs had entropy higher than 0.3. This entails that almost a half of LF-DIS should not necessarily be thrown away, since they were accepted by teachers, but the MCQs either happened to have more plausible distractors or subjects might have had relevant background knowledge to answer the questions.
7 Related work
We employed a systematic process to get a comprehensive overview of DG methods (see Appendix E for more details). Out of the resulting 28 articles (see an overview in Table 4), only 2 worked with a language other than English (Chinese and Basque). In this paper we work on reading comprehension MCQs, which makes only 12 papers, dealing with factual questions, relevant.
Two of these used rule-based approaches. Majumder and Saha (2015) generated MCQs for cricket domain and used a number of hand-crafted rules based on gazeteers and Wikipedia entries to generate distractors. Mitkov and Ha (2003) proposed to generate distractors for MCQs on electronic instructional documents using WordNet.
| Problem/method property | # |
|---|---|
| Extractive | 14 |
| Generative, rule-based | 7 |
| Generative, neural | 7 |
| Only automatic evaluation | 5 |
| Only human evaluation | 19 |
| Automatic and human evaluattion | 4 |
| Cloze-style, single-word answers | 14 |
| Cloze-style, continue the sentence | 2 |
| Factual questions | 12 |
Six of these relied on extractive approaches. Liang et al. (2018), Welbl et al. (2017), and Ha and Yaneva (2018) formulated choosing a distractor as a ranking problem from the given candidate set. In the first two articles the candidate set constituted all distractors from the available MCQ dataset. The authors then trained ML-based ranker(s) for choosing the best distractors. In the last one, the candidate set was created using content engineers. Distractors with a high similarity of their concept embeddings (summed for multiple words) and appearing in the same document as the key are ranked higher. Stasaski and Hearst (2017) and Araki et al. (2016) worked in the domain of biology. The former used an ontology and the latter employed event graphs containing information about coreferences to generate distractors. Karamanis et al. (2006) used thesaurus and tf-idf to identify key concepts in the given text and then select as distractors those having the same semantic type as the key.
The remaining four employed neural methods and are most relevant among the surveyed. Qiu et al. (2020) trained a sequence-to-sequence (seq2seq) model with a number of attention layers. Zhou et al. (2020) also employed a seq2seq model, but with a hierarchical attention to capture the interaction between a text and a question, as well as semantic similarity loss. Both articles used a beam search combined with filtering based on Jaccard coefficient at generation time. Offerijns et al. (2020) trained a GPT-2 model to generate 3 distractors for a given MCQ, and used BERT-based question answering model for quantitative evaluation (along with human evaluation).
Finally, Chung et al. (2020) proposed a BERT-based method for English with answer-negative regularization, penalizing distractors for containing the same words as the key, and training a sequential and a parallel MLM model simultaneously. At generation time, they generate one distractor, and then create a distractor set of the predefined size based on sampling from the probability distribution returned by BERT for each token of the distractor. Then they rank every triple of distractors based on the entropy of a separately trained QA model.
Our method also relies on BERT, but has a number of differences beyond being applied to Swedish. Firstly, we did not include answer-negative regularization, since it is not always a good strategy. For instance, given the stem “When should you pay a fee if you apply for a visa?” and a key “before you have submitted the application”, the best distractor would be “after you have submitted the application”, which shares most of the words with the key. Secondly, we generate distractors in arbitrary word order compared to left-to-right generation in Chung et al. (2020). Thirdly, at generation time, we use previously generated distractors as input for generating next ones, and always take tokens with a maximum probability. This lowers the risk of generating ungrammatical distractors. Finally, our training set is 100 times smaller compared to the training set used by Chung et al. (2020).
8 Conclusion
We have collected SweQUAD-MC, the first dataset of Swedish MCQs, and showed the possibility of training usable BERT-based DG models, despite the small scale of the dataset. We have showed that a u-PMLM variant of the BERT-based DG model performs best on the dataset, and proposed a novel methodology of evaluating the plausibility of generated distractors. Around half of the generated distractors were found acceptable by the majority of teachers, and more than 50% of MCQs had at least one plausible generated distractor, judging by the entropy of students’ responses.
Bearing in mind that the aim of the proposed method is to support (not replace) teachers, we deem that our method works well for MCQs in Swedish (and potentially in other languages with a pretrained BERT and a dataset of a similar scale).
Furthermore, we have presented a baseline applicable to any language with a UD treebank (currently about 100 languages). Although its performance is nowhere near the u-PMLM variant, we believe that it can serve as a good point of comparison to emerging neural methods for other languages.
Acknowledgments
This work was supported by Vinnova (Sweden’s Innovation Agency) within project 2019-02997. We would like to thank the anonymous reviewers for their comments, as well as Gabriel Skantze and Bram Willemsen for their helpful feedback prior to the submission of the paper.
References
- Amidei et al. (2018) Jacopo Amidei, Paul Piwek, and Alistair Willis. 2018. Evaluation methodologies in automatic question generation 2013-2018. In Proceedings of the 11th International Conference on Natural Language Generation, pages 307–317, Tilburg University, The Netherlands. Association for Computational Linguistics.
- Araki et al. (2016) Jun Araki, Dheeraj Rajagopal, Sreecharan Sankaranarayanan, Susan Holm, Yukari Yamakawa, and Teruko Mitamura. 2016. Generating questions and multiple-choice answers using semantic analysis of texts. In Proceedings of COLING 2016, the 26th International Conference on Computational Linguistics: Technical Papers, pages 1125–1136, Osaka, Japan. The COLING 2016 Organizing Committee.
- Ba et al. (2016) Jimmy Lei Ba, Jamie Ryan Kiros, and Geoffrey E Hinton. 2016. Layer normalization. arXiv preprint arXiv:1607.06450.
- Callison-Burch et al. (2006) Chris Callison-Burch, Miles Osborne, and Philipp Koehn. 2006. Re-evaluating the role of Bleu in machine translation research. In 11th Conference of the European Chapter of the Association for Computational Linguistics, Trento, Italy. Association for Computational Linguistics.
- Chung et al. (2020) Ho-Lam Chung, Ying-Hong Chan, and Yao-Chung Fan. 2020. A BERT-based distractor generation scheme with multi-tasking and negative answer training strategies. In Findings of the Association for Computational Linguistics: EMNLP 2020, pages 4390–4400, Online. Association for Computational Linguistics.
- Croce et al. (2011) Danilo Croce, Alessandro Moschitti, and Roberto Basili. 2011. Structured lexical similarity via convolution kernels on dependency trees. In Proceedings of the 2011 Conference on Empirical Methods in Natural Language Processing, pages 1034–1046, Edinburgh, Scotland, UK. Association for Computational Linguistics.
- Denkowski and Lavie (2014) Michael Denkowski and Alon Lavie. 2014. Meteor universal: Language specific translation evaluation for any target language. In Proceedings of the Ninth Workshop on Statistical Machine Translation, pages 376–380, Baltimore, Maryland, USA. Association for Computational Linguistics.
- Devlin et al. (2019) Jacob Devlin, Ming-Wei Chang, Kenton Lee, and Kristina Toutanova. 2019. BERT: Pre-training of deep bidirectional transformers for language understanding. In Proceedings of the 2019 Conference of the North American Chapter of the Association for Computational Linguistics: Human Language Technologies, Volume 1 (Long and Short Papers), pages 4171–4186, Minneapolis, Minnesota. Association for Computational Linguistics.
- Faul et al. (2009) Franz Faul, Edgar Erdfelder, Axel Buchner, and Albert-Georg Lang. 2009. Statistical power analyses using g* power 3.1: Tests for correlation and regression analyses. Behavior research methods, 41(4):1149–1160.
- Goodman and Kruskal (1979) Leo A Goodman and William H Kruskal. 1979. Measures of association for cross classifications. Measures of association for cross classifications, pages 2–34.
- Ha and Yaneva (2018) Le An Ha and Victoria Yaneva. 2018. Automatic distractor suggestion for multiple-choice tests using concept embeddings and information retrieval. In Proceedings of the Thirteenth Workshop on Innovative Use of NLP for Building Educational Applications, pages 389–398, New Orleans, Louisiana. Association for Computational Linguistics.
- Haladyna and Downing (1993) Thomas M Haladyna and Steven M Downing. 1993. How many options is enough for a multiple-choice test item? Educational and psychological measurement, 53(4):999–1010.
- Kalpakchi and Boye (2020) Dmytro Kalpakchi and Johan Boye. 2020. UDon2: a library for manipulating Universal Dependencies trees. In Proceedings of the Fourth Workshop on Universal Dependencies (UDW 2020), pages 120–125, Barcelona, Spain (Online). Association for Computational Linguistics.
- Kalpakchi and Boye (2021) Dmytro Kalpakchi and Johan Boye. 2021. Quinductor: a multilingual data-driven method for generating reading-comprehension questions using universal dependencies. arXiv preprint arXiv:2103.10121.
- Karamanis et al. (2006) Nikiforos Karamanis, Le An Ha, and Ruslan Mitkov. 2006. Generating multiple-choice test items from medical text: A pilot study. In Proceedings of the Fourth International Natural Language Generation Conference, pages 111–113, Sydney, Australia. Association for Computational Linguistics.
- Liang et al. (2018) Chen Liang, Xiao Yang, Neisarg Dave, Drew Wham, Bart Pursel, and C. Lee Giles. 2018. Distractor generation for multiple choice questions using learning to rank. In Proceedings of the Thirteenth Workshop on Innovative Use of NLP for Building Educational Applications, pages 284–290, New Orleans, Louisiana. Association for Computational Linguistics.
- Liao et al. (2020) Yi Liao, Xin Jiang, and Qun Liu. 2020. Probabilistically masked language model capable of autoregressive generation in arbitrary word order. In Proceedings of the 58th Annual Meeting of the Association for Computational Linguistics, pages 263–274, Online. Association for Computational Linguistics.
- Lin (2004) Chin-Yew Lin. 2004. ROUGE: A package for automatic evaluation of summaries. In Text Summarization Branches Out, pages 74–81, Barcelona, Spain. Association for Computational Linguistics.
- Majumder and Saha (2015) Mukta Majumder and Sujan Kumar Saha. 2015. A system for generating multiple choice questions: With a novel approach for sentence selection. In Proceedings of the 2nd Workshop on Natural Language Processing Techniques for Educational Applications, pages 64–72, Beijing, China. Association for Computational Linguistics.
- Malmsten et al. (2020) Martin Malmsten, Love Börjeson, and Chris Haffenden. 2020. Playing with words at the national library of sweden–making a swedish bert. arXiv preprint arXiv:2007.01658.
- Mitkov and Ha (2003) Ruslan Mitkov and Le An Ha. 2003. Computer-aided generation of multiple-choice tests. In Proceedings of the HLT-NAACL 03 Workshop on Building Educational Applications Using Natural Language Processing, pages 17–22.
- Moschitti (2006) Alessandro Moschitti. 2006. Efficient convolution kernels for dependency and constituent syntactic trees. In European Conference on Machine Learning, pages 318–329. Springer.
- Nivre et al. (2020) Joakim Nivre, Marie-Catherine de Marneffe, Filip Ginter, Jan Hajič, Christopher D. Manning, Sampo Pyysalo, Sebastian Schuster, Francis Tyers, and Daniel Zeman. 2020. Universal Dependencies v2: An evergrowing multilingual treebank collection. In Proceedings of the 12th Language Resources and Evaluation Conference, pages 4034–4043, Marseille, France. European Language Resources Association.
- Offerijns et al. (2020) Jeroen Offerijns, Suzan Verberne, and Tessa Verhoef. 2020. Better distractions: Transformer-based distractor generation and multiple choice question filtering. arXiv preprint arXiv:2010.09598.
- Papineni et al. (2002) Kishore Papineni, Salim Roukos, Todd Ward, and Wei-Jing Zhu. 2002. Bleu: a method for automatic evaluation of machine translation. In Proceedings of the 40th Annual Meeting of the Association for Computational Linguistics, pages 311–318, Philadelphia, Pennsylvania, USA. Association for Computational Linguistics.
- Qi et al. (2020) Peng Qi, Yuhao Zhang, Yuhui Zhang, Jason Bolton, and Christopher D. Manning. 2020. Stanza: A python natural language processing toolkit for many human languages. In Proceedings of the 58th Annual Meeting of the Association for Computational Linguistics: System Demonstrations, pages 101–108, Online. Association for Computational Linguistics.
- Qiu et al. (2020) Zhaopeng Qiu, Xian Wu, and Wei Fan. 2020. Automatic distractor generation for multiple choice questions in standard tests. In Proceedings of the 28th International Conference on Computational Linguistics, pages 2096–2106, Barcelona, Spain (Online). International Committee on Computational Linguistics.
- Radford et al. (2018) Alec Radford, Karthik Narasimhan, Tim Salimans, and Ilya Sutskever. 2018. Improving language understanding by generative pre-training. preprint.
- Rodriguez (2005) Michael C Rodriguez. 2005. Three options are optimal for multiple-choice items: A meta-analysis of 80 years of research. Educational measurement: issues and practice, 24(2):3–13.
- Rosenthal (1996) James A Rosenthal. 1996. Qualitative descriptors of strength of association and effect size. Journal of social service Research, 21(4):37–59.
- Stasaski and Hearst (2017) Katherine Stasaski and Marti A. Hearst. 2017. Multiple choice question generation utilizing an ontology. In Proceedings of the 12th Workshop on Innovative Use of NLP for Building Educational Applications, pages 303–312, Copenhagen, Denmark. Association for Computational Linguistics.
- Vaswani et al. (2017) Ashish Vaswani, Noam Shazeer, Niki Parmar, Jakob Uszkoreit, Llion Jones, Aidan N Gomez, Łukasz Kaiser, and Illia Polosukhin. 2017. Attention is all you need. In Proceedings of the 31st International Conference on Neural Information Processing Systems, pages 6000–6010.
- Vedantam et al. (2015) Ramakrishna Vedantam, C Lawrence Zitnick, and Devi Parikh. 2015. Cider: Consensus-based image description evaluation. In Proceedings of the IEEE conference on computer vision and pattern recognition, pages 4566–4575.
- Wang and Cho (2019) Alex Wang and Kyunghyun Cho. 2019. BERT has a mouth, and it must speak: BERT as a Markov random field language model. In Proceedings of the Workshop on Methods for Optimizing and Evaluating Neural Language Generation, pages 30–36, Minneapolis, Minnesota. Association for Computational Linguistics.
- Welbl et al. (2017) Johannes Welbl, Nelson F. Liu, and Matt Gardner. 2017. Crowdsourcing multiple choice science questions. In Proceedings of the 3rd Workshop on Noisy User-generated Text, pages 94–106, Copenhagen, Denmark. Association for Computational Linguistics.
- Wolf et al. (2020) Thomas Wolf, Lysandre Debut, Victor Sanh, Julien Chaumond, Clement Delangue, Anthony Moi, Pierric Cistac, Tim Rault, Remi Louf, Morgan Funtowicz, Joe Davison, Sam Shleifer, Patrick von Platen, Clara Ma, Yacine Jernite, Julien Plu, Canwen Xu, Teven Le Scao, Sylvain Gugger, Mariama Drame, Quentin Lhoest, and Alexander Rush. 2020. Transformers: State-of-the-art natural language processing. In Proceedings of the 2020 Conference on Empirical Methods in Natural Language Processing: System Demonstrations, pages 38–45, Online. Association for Computational Linguistics.
- Zhou et al. (2020) Xiaorui Zhou, Senlin Luo, and Yunfang Wu. 2020. Co-attention hierarchical network: Generating coherent long distractors for reading comprehension. In Proceedings of the AAAI Conference on Artificial Intelligence, volume 34, pages 9725–9732.
Appendix A SweQUAD-MC data collection details
We have used publicly available texts from the websites of Swedish government agencies. The exact list of URLs is provided in the GitHub repository associated with the paper. The exact instructions given to students recruited to collect SweQUAD-MC dataset (and their translation to English) are presented in Figure 6. In addition to the given instructions, the students were also given the opportunity to slightly reformulate the distractors found in the text in order to align the syntactic structure with that of the key.
Appendix B Quantitative metrics
In addition to the metrics 1–10 presented in Section 6.1, we have also looked at the following ones (MCQ% means “Percentage of MCQ” and DIS means “generated distractor(s)”)
-
11.
MCQ% with at least 1 DIS being capitalized differently from the key
-
12.
MCQ% with at least 1 DIS being a distractor from training data.
-
13.
MCQ% with at least 1 DIS is in any base text from training data.
-
14.
MCQ% with at least 1 DIS appearing in at least 1 base text from training data, but not in their own base text.
-
15.
MCQ% with all distractors appearing in the base text.
-
16.
MCQ% with all distractors appearing in at least 1 base text from training data.
-
17.
MCQ% with all DIS being distractors from training data.
The rationale behind metric 11 was that capitalized answers are named entities and thus one would like distractors also to be named entities. However, it does not always hold. For instance, consider the stem “Who gets an e-mail with a confirmation of a successful submission of the application for the work permit?” and the key “you and your employer”. A distractor “Migration Agency” would suit the question perfectly, although capitalization is clearly different.
Metrics 12-17 were candidates to become overfitting indicators. However, metric 2 was excluded, since AnyDisFromTrainDis is more informative, given phrases used as distractors in training data can be repeated in other texts. Metrics 13-14 were excluded, since it’s unclear whether the higher or lower values are better. For instance, if a text from the training data and the given text are thematically similar, would copying a distractor from training data be considered overfitting? Metrics 15-17 were rejected as too strict, leaving the possibility of actually missing overfitting if only 2 of 3 distractors would meet the criteria.
Appendix C Model selection
We have trained both left-to-right and u-PMLM variants for 6 epochs (fixing a random seed for u-PMLM masking procedure to 42). The quantitative performance metrics on the development set for the top-3 models for each variant are presented in Table 5. The best u-PMLM model (i-14000) outperformed the best left-to-right model (i-18000) on most of the quantitative metrics.
| Metric | left-to-right | u-PMLM | ||||
|---|---|---|---|---|---|---|
| i-10000 | i-14000 | i-18000 | i-10000 | i-14000 | i-16000 | |
| e-3.02 | e-4.23 | e-5.43 | e-3.59 | e-5.02 | e-5.74 | |
| M1: DisRecall | 9.77% | 14.29% | 12.41% | 17.67% | 21.43% | 18.80% |
| M2: AnyDisRefMatch | 18.25% | 26.19% | 21.43% | 30.95% | 37.30% | 31.75% |
| M3: AnyDisInText | 64.29% | 69.84% | 73.81% | 68.25% | 72.22% | 73.81% |
| M4: KeyInDis | 0.79% | 1.59% | 3.17% | 2.38% | 5.56% | 5.56% |
| M5: AnySameDis | 34.13% | 27.78% | 19.84% | 9.52% | 10.32% | 11.90% |
| M6: AllSameDis | 3.17% | 1.59% | 0.79% | 1.59% | 0.79% | 0.79% |
| M7: AnyDisRep | 0.00% | 0.00% | 0.00% | 0.00% | 1.59% | 1.59% |
| M8: AnyDisEmpty | 0.00% | 0.00% | 0.00% | 0.00% | 0.00% | 0.00% |
| M9: AnyDisFromTrainDis | 5.56% | 5.56% | 6.35% | 5.56% | 2.38% | 2.38% |
| M10: MeanNCPTK | 0.33 | 0.38 | 0.39 | 0.41 | 0.41 | 0.41 |
| M11: MedianNCPTK | 0.18 | 0.19 | 0.21 | 0.27 | 0.26 | 0.27 |
| M12: ModeNCPTK | 1.0 | 1.0 | 1.0 | 1.0 | 1.0 | 1.0 |
| (13.3%) | (18.8%) | (17.6%) | (18.1%) | (20.3%) | (19.6%) | |
| Metric | i-10000, e-3.59 | i-14000, e-5.02 | i-16000, e-5.74 | ||||||
|---|---|---|---|---|---|---|---|---|---|
| SF | LF | RND | SF | LF | RND | SF | LF | RND | |
| M1 | 15.8% | 13.9% | 15.8% | 20.7% | 14.7% | 19.9% | 19.9% | 15.0% | 17.7% |
| M2 | 25.4% | 25.4% | 29.4% | 36.5% | 27.8% | 34.1% | 34.1% | 27.0% | 30.1% |
| M3 | 64.3% | 63.5% | 65.9% | 73.0% | 66.7% | 69.8% | 72.2% | 66.7% | 70.6% |
| M4 | 2.4% | 2.4% | 3.2% | 4.0% | 4.8% | 5.6% | 4.8% | 5.6% | 4.8% |
| M5 | 7.9% | 11.1% | 7.9% | 10.3% | 9.5% | 10.3% | 10.3% | 8.7% | 10.3% |
| M6 | 1.6% | 1.6% | 1.6% | 0.8% | 0.8% | 0.8% | 0.8% | 0.8% | 0.8% |
| M7 | 0.0% | 1.6% | 0.0% | 0.0% | 1.6% | 1.6% | 0.8% | 0.8% | 3.2% |
| M8 | 0.0% | 0.0% | 0.0% | 0.0% | 0.0% | 0.0% | 0.0% | 0.0% | 0.0% |
| M9 | 5.6% | 4.8% | 6.3% | 4.8% | 5.6% | 4.0% | 4.0% | 4.0% | 3.2% |
| M10 | 0.41 | 0.41 | 0.41 | 0.41 | 0.41 | 0.41 | 0.41 | 0.41 | 0.41 |
| M11 | 0.24 | 0.22 | 0.25 | 0.26 | 0.21 | 0.22 | 0.29 | 0.22 | 0.22 |
| M12 | 1.0 | 1.0 | 1.0 | 1.0 | 1.0 | 1.0 | 1.0 | 1.0 | 1.0 |
| (18%) | (17%) | (19%) | (20%) | (18%) | (20%) | (19%) | (18%) | (19%) | |
The next experiment concerned the order in which distractors are generated, which we tested only for the best u-PMLM model. We tried generating shortest distractors first (SF), longest first (LF) or in a random order with a fixed seed of 42 (RND). The results of the experiment are presented in Table 6. Evidently, models with SF-generation consistently outperform ones with LF-generation. SF-generation also performs on-par or better than RND-generation. However, fixing a seed is not a generalizable solution, which is why we opted for SF-generation.
Appendix D Human evaluation details
D.1 Student’s perspective
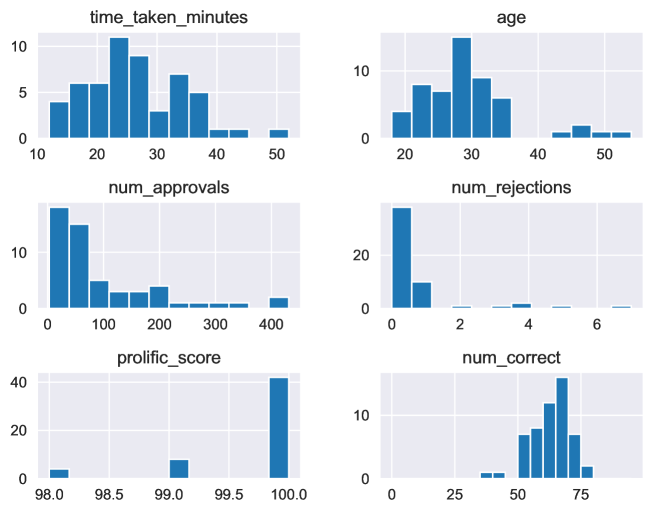
Evaluation from the student’s perspective has been conducted on the Prolific platform777https://www.prolific.co/. We used Prolific’s pre-screening feature and required each subject to have Swedish as the first language and hold at least a high school diploma (A-levels). Descriptive statistics about the recruited sample of subjects is presented in Figure 7. The exact guidelines given to the subjects (and their translation to English) are presented in Figure 8. MCQs were presented in a random order, but the order of options for each MCQs was the same for each subject.
D.1.1 Check of the t-test assumptions
We used one sample t-test for conducting our analysis and thus the following assumptions were checked for.
-
1.
The variable under study should be either an interval or ratio variable. Our variable, the number of correctly answered MCQs, is clearly on a ratio scale.
-
2.
The observations in the sample should be independent. Subjects have performed the task independently of each other through a Prolific platform, hence the observations are independent.
-
3.
The variable under study should be approximately normally distributed. The distribution of the number of correctly answered MCQs is presented in Figure 7 (the plot in the last row and the last column with the title “num_correct”). The distribution is indeed approximately normal.
-
4.
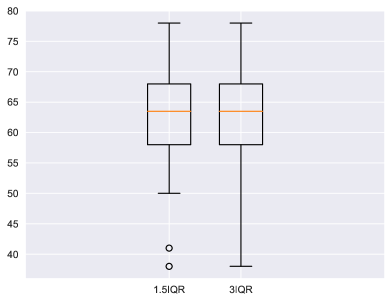
The variable under study should have no extreme outliers. Outliers are typically defined in terms of the interquartile range (IQR), which equals to Q3 - Q1. The datapoints outside 1.5IQR are deemed mild outliers, whereas those outside 3IQR are considered extreme outliers. Boxplots for our data with whiskers within both 1.5IQR and 3IQR are presented in Figure 9. Two datapoints can be considered mild outliers, but no extreme outliers are present, which means this assumption for the one sample t-test is not violated.
D.2 Teacher’s perspective
D.2.1 Instructions
The exact guidelines given to the teachers and their translation to English, are presented in Figure 10.
D.2.2 Inter-annotator agreement
To evaluate the inter-annotator agreement (IAA) between the teachers, we have reformulated the problem into a ranking problem, where all accepted distractors were given the rank of 1 and those rejected - the rank of 2. IAA was then estimated using Goodman-Kruskal’s Goodman and Kruskal (1979), specifically its multirater version proposed by Kalpakchi and Boye (2021). The total number of concordant and discordant pairs were summed for each pair of teachers for each MCQ. The resulting equals to 0.85, indicating a very large agreement on the scale proposed by Rosenthal (1996).
Appendix E Details on surveying related work
To get a comprehensive overview of methods for generating distractors for MCQs, we employed a two-step process. The first step was to issue queries “distractor generation” and “multiple choice question generation” to ACL Anthology and Google Scholar. The result was 20 articles from ACL Anthology and 4 additional ones from Google Scholar. The second step was to select relevant references from the “Related work” sections of these articles. This resulted into 15 additional articles. Out of found 39 articles, 11 were filtered out (8 focused only on generating questions, 1 relied mostly on expert knowledge, 1 on the auxiliary relation extraction task and 1 was a demo paper), leaving 28 articles in total. Only 2 of these 28 papers worked with a language other than English (Chinese and Basque).
Appendix F Generated samples
A number of generated distractors along with the respective stems and keys from the dataset are presented in Figures 11, 12, 13, 14, 15. The questions are sampled based on the entropy of student’s answers using the same 5 buckets as in sampling for teachers’ evaluation. Recall that distractors are said to be low frequency (LF-DIS) if they were chosen by less than 5% of students. Hence, a red cross in the column “F-DIS ” entails that a given distractor is in fact an LF-DIS.
The MCQ in sample 1 has an entropy of 0, meaning all students have selected the same option, which in this case was the key. In this case, two of three distractors were accepted by the majority of teachers, although all of them were LF-DIS. This is a good example of an MCQ with plausible distractors, but where the stem is too easy.
The MCQ in sample 2 presents an interesting case, when the distractor contains an obvious grammatical error (comma before the first word in the distractor 3). While the distractor was rightfully rejected by the majority of teachers, it was still selected by more than 5% of students.
The MCQ in sample 3 is a good example of longer distractors. In this case, two distractors were accepted by teachers and two were selected by more than 5% of students. However, interestingly these sets are disjoint, meaning that all three distractors could potentially be useful. Another more general observation, requiring future research, is that our model seems to struggle more when generating longer distractors in general, resulting in non-finished sentences or repetitions of words.
The MCQ in sample 4 is somewhat opposite to sample 3, since one distractor that was accepted by the teachers turned out to be an LF-DIS. This either means that the stem was too easy or that none of the distractors were potentially useful.
The MCQ in sample 5 is the one with a highest theoretically possible entropy between selecting the correct or a wrong option. Note that it might still happen that some of the distractors is LF-DIS, since the entropy is calculated not between all four options, but only between the key and the distractors as a group.