What a million Indian farmers say?: A crowdsourcing-based method for pest surveillance
Abstract.
Many different technologies are used to detect pests in the crops, such as manual sampling, sensors, and radar. However, these methods have scalability issues as they fail to cover large areas, are uneconomical and complex. This paper proposes a crowdsourced based method utilising the real-time farmer queries gathered over telephones for pest surveillance. We developed data-driven strategies by aggregating and analyzing historical data to find patterns and get future insights into pest occurrence. We showed that it can be an accurate and economical method for pest surveillance capable of enveloping a large area with high spatio-temporal granularity. Forecasting the pest population will help farmers in making informed decisions at the right time. This will also help the government and policymakers to make the necessary preparations as and when required and may also ensure food security.
1. Introduction
Agriculture accounts for 20.19% of India’s GDP (Ind, [n.d.]b), and on average, it employs over 50% of the population as per Indian economic survey (Ind, [n.d.]a). Over the past three decades, India achieved remarkable growth in agriculture production by expanding agricultural land, usage of high-yielding varieties of crops, fertilizers, and pesticides. However, increasing production through the expansion of farming areas is limited. Besides, production is restrained by several other factors such as limited availability of irrigation water, erratic weather patterns, lowering of groundwater levels, decreasing fertile land (availability per capita), and potential damage to crops due to pests.
Pests have been responsible for extensive crop damage in countless ways affecting overall production. Irrespective of the crop, pest attacks have been found in roots, stalks, bark, stems, leaves, buds, flowers, and fruits of plants (Atwal and Dhaliwal, 2015). According to the global burden (Finegold et al., 2019) of crop loss, pests and diseases cause about 20-40% loss in agriculture. In India, pests cause an annual loss of about US $42.66 million in agriculture (Sushil, 2016), implying pest infestation is a serious problem. Although this problem persists for a long time, our efforts to control and manage the damage have not been entirely resolved. Understanding pest population dynamics is an effective step towards pest management that can reduce harmful pesticides. However, monitoring pests population is complex as their population fluctuates with time, crop, location, and season. Therefore, a precise understanding of population dynamics is a challenging task.
| Season | Sector | Category | Crop | Query Type | Query Text |
|---|---|---|---|---|---|
| RABI | AGRICULTURE | Pulses | Black Gram (urd bean) | Plant Protection | pod borer in black gram |
| KCC Ans | State Name | District Name | Block Name | Created On | |
| recommended for spray quinalphos 2ml /liter | TAMILNADU | TIRUCHIRAPPALLI | PULLAMBADI | 2015-03-14 15:35:05.087 | |
Traditionally, pest management practises include usage of pesticides such as fungicides, herbicides, and insecticides. However, these are toxic to human health and are responsible for contaminating the agriculture ecosystem (Bilal et al., 2019). Over the years, researchers have employed different sensors and IOT based methods for pest detection and monitoring. Some of these methods include usage of acoustic sensors, radars, LiDAR (Dwivedi et al., 2020), cameras(Türkoğlu and Hanbay, 2019), infrared sensors, etc (Saranya et al., 2019). However, these methods lack in scalability due to low area coverage by sensors and are also expensive to deploy. Satellite imagery couple with machine learning techniques has also been used for pest detection (Yuan et al., 2014). Another approach includes pest forecasting based on the weather and topological information. Wu et al. (Wu et al., 2008) used multifactor spatial interpolation model which uses weather information as one of the data source and used geography information system (GIS) for forecasting. Hooker et al. (Hooker et al., 2002) used multiple linear regression on rainfall, humidity and temperature data to predict pest in wheat plants. However, these studies focus on single plant or pest. There is a need for economical and scalable method for collecting high frequency and high resolution data.
In this work, we have proposed a crowdsourced data collection and pest attack prediction methodology. Crowdsourced data has been shown to be powerful tool in predicting infectious disease outbreak such as influenza and middle east respiratory syndrome (Seo and Shin, 2017) and dengue fever (Husnayain et al., 2019). It has the capability of capturing high frequency information keeping the cost low and provides wide spatial extent and high resolution. We have examined crowdsourced data recorded from farmer call centers, popularly know as ‘Kisan call centers’ (KCC) (Kis, [n.d.]) managed by Ministry of Agriculture, Government of India, which is available online at (Ope, [n.d.]). KCCs have been established throughout India to inform and advise farmers on the queries posed by them and proved to be efficient as 61.5% of farmers depend on KCC for information support on various agricultural issues (Parihar et al., 2010). They have been a successful model to establish direct communication between experts/semi-experts and the farmers. This big data consists of agricultural queries and can be used for investigating various problems faced by farmers (Nguyen et al., [n.d.]). Viswanath et al. (Viswanath et al., 2018) analyzed the KCC datasets to find the peak query hours. Mohapatra et al. (Mohapatra and Upadhyay, 2018) studied KCC data to answer most common queries by generating FAQ, Jain et al. (Jain et al., 2019) have used KCC data to develop a chat bot for farmers. However, to the best of our knowledge no such work has been done in the field of pest prediction using KCC data. Our method is a data-driven approach to gather pest population information, which is accurate, economical, and is capable of covering large area with block-level granularity.
We used time-varying agricultural queries from different districts of India to study pest population dynamics. Interestingly, the spatio-temporal mapping of the normalized query features mimicked the events panning out in the real world accurately as examined by contemporary news articles and reports. Further, we developed machine learning models to forecast the pest population across India. This forecasting model will not only help in knowing pest arrival time but also identify the period of occurrence. This could help to track and predict pest severity and provide novel signals to the government or other agencies engaged in this area to preempt any outbreak.
2. Methodology
2.1. Data
Our dataset consists of KCC queries for 2015–2020 including 10,981,793 queries from 31 states and 553 districts collected from the Open Government Data (OGD) website (Ope, [n.d.]). It consists of season, crop category, query type, crop, the question asked by the farmer, and answer provided by the KCC executive, location information, and time of query raised. The query season reflects the harvest of the crop, Rabi, Kharif, or Zaid crops. Category field contains information about the query category, such as pulses, vegetables, etc. The location is divided into three fields: state name, district name, and block name. An example of the data is shown in the Table 1.
2.2. Labelling of pest queries
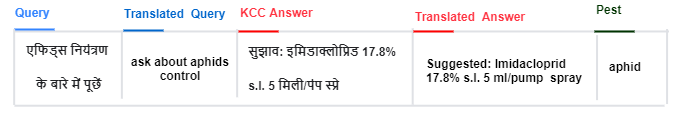
KCC data is not systematically organized and maintained leading to many challenges, such as missing information, spelling mistakes, and usage of code-mixed multiple languages. We performed data cleaning by discarding queries that have incomplete details, such as missing state names, district names, and creation dates. Further, we translated the queries to English using Google Translate API and spell corrected using TextBlob (Tex, [n.d.]) python library for both question and KCC answer. An example has been shown in Figure 1.

2.3. Pest Seasonality and Forecasting
In order to extract pest related queries, we generated a list of possible names for each pest by considering one character error and kept queries for which pest name is found either in question raised by a farmer or the answer given by the KCC executive. The flow chart labelling the pest queries is shown in Figure 2. Following this procedure, we are left with a dataset of size 867,337 for pest related queries which is 7.89% of total queries. Also, we aggregated our data by date, district, and pest to calculate the frequency of daily pest queries from a specific district. As the pest frequency depends on the agricultural land, the pest frequency from a district was normalized by gross cultivable area (ICR, [n.d.]) in the given district.
| Result | Aphid | Insect | Bug | Stemborer |
|---|---|---|---|---|
| Test Statistic | -5.0867 | -4.2921 | -23.014 | -3.217 |
| p-value | 0.000015 | 0.00045 | 0.000 | 0.019 |
| Log transformation | True | True | True | True |
| #Lags Used | 10 | 13 | 11 | 13 |
| Critical Value (1%) | -3.496 | -3.496 | -3.501 | -3.496 |
| Critical Value (5%) | -2.890 | -2.890 | -2.501 | -2896 |
| Critical Value (10%) | -2.582 | -2.582 | -2.583 | -2.582 |
| Constant | Aphid | Insect | Bug | Stemborer | |
| AR | p | 1 | 1 | 2 | 1 |
| d | 0 | 0 | 1 | 0 | |
| q | 1 | 2 | 0 | 1 | |
| SAR | P | 1 | 1 | 2 | 1 |
| D | 0 | 0 | 1 | 1 | |
| Q | 1 | 1 | 0 | 2 | |
| S | 7 | 12 | 11 | 8 | |
| AIC | 995.251 | 942.906 | 972.638 | 966.049 | |
In order to quantify seasonality of pest population, we computed temporal auto-correlation to a lagged version of query frequency using (Bradley, 1968). The auto-correlation vs. lag plot can be used to find seasonality in the pest attack. The periodicity of the peak shows the pattern after a period equal to the lag.
Seasonal Auto-regressive Integrated Moving Average (SARIMA) is a forecasting method for continuous-time series data with seasonal variation. We used the SARIMA model for forecasting pest occurrences. So, as a first step we checked for data stationary property using Dickey-Fuller (DF) test (Mushtaq, 2011) as given by . Here, yi is the variable of interest, i is the time index, and is the error term.
For pest frequency time series where DF tests failed (i.e., non-stationary), we further take its log transformation followed by an iterative n-order differencing as shown in equation 1 till the stationarity has been achieved. To confirm the stationarity, we also checked for the time dependence of the mean and standard deviation. (i.e., rolling mean and rolling standard deviation are constant). Test statistics of the DF test is shown in Table 2(a)
| (1) |
yt denotes the pest frequency at time , and denotes seasonal difference. In order to determine the optimal values of SARIMA model parameters, i.e., trend autoregression order (p), the trend moving average order (q), seasonal autoregressive order (P), and seasonal moving average order (Q), we performed a grid search. Table 2(b) shows the parameter combinations. Akaike information criterion (AIC) was used as a performance metric.
3. Results
3.1. Pest frequency analysis
We analyzed the five-year queries and found that the most significant number came from the agricultural sector at 79.42%, followed by horticulture at 18.81% and livestock, weather, and fishing below 1%. Among the different crops, cereals received the most queries with 20.9% followed by pulses: 5.53%, oil seeds: 4.82%, fiber crops: 3.61%, millets: 2.95% and rest with less than 2%.
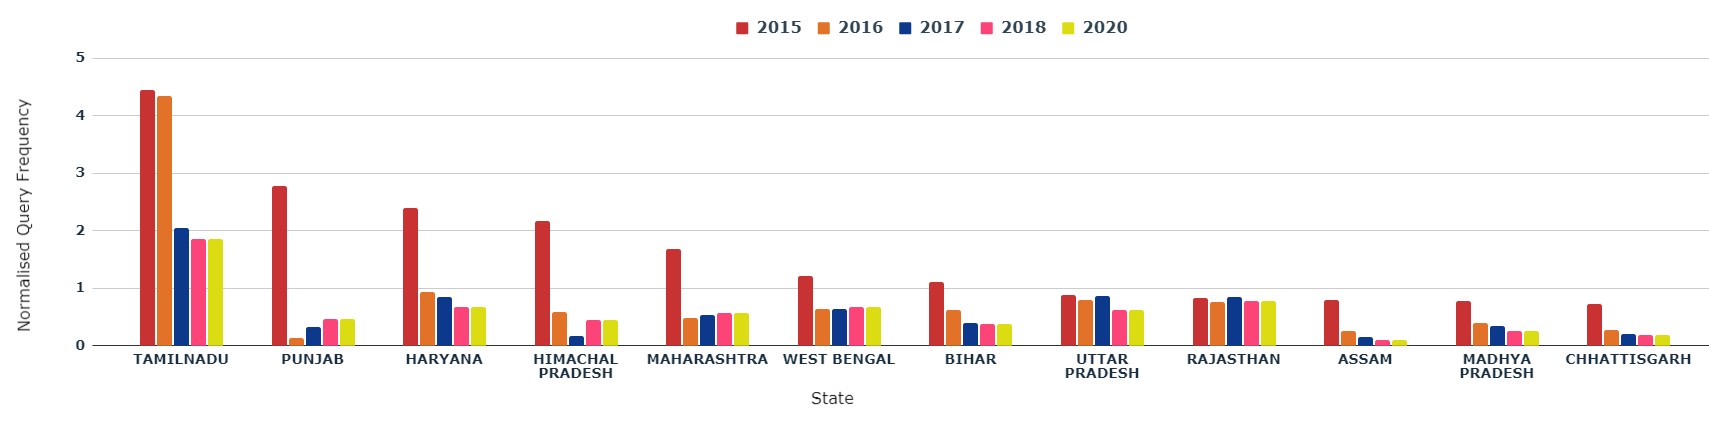
We further analyzed only pest-related queries for 264 varieties of crops and observed that the top queries were related to paddy (dhan) with 16.2% followed by cotton (kapas) 8.66%, brinjal 7.62%, sugarcane (noble cane) 4.45%, wheat 4.29% and rest below 3%. We observe that Tamil Nadu receives the highest number of normalized pest queries as shown in Figure 3.
3.2. Similarity with real time events
In order to determine the veracity of our methodology for extracting useful information from queries, we compared the major pest attack events reported in popular news and reports to the spatio-temporal pest attack hot spots observed in our data. To this end, we scraped news articles from two of the most popular national newspapers, The Times of India (ToI) (New, [n.d.]) and The Hindu (The, [n.d.]) along with other sources such as DownToEarth.
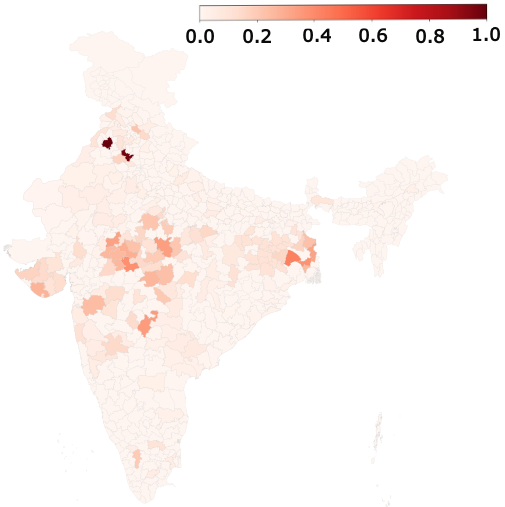
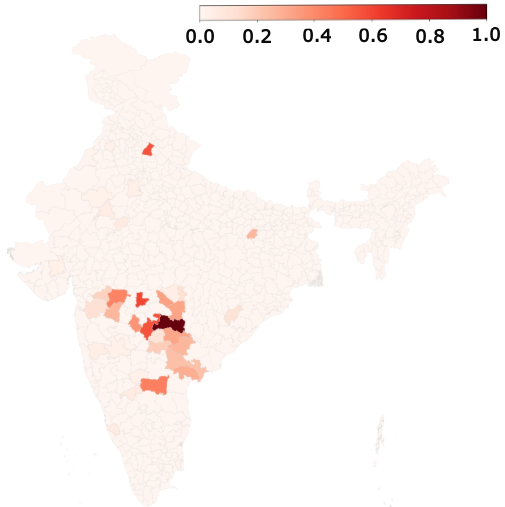
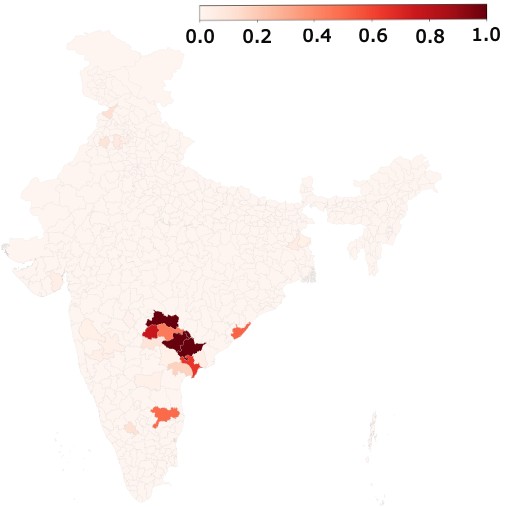
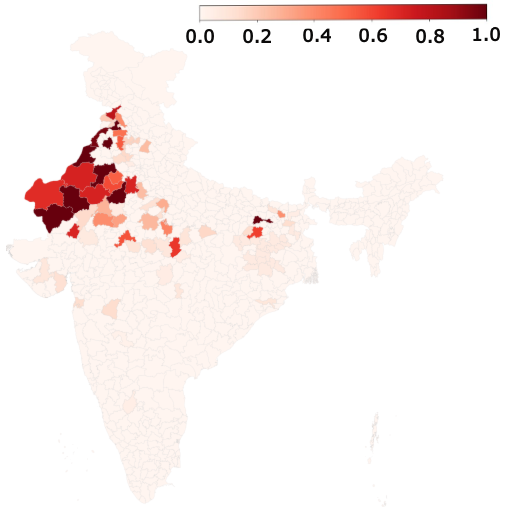
According to the report by DownToEarth (Pes, [n.d.]), whiteflies were responsible for immense crop loss during the year 2015-2016 in the states of Punjab and Haryana. We verified this report with our data by extracting whitefly queries for the year 2015-2016 as shown in Figure 4(a). It shows that the states of Himachal Pradesh, Punjab, and Haryana, on average received the maximum number of queries per unit cultivated area. This information was also reported by The Hindu on August 25, 2015 (Cot, [n.d.]), which was one month and 19 days later than the first query received in KCC. Similarly, our data display bollworm attack on Cotton (Kapas) during 2016 in the region of Andhra Pradesh and Maharashtra as shown in Figure 4(b) and the corresponding scenario was reported in (bol, [n.d.]). In 2018, maize was reported to be affected by the armyworm in the districts of Andhra Pradesh (Fal, [n.d.]), and as expected, KCC also receives a large volume of maize related queries corresponding to armyworm from the regions of Andhra Pradesh shown in Figure 4(c). It was first reported in the hindu (Arm, [n.d.]) on October 08, 2018 which was 1 month 20 days later than the first query started appearing in the KCC. The much-publicized locust attack of 2020 also reported in Wikipedia (Loc, [n.d.]) in the northern part of India was observed in the queries related to locust attacks in regions of Rajasthan, Punjab, Himachal Pradesh as shown in Figure 4(d). It was also reported earlier in the KCC dataset. These results show crowdsourced data from KCC is helpful to analyze pest dynamics as it may be able to detect pest outbreaks earlier than reported in popular news papers.
3.3. Pest Seasonality and Forecasting
3.3.1. Pest Seasonality
We computed auto-correlation vs. lag plots of different pests with a minimum lag of a day. The auto-correlation plots of whitefly, bug, aphid and stemborer are shown in Figure 5.
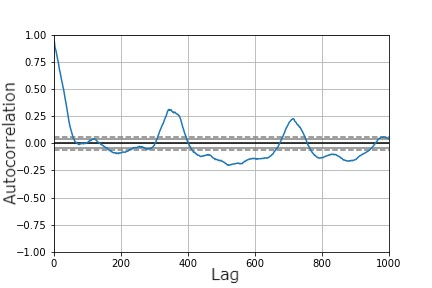
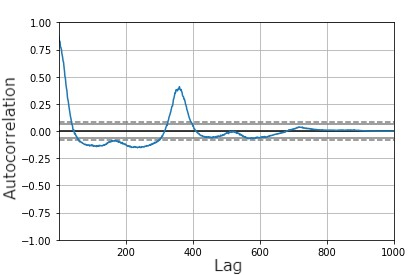

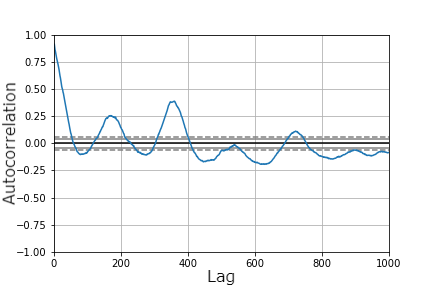
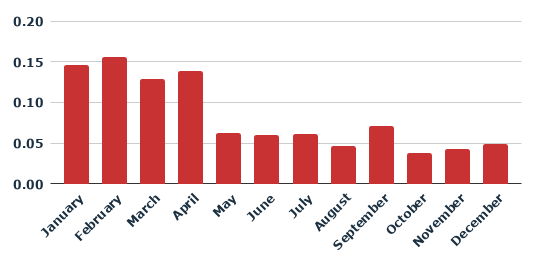
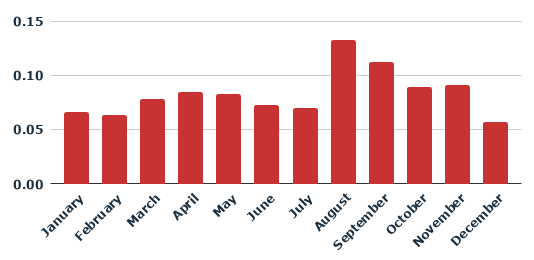
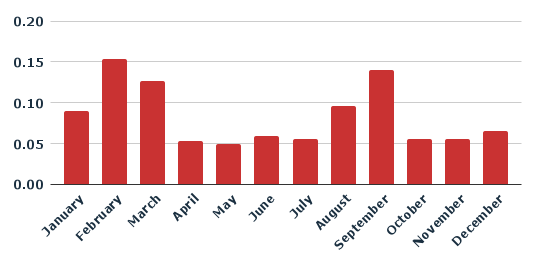
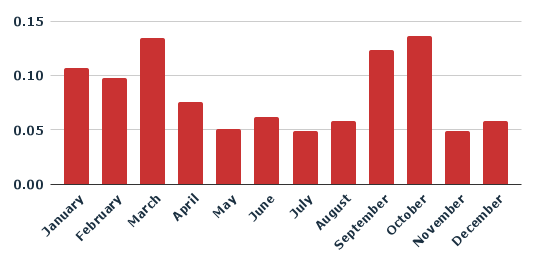
We observed peak in a time period of six month or an year. For whitefly, bug, aphid and stemborer over different months over five years is shown in Figure 6. Figure 6(a) and 6(b) shows white-fly and bug display yearly seasonality, where whitefly is observed during the months of January to April and bugs in August and September. Figure 6(c) and 6(d) show aphid and stem borers reflect half-yearly seasonality and majorly found in the months of February, March and August, September.
3.3.2. Forecasting
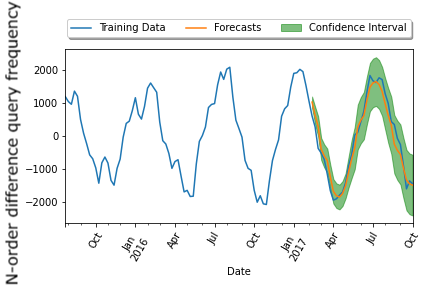
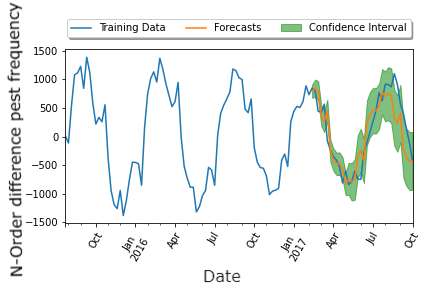
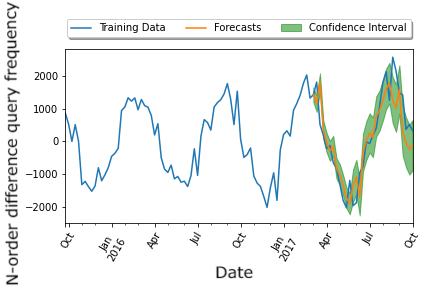
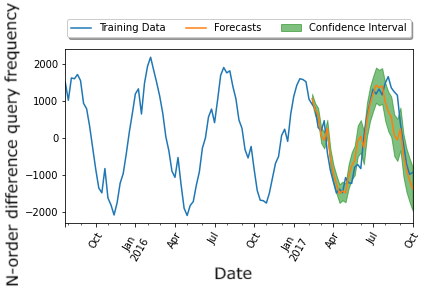
We split our time series pest data into 70% training and 30% testing. We performed a DF test on the training data, and the results for aphid and termite are shown in Table 2(a). In the next step, we used grid search across the autoregressive (AR) and seasonally autoregressive (SAR) hyperparameters on training data to select best fitting parameters based on the lowest AIC value (as shown in Table 2(b)). After setting the hyperparameters, a model is built by fitting the training data. Further, we used the trained model for prediction on the test data. Root mean square error, mean standard error and confidence interval corresponding to forecasting results of aphid, insect, bug, and stemborer are shown in Table 3
| Pest | Mean Square Error | Mean Standard Error | Confidence Interval |
|---|---|---|---|
| Aphid | 284.176 | 317.23 | [435.12, -808.415] |
| Insect | 313.369 | 172.860 | [390.48, -287.118] |
| Bug | 313.56 | 172.35 | [302.56, -489.51] |
| Stemborer | 484.50 | 204.527 | [353.569, -448.166] |
4. Conclusion and Future work
This study has drawn attention to the fact that crowdsourced data can be considered a way to study pest population dynamics as it mimics real-world events. Using this data, we investigated pest seasonality and found that their populations differ over time and place. We used time-series pest data to produce a reliable forecast, encouraging practical application. Our method can be used easily and provide an alternative approach to study pest attacks.In future, we intend to quantitatively validate our approach by possibly detecting all pest outbreak stories in the top news papers in a comprehensive manner.
Early predictions of pest attacks can help us find effective ways to protect crops and achieve better harvests. This helps in knowing pest attack arrival time and identifies the period of occurrence. Thus forecasting the pest population will help farmers take appropriate action on a timely basis. It will also help farmers decide the amount of pesticides to be used, and it is desirable to plan appropriate control measures with maximum efficiency.
References
- (1)
- Arm ([n.d.]) [n.d.]. Armyworms march on… - IN SCHOOL - The Hindu. https://www.thehindu.com/todays-paper/tp-in-school/armyworms-march-on/article25152091.ece. (Accessed on 07/29/2021).
- Cot ([n.d.]) [n.d.]. Cotton crop in Punjab comes under whitefly attack - OTHER STATES - The Hindu. https://www.thehindu.com/todays-paper/tp-national/tp-otherstates/cotton-crop-in-punjab-comes-under-whitefly-attack/article7576620.ece. (Accessed on 07/29/2021).
- Fal ([n.d.]) [n.d.]. Fall Armyworm attack: The damage done. https://www.downtoearth.org.in/coverage/agriculture/fall-armyworm-attack-the-damage-done-63445. (Accessed on 04/14/2021).
- The ([n.d.]) [n.d.]. The Hindu: Breaking News, India News, Sports News and Live Updates. https://www.thehindu.com/. (Accessed on 07/29/2021).
- ICR ([n.d.]) [n.d.]. ICRISAT-District Level Data. http://data.icrisat.org/dld/src/visualization.html. (Accessed on 04/18/2021).
- Ind ([n.d.]a) [n.d.]a. India economic survey 2018: Farmers gain as agriculture mechanisation speeds up, but more R&D needed - The Financial Express. https://www.financialexpress.com/budget/india-economic-survey-2018-for-farmers-agriculture-gdp-msp/1034266/. (Accessed on 07/22/2021).
- Ind ([n.d.]b) [n.d.]b. India GDP sector-wise 2020 - StatisticsTimes.com. https://statisticstimes.com/economy/country/india-gdp-sectorwise.php. (Accessed on 07/22/2021).
- bol ([n.d.]) [n.d.]. India: Pests love a warmer world — PreventionWeb.net. https://www.preventionweb.net/news/view/64708. (Accessed on 04/14/2021).
- Kis ([n.d.]) [n.d.]. Kisan Call center. https://dackkms.gov.in/account/login.aspx. (Accessed on 02/20/2021).
- Loc ([n.d.]) [n.d.]. Locusts’ attack in western Rajasthan leaves farmers high and dry, ruin lakhs of hectares of crops - India News. https://www.indiatoday.in/india/story/locusts-attack-in-western-rajasthan-leaves-farmers-high-and-dry-ruin-lakhs-of-hectares-of-crops-1638357-2020-01-20. (Accessed on 02/24/2021).
- New ([n.d.]) [n.d.]. News - Latest News, Breaking News, Bollywood, Sports, Business and Political News — Times of India. https://timesofindia.indiatimes.com/. (Accessed on 07/29/2021).
- Ope ([n.d.]) [n.d.]. Open Government Data (OGD) Platform India. https://data.gov.in/. (Accessed on 02/20/2021).
- Pes ([n.d.]) [n.d.]. Pest attacks on rise across India, yet no discussion on spurious pesticides. https://www.downtoearth.org.in/news/agriculture/pest-attacks-on-rise-across-india-yet-no-discussion-on-spurious-pesticides-59043. (Accessed on 04/08/2021).
- Tex ([n.d.]) [n.d.]. TextBlob: Simplified Text Processing — TextBlob 0.16.0 documentation. https://textblob.readthedocs.io/en/dev/. (Accessed on 05/28/2021).
- Atwal and Dhaliwal (2015) AS Atwal and GS Dhaliwal. 2015. Agricultural pests of South Asia and their management. Kalyani Publishers.
- Bilal et al. (2019) Muhammad Bilal, Hafiz M.N. Iqbal, and Damiá Barceló. 2019. Persistence of pesticides-based contaminants in the environment and their effective degradation using laccase-assisted biocatalytic systems. Science of The Total Environment 695 (2019), 133896. https://doi.org/10.1016/j.scitotenv.2019.133896
- Bradley (1968) James V Bradley. 1968. Distribution-free statistical tests. (1968).
- Dwivedi et al. (2020) Mahaveer Dwivedi, Malik Hashmat Shadab, and VR Santosh. 2020. Insect pest detection, migration and monitoring using radar and LiDAR systems. Innovative Pest Management Approaches for the 21st Century (2020), 61–76.
- Finegold et al. (2019) Cambria Finegold, Jeffrey Ried, Katherine Denby, and Sarah Gurr. 2019. Global burden of crop loss. Gates Open Res 3 (2019).
- Hooker et al. (2002) DC Hooker, AW Schaafsma, and L Tamburic-Ilincic. 2002. Using weather variables pre-and post-heading to predict deoxynivalenol content in winter wheat. Plant disease 86, 6 (2002), 611–619.
- Husnayain et al. (2019) Atina Husnayain, Anis Fuad, and Lutfan Lazuardi. 2019. Correlation between Google Trends on dengue fever and national surveillance report in Indonesia. Global health action 12, 1 (2019), 1552652.
- Jain et al. (2019) Naman Jain, Pranjali Jain, Pratik Kayal, Jayakrishna Sahit, Soham Pachpande, Jayesh Choudhari, et al. 2019. AgriBot: agriculture-specific question answer system. (2019).
- Mohapatra and Upadhyay (2018) Sandeep Kumar Mohapatra and Anamika Upadhyay. 2018. Using TF-IDF on Kisan call centre dataset for obtaining query answers. In 2018 International Conference on Communication, Computing and Internet of Things (IC3IoT). IEEE, 479–482.
- Mushtaq (2011) Rizwan Mushtaq. 2011. Augmented dickey fuller test. (2011).
- Nguyen et al. ([n.d.]) Van-Quyet Nguyen, Giang-Truong Nguyen, Sinh-Ngoc Nguyen, Jintae Choi, and Kyungbaek Kim. [n.d.]. Big Data Analytics and Visualization Techniques: A Case Study from Agriculture Domain. ([n. d.]).
- Parihar et al. (2010) Subhash Singh Parihar, Mishra Bharat, DP Rai, et al. 2010. Sustainable models of Information Technology for agriculture and rural development. Indian Research Journal of Extension Education 10, 1 (2010), 20–23.
- Saranya et al. (2019) K Saranya, P Uva Dharini, P Uva Darshni, and S Monisha. 2019. IoT Based Pest Controlling System for Smart Agriculture. In 2019 International Conference on Communication and Electronics Systems (ICCES). IEEE, 1548–1552.
- Seo and Shin (2017) Dong-Woo Seo and Soo-Yong Shin. 2017. Methods using social media and search queries to predict infectious disease outbreaks. Healthcare informatics research 23, 4 (2017), 343–348.
- Sushil (2016) SN Sushil. 2016. Emerging issues of plant protection in India. Ecological Perspectives (2016), 529.
- Türkoğlu and Hanbay (2019) Muammer Türkoğlu and Davut Hanbay. 2019. Plant disease and pest detection using deep learning-based features. Turkish Journal of Electrical Engineering & Computer Sciences 27, 3 (2019), 1636–1651.
- Viswanath et al. (2018) Vandanapu Kasi Viswanath, Chandu Gayathri Venu Madhuri, Chamarthi Raviteja, S Saravanan, and Manju Venugopalan. 2018. Hadoop and Natural Language Processing Based Analysis on Kisan Call Center (KCC) Data. In 2018 International Conference on Advances in Computing, Communications and Informatics (ICACCI). IEEE, 1142–1151.
- Wu et al. (2008) Xiaofang Wu, Changwei Wang, Zhiyong Xu, and Yueming Hu. 2008. Application of GIS technology in monitoring and warning system for crop diseases and insect pests. In Geoinformatics 2008 and Joint Conference on GIS and Built Environment: Monitoring and Assessment of Natural Resources and Environments, Vol. 7145. International Society for Optics and Photonics, 714516.
- Yuan et al. (2014) Lin Yuan, Jingcheng Zhang, Yeyin Shi, Chenwei Nie, Liguang Wei, and Jihua Wang. 2014. Damage mapping of powdery mildew in winter wheat with high-resolution satellite image. Remote sensing 6, 5 (2014), 3611–3623.