Mapping Vulnerable Populations with AI
Abstract.
Humanitarian actions require accurate information to efficiently delegate support operations. Such information can be maps of building footprints, building functions, and population densities. While the access to this information is comparably easy in industrialized countries thanks to reliable census data and national geo-data infrastructures, this is not the case for developing countries, where that data is often incomplete or outdated. Building maps derived from remote sensing images may partially remedy this challenge in such countries, but are not always accurate due to different landscape configurations and lack of validation data. Even when they exist, building footprint layers usually do not reveal more fine-grained building properties, such as the number of stories or the building’s function (e.g., office, residential, school, etc.). In this project we aim to automate building footprint and function mapping using heterogeneous data sources. In a first step, we intend to delineate buildings from satellite data, using deep learning models for semantic image segmentation. Building functions shall be retrieved by parsing social media data like for instance tweets, as well as ground-based imagery, to automatically identify different buildings functions and retrieve further information such as the number of building stories. Building maps augmented with those additional attributes make it possible to derive more accurate population density maps, needed to support the targeted provision of humanitarian aid.
1. Introduction
Population maps are important for humanitarian organizations to reach people in need and to allocate their resources efficiently (e.g., in disaster relief or vaccination campaigns). Obtaining up-to-date information about the population distribution is challenging for many countries of the global South, due to outdated censuses (sometimes by more than 10 years111https://unstats.un.org/unsd/demographic-social/census/censusdates) unable to keep up with population growth, migration and urbanization (Thomson et al., 2020). Moreover, even if censuses are held on a periodic basis, they typically do not provide any population distribution maps and are therefore of limited use, e.g. for disaster response planning within a city.
To provide automated estimates of population distribution, several works have used building maps as a proxy, e.g., (Weber et al., 2018). However, despite the efforts of humanitarian mapping projects (e.g., HOT-OSM222https://www.hotosm.org and Missing Maps333https://www.missingmaps.org), building maps are still missing or incomplete in (parts of) many developing countries. And even if maps exist, they often lack information about the usage of the buildings. Such information is, however, crucial for field interventions, as the expected number of people differs between, say, a residential building, a hospital and warehouse of the same size.
Projects like the Facebook population density maps (Tiecke et al., 2017) have applied computer vision methods to remote sensing imagery to automate the creation of building maps for entire countries. However, these maps neither delineate individual buildings (but rather patch-level predictions) nor contain information about usage, height, etc.
To complement remote sensing images, social media data also carry information about human use of space. Social media usage is widespread around the world and can provide insights about human settlements. For instance, recent works have studied Tweets as a source for demographic analysis, and advertisement data from Facebook as an information source about poverty (Fatehkia et al., 2020a).
Here we introduce a research project that aims at mapping populations in cities, exploiting synergies between remote sensing and social media. With an interdisciplinary team of experts from the humanitarian sector and academia, we are developing methods to combine these heterogeneous data sources and produce reliable building maps and population density estimates at a fine-grained level. Our objective is to deliver actionable information for personnel on the ground during and after conflicts, natural disasters and other events that require humanitarian actions.
2. Related Work
Population mapping by processing remote sensing imagery has been studied in several projects. The projects Global Human Settlement Layer (Pesaresi et al., 2013) and Facebook population density maps (Tiecke et al., 2017) detect built-up areas via patch-wise building classification to estimate population densities, respectively numbers. However, no further building attributes are estimated, such that the step from (approximate) building area to population numbers introduces a large margin of error.
Most recent methods proposed to extract urban land cover or buildings from remote sensing images (Hamaguchi and Hikosaka, 2018; Shi et al., 2020; Han et al., 2020a) use deep learning techniques trained on large datasets to obtain per-pixel labels building or no building. While one could, in principle, obtain population estimates (Han et al., 2020b), or even socioeconomic indicators (Tingzon et al., 2019), directly in that raster format, it is usually transformed into a vector data to simplify its further use in Geographic Information Systems. Some works obtain vector outlines in post-processing, by polygonizing raster predictions (Tasar et al., 2018), whereas others learn to produce vector outputs end-to-end (Marcos et al., 2018; Cheng et al., 2019), sometimes supported by specific shape priors for, e.g., rural buildings (Vargas-Muñoz et al., 2019).
Building use classification is also an active research topic. Different authors have been considering remote sensing data (Xie and Zhou, 2017) ground-based pictures (e.g., Google Street View) (Tracewski et al., 2017; Srivastava et al., 2020), and also hybrid approaches that fuse these two data sources (Srivastava et al., 2019; Workman et al., 2017). However, ground-based pictures are often unavailable, such that these fusion methods must be able to deal with missing data (Srivastava et al., 2019). Beyond image data, (Häberle et al., 2019) explores the use of geo-located tweet messages as input to distinguish coarse use classes (i.e., residential and commercial buildings). In a similar spirit, advertisement data from Facebook has been used to estimate wealth indices for clusters of households (Fatehkia et al., 2020a), but not at the building level.
Regarding building height, different approaches have been proposed using stereo imaging (Facciolo et al., 2017; Stucker and Schindler, 2020), Synthetic Aperture Radar (SAR) (Sun et al., 2017) or Light Detection and Ranging (LiDAR) (Wu et al., 2019). Height estimation using stereo image pairs or sets requires high resolution images, which may be prohibitively expensive at larger scales. Furthermore, the on-demand acquisition of such images can quickly become affected by weather conditions. To allow for fine-grained estimates at individual building level from SAR, high resolution and often multiple images of the same region are required (Sun et al., 2019). It has thus been proposed (Srivastava et al., 2017) to jointly estimate terrain elevation and land use from monocular, optical remote sensing imagery, with a multi-task framework. Generally, topographical variations tend to degrade the height estimation from satellite imagery, and the application in hilly or mountainous terrain remains an open problem. LiDAR with sufficiently small footprint (respectively, resolution) can at present only be captured from dedicated airborne platforms. It is not suitable for our applications due to the associated cost and logistic effort.
3. Proposed Methodology
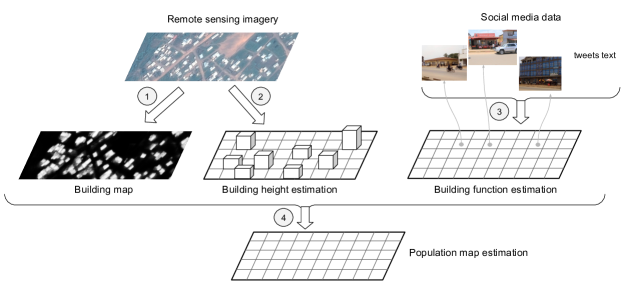
The goal of our project is to map populations and population densities with the help of satellite data and social media posts. Figure 1 shows the data sources and methodologies considered to obtain per-building estimates of inhabitants and thus population densities. The numbers highlight different methodological parts as follows:
-
(1)
In a first step, we generate high-resolution building maps with the help of deep convolutional neural networks (DNNs) such as U-Net (Ronneberger et al., 2015). Different data sources can be used to this end, including very high-resolution, commercial satellite imagery as well as elevation models. Besides providing a basis for planning in a more geometric sense, building footprints can serve as an initial approximation towards population density estimation. Oftentimes, reference data to train a model are noisy, such as incompleteness issues as in the case of our building footprints ground truth (see Fig. 2(b)). To compensate for this problem, we will use a weakly supervised method based on (Caye Daudt et al., 2019) to generate building maps. Some preliminary results are depicted in Figure 2.
-
(2)
In a second step, we intend to estimate the height of buildings for a more precise estimation of the number of inhabitants. As outlined above, monocular height estimation is challenging and an open research question. Yet, multiple methods have been proposed and we plan on investigating some that use optical imagery directly (Srivastava et al., 2017; Mou and Zhu, 2018; Carvalho et al., 2020), or a combination of optical and SAR data (Wegner et al., 2013).
-
(3)
As explained above, precise population counts not only depend on building footprints, but also on the function of buildings and neighborhoods. While such information may be challenging to retrieve with satellite-based Earth observation, it can be extracted more easily from street-level imagery (Srivastava et al., 2018, 2020) as well as social media content (Alam et al., 2018; Imran et al., 2020): building attributes, such as store fronts and hospital signs, can be automatically detected in ground-level imagery and provide direct indicators. Moreover, demographic indicators such as age groups and social indicators can also contribute valuable knowledge, and can be extracted from social media platforms (Fatehkia et al., 2020b; Fatehkia et al., 2020a). In this step we intend to train DNNs that classify building functions based on ground-level imagery, tweets, and place descriptions from these heterogeneous data sources.
-
(4)
Finally, all described intermediate products shall be combined to obtain more accurate and complete population maps. The hope is that this integrated product will combine the geometric precision of satellite-based Earth observation with the rich semantic and demographic detail of ground-level images and social media content. The fusion may be accomplished with another DNN that merges the heterogeneous inputs at the level of deep, latent features, e.g. using MCB (Fukui et al., 2016) or MUTAN (Ben-Younes et al., 2017), and is trained to spatially regress population density.
As a baseline, we will also investigate an approach that maps local population densities directly. Recent works on density estimation for agricultural (Rodriguez et al., 2021) and environmental (Bowler et al., 2019) applications have shown great potential to directly regress densities from satellite images; we will evaluate that strategy for population density mapping.
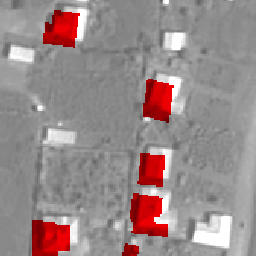
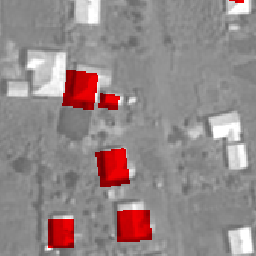
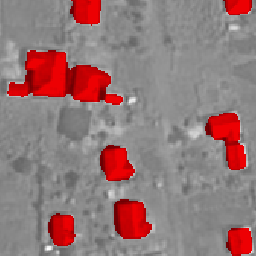
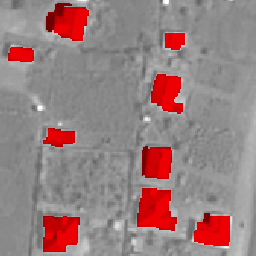
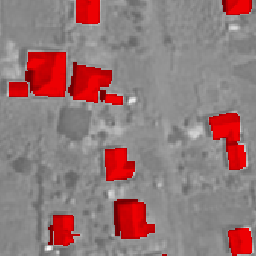
(a) Image
(b) Available reference data
(c) Supervised result
(d) Weakly supervised result (Caye Daudt et al., 2019)
(e) Post-processed result
We target four representative cities and their surroundings, for which data are available: Gumbo (East Juba, South Sudan), Mokolo (Cameroon), Bunia (DRC), Tal Afar (Iraq). We note that all data (building footprints, tweets, ground-level imagery, etc.) are in disaggregated and anonymized form, without information on tenants or owners (building data) or possibilities of identifying the original owner or uploader (social media data).
4. Expected Challenges
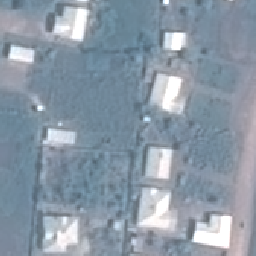
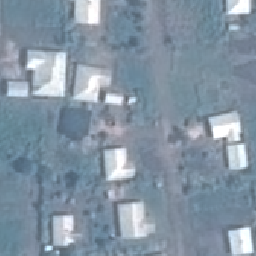
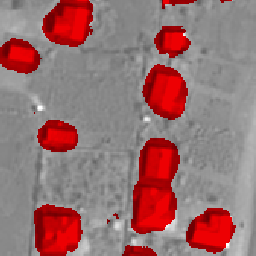
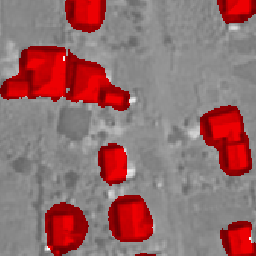
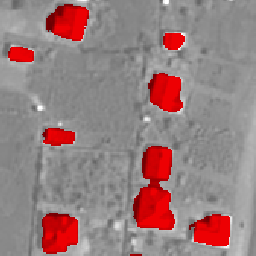
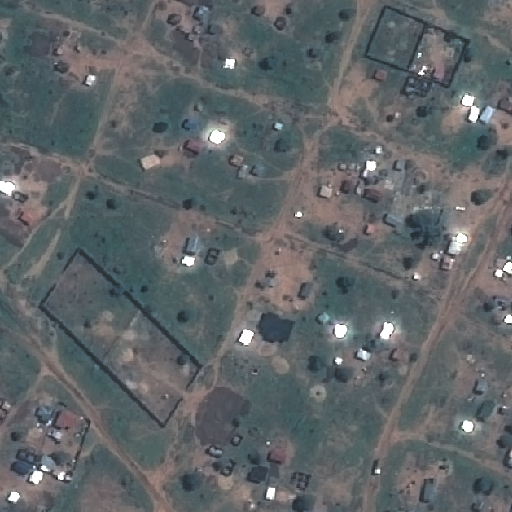
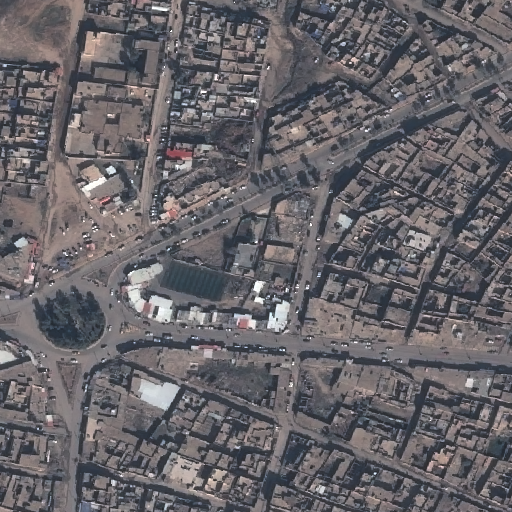
Large variations between these four cities in terms of environmental conditions and structural lay-out give rise to significant domain shifts, which pose a particular challenge. See Figure 3. To ensure general applicability of the developed approaches, domain adaptation across geographic regions will therefore play a central role. We anticipate that this may include semi-supervised fine-tuning and possibly also unsupervised domain adaptation based on aggregate feature statistics, to limit the required amount of training labels for a new target region to a practically tractable magnitude (Redko et al., 2019).
Furthermore, there is a high probability that the coverage of social media data may not be sufficient, leaving us with incomplete information for some buildings. One possible means of compensation to this end may be to infer the building functions for some classes that are sufficiently distinguishable even from the air (e.g., private households versus large factory halls) and hence train a model to do so based on the satellite imagery. Nevertheless, partial information regarding building function could still be leveraged to improve population estimation results where available.
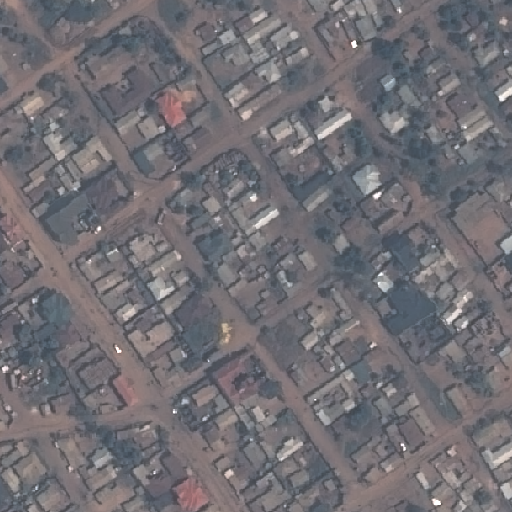
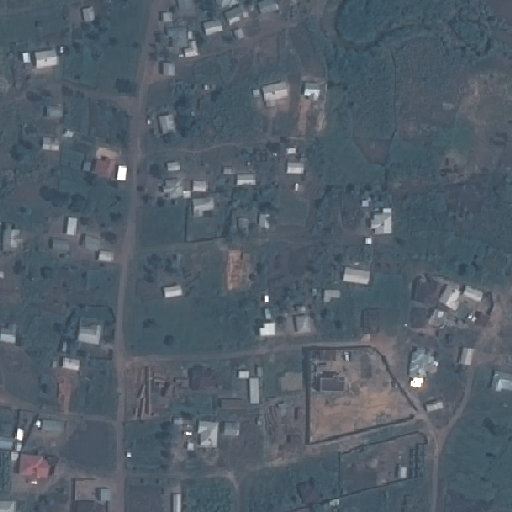
(a) Bunia
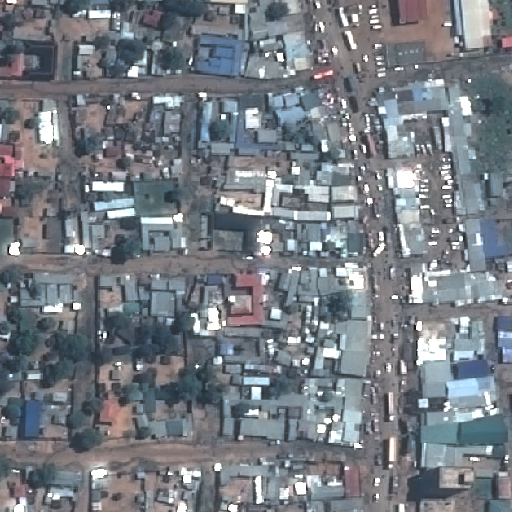
(b) Gumbo
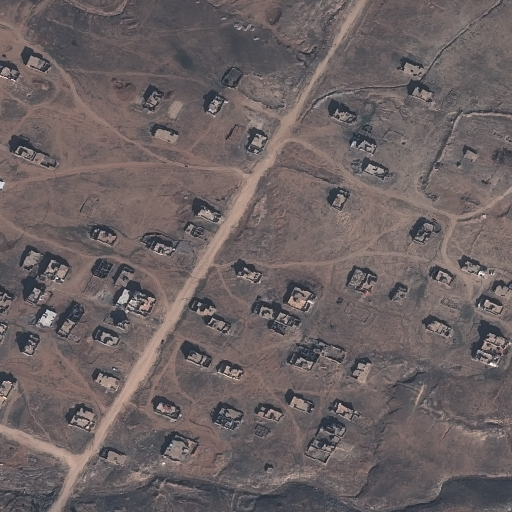
(c) Tal Afar
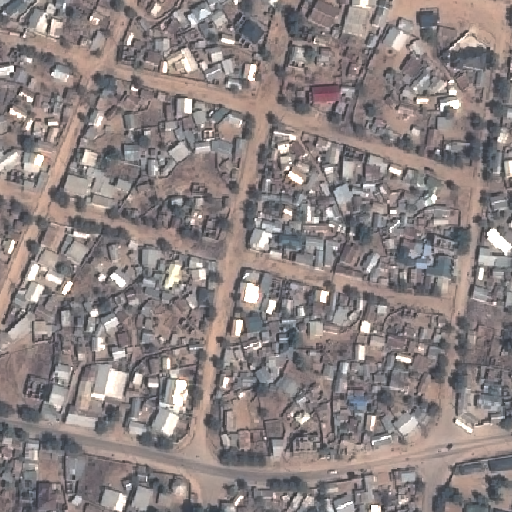
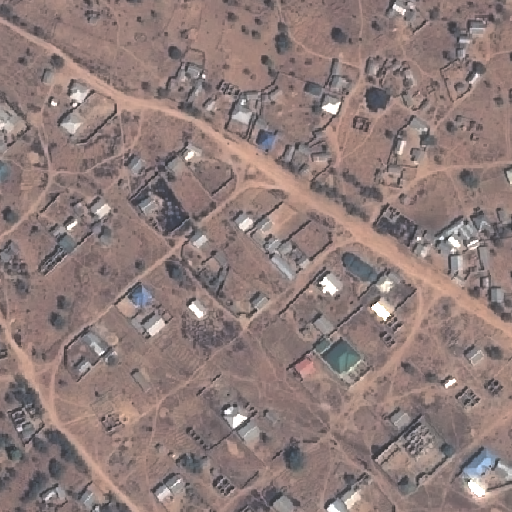
(d) Mokolo
5. Overview
The objective of this project is to develop methods that use heterogeneous sources of data to create fine-grained building maps and population distribution estimations for vulnerable regions in developing countries. We are hopeful that the methods (and in certain cases perhaps also the maps and population estimates) generated during the project could in the future support humanitarian organizations and make their mission planning more efficient. We are excited about the opportunity to have geo-data experts from the ICRC collaborate directly with researchers in remote sensing, spatial data analysis and machine learning and hope that the joint effort between the humanitarian and academic organizations will be a catalyst to achieve our goals and help protect vulnerable populations.
Acknowledgements.
This research is funded by the Science and Technology for Humanitarian Action Challenges (HAC) project.References
- (1)
- Alam et al. (2018) Firoj Alam, Ferda Ofli, Muhammad Imran, and Michael Aupetit. 2018. A Twitter tale of three hurricanes: Harvey, Irma, and Maria. In Information Systems for Crisis Response and Management.
- Ben-Younes et al. (2017) Hedi Ben-Younes, Rémi Cadene, Matthieu Cord, and Nicolas Thome. 2017. Mutan: Multimodal tucker fusion for visual question answering. In Proceedings of the IEEE international conference on computer vision. 2612–2620.
- Bowler et al. (2019) Ellen Bowler, Peter T Fretwell, Geoffrey French, and Michal Mackiewicz. 2019. Using deep learning to count albatrosses from space. In IEEE International Geoscience and Remote Sensing Symposium. 10099–10102.
- Carvalho et al. (2020) Marcela Carvalho, Bertrand Le Saux, Pauline Trouvé-Peloux, Frédéric Champagnat, and Andrés Almansa. 2020. Multitask Learning of Height and Semantics From Aerial Images. IEEE Geoscience and Remote Sensing Letters 17, 8 (2020), 1391–1395. https://doi.org/10.1109/LGRS.2019.2947783
- Caye Daudt et al. (2019) Rodrigo Caye Daudt, Bertrand Le Saux, Alexandre Boulch, and Yann Gousseau. 2019. Guided Anisotropic Diffusion and Iterative Learning for Weakly Supervised Change Detection. In Proceedings of the IEEE/CVF Conference on Computer Vision and Pattern Recognition (CVPR) Workshops.
- Cheng et al. (2019) Dominic Cheng, Renjie Liao, Sanja Fidler, and Raquel Urtasun. 2019. Darnet: Deep active ray network for building segmentation. In IEEE/CVF Conference on Computer Vision and Pattern Recognition. 7431–7439.
- Facciolo et al. (2017) Gabriele Facciolo, Carlo De Franchis, and Enric Meinhardt-Llopis. 2017. Automatic 3D Reconstruction from Multi-date Satellite Images. In 2017 IEEE Conference on Computer Vision and Pattern Recognition Workshops (CVPRW). 1542–1551. https://doi.org/10.1109/CVPRW.2017.198
- Fatehkia et al. (2020a) Masoomali Fatehkia, Benjamin Coles, Ferda Ofli, and Ingmar Weber. 2020a. The relative value of Facebook advertising data for poverty mapping. In AAAI Conference on Web and Social Media, Vol. 14. 934–938.
- Fatehkia et al. (2020b) Masoomali Fatehkia, Isabelle Tingzon, Ardie Orden, Stephanie Sy, Vedran Sekara, Manuel Garcia-Herranz, and Ingmar Weber. 2020b. Mapping socioeconomic indicators using social media advertising data. EPJ Data Science 9, 1 (2020), 22.
- Fukui et al. (2016) Akira Fukui, Dong Huk Park, Daylen Yang, Anna Rohrbach, Trevor Darrell, and Marcus Rohrbach. 2016. Multimodal Compact Bilinear Pooling for Visual Question Answering and Visual Grounding. In EMNLP 2016. Association for Computational Linguistics, Austin, USA, 457–468.
- Häberle et al. (2019) Matthias Häberle, Martin Werner, and Xiao Xiang Zhu. 2019. Geo-spatial text-mining from Twitter–a feature space analysis with a view toward building classification in urban regions. European Journal of Remote Sensing 52, sup2 (2019), 2–11.
- Hamaguchi and Hikosaka (2018) Ryuhei Hamaguchi and Shuhei Hikosaka. 2018. Building detection from satellite imagery using ensemble of size-specific detectors. In IEEE Conference on Computer Vision and Pattern Recognition Workshops. 187–191.
- Han et al. (2020a) Sungwon Han, Donghyun Ahn, Hyunji Cha, Jeasurk Yang, Sungwon Park, and Meeyoung Cha. 2020a. Lightweight and robust representation of economic scales from satellite imagery. In Proceedings of the AAAI Conference on Artificial Intelligence, Vol. 34. 428–436.
- Han et al. (2020b) Sungwon Han, Donghyun Ahn, Sungwon Park, Jeasurk Yang, Susang Lee, Jihee Kim, Hyunjoo Yang, Sangyoon Park, and Meeyoung Cha. 2020b. Learning to score economic development from satellite imagery. In Proceedings of the 26th ACM SIGKDD International Conference on Knowledge Discovery & Data Mining. 2970–2979.
- Imran et al. (2020) Muhammad Imran, Ferda Ofli, Doina Caragea, and Antonio Torralba. 2020. Using AI and social media multimodal content for disaster response and management: Opportunities, challenges, and future directions. Information Processing & Management 57, 4 (2020), 102261.
- Marcos et al. (2018) Diego Marcos, Devis Tuia, Benjamin Kellenberger, Lisa Zhang, Min Bai, Renjie Liao, and Raquel Urtasun. 2018. Learning deep structured active contours end-to-end. In IEEE Conference on Computer Vision and Pattern Recognition. 8877–8885.
- Mou and Zhu (2018) Lichao Mou and Xiao Xiang Zhu. 2018. IM2HEIGHT: Height estimation from single monocular imagery via fully residual convolutional-deconvolutional network. arXiv preprint arXiv:1802.10249 (2018).
- Pesaresi et al. (2013) Martino Pesaresi, Guo Huadong, Xavier Blaes, Daniele Ehrlich, Stefano Ferri, Lionel Gueguen, Matina Halkia, Mayeul Kauffmann, Thomas Kemper, Linlin Lu, et al. 2013. A global human settlement layer from optical HR/VHR RS data: Concept and first results. IEEE Journal of Selected Topics in Applied Earth Observations and Remote Sensing 6, 5 (2013), 2102–2131.
- Redko et al. (2019) Ievgen Redko, Emilie Morvant, Amaury Habrard, Marc Sebban, and Younes Bennani. 2019. Advances in domain adaptation theory. Elsevier.
- Rodriguez et al. (2021) A. Rodriguez, S. D’Aronco, K. Schindler, and J. D. Wegner. 2021. Mapping Oil Palm Density at Country Scale: an Active Learning Approach. Remote Sensing of Environment 261 (2021), 112479.
- Ronneberger et al. (2015) Olaf Ronneberger, Philipp Fischer, and Thomas Brox. 2015. U-net: Convolutional networks for biomedical image segmentation. In International Conference on Medical image computing and computer-assisted intervention. Springer, 234–241.
- Shi et al. (2020) Yilei Shi, Qingyu Li, and Xiao Xiang Zhu. 2020. Building segmentation through a gated graph convolutional neural network with deep structured feature embedding. ISPRS Journal of Photogrammetry and Remote Sensing 159 (2020), 184–197.
- Srivastava et al. (2018) Shivangi Srivastava, Sylvain Lobry, Devis Tuia, and John E. Vargas Muñoz. 2018. Land-use characterisation using Google Street View pictures and OpenStreetMap. In 21st AGILE Conference on Geographic Information Science.
- Srivastava et al. (2020) Shivangi Srivastava, John E Vargas Muñoz, Sylvain Lobry, and Devis Tuia. 2020. Fine-grained landuse characterization using ground-based pictures: a deep learning solution based on globally available data. International Journal of Geographical Information Science 34, 6 (2020), 1117–1136.
- Srivastava et al. (2019) Shivangi Srivastava, John E Vargas-Muñoz, and Devis Tuia. 2019. Understanding urban landuse from the above and ground perspectives: A deep learning, multimodal solution. Remote Sensing of Environment 228 (2019), 129–143.
- Srivastava et al. (2017) Shivangi Srivastava, Michele Volpi, and Devis Tuia. 2017. Joint height estimation and semantic labeling of monocular aerial images with CNNs. In IEEE International Geoscience and Remote Sensing Symposium. 5173–5176.
- Stucker and Schindler (2020) Corinne Stucker and Konrad Schindler. 2020. ResDepth: Learned Residual Stereo Reconstruction. In 2020 IEEE/CVF Conference on Computer Vision and Pattern Recognition Workshops (CVPRW). 707–716. https://doi.org/10.1109/CVPRW50498.2020.00100
- Sun et al. (2019) Yao Sun, Yuansheng Hua, Lichao Mou, and Xiao Xiang Zhu. 2019. Large-scale building height estimation from single VHR SAR image using fully convolutional network and GIS building footprints. In Joint Urban Remote Sensing Event.
- Sun et al. (2017) Yao Sun, Muhammad Shahzad, and Xiao Xiang Zhu. 2017. Building height estimation in single SAR image using OSM building footprints. In Joint Urban Remote Sensing Event (JURSE).
- Tan and Le (2019) Mingxing Tan and Quoc Le. 2019. EfficientNet: Rethinking Model Scaling for Convolutional Neural Networks. In Proceedings of the 36th International Conference on Machine Learning (Proceedings of Machine Learning Research, Vol. 97), Kamalika Chaudhuri and Ruslan Salakhutdinov (Eds.). PMLR, 6105–6114.
- Tasar et al. (2018) Onur Tasar, Emmanuel Maggiori, Pierre Alliez, and Yuliya Tarabalka. 2018. Polygonization of binary classification maps using mesh approximation with right angle regularity. In IEEE International Geoscience and Remote Sensing Symposium. 6404–6407.
- Thomson et al. (2020) Dana R Thomson, Dale A Rhoda, Andrew J Tatem, and Marcia C Castro. 2020. Gridded population survey sampling: a systematic scoping review of the field and strategic research agenda. International Journal of Health Geographics 19, 1 (2020), 1–16.
- Tiecke et al. (2017) Tobias G Tiecke, Xianming Liu, Amy Zhang, Andreas Gros, Nan Li, Gregory Yetman, Talip Kilic, Siobhan Murray, Brian Blankespoor, Espen B Prydz, et al. 2017. Mapping the world population one building at a time. arXiv preprint arXiv:1712.05839 (2017).
- Tingzon et al. (2019) Isabelle Tingzon, Ardie Orden, Stephanie Sy, Vedran Sekara, Ingmar Weber, Masoomali Fatehkia, Manuel Garcia Herranz, and Dohyung Kim. 2019. Mapping poverty in the Philippines using machine learning, satellite imagery, and crowd-sourced geospatial information. In AI for Social Good ICML 2019 Workshop.
- Tracewski et al. (2017) Lukasz Tracewski, Lucy Bastin, and Cidalia C Fonte. 2017. Repurposing a deep learning network to filter and classify volunteered photographs for land cover and land use characterization. Geo-spatial Information Science 20, 3 (2017), 252–268.
- Vargas-Muñoz et al. (2019) John E Vargas-Muñoz, Sylvain Lobry, Alexandre X Falcão, and Devis Tuia. 2019. Correcting rural building annotations in OpenStreetMap using convolutional neural networks. ISPRS Journal of Photogrammetry and Remote Sensing 147 (2019), 283–293.
- Weber et al. (2018) Eric M Weber, Vincent Y Seaman, Robert N Stewart, Tomas J Bird, Andrew J Tatem, Jacob J McKee, Budhendra L Bhaduri, Jessica J Moehl, and Andrew E Reith. 2018. Census-independent population mapping in northern Nigeria. Remote Sensing of Environment 204 (2018), 786–798.
- Wegner et al. (2013) Jan Dirk Wegner, Jens R Ziehn, and Uwe Soergel. 2013. Combining high-resolution optical and InSAR features for height estimation of buildings with flat roofs. IEEE Transactions on Geoscience and Remote Sensing 52, 9 (2013), 5840–5854.
- Workman et al. (2017) Scott Workman, Menghua Zhai, David J Crandall, and Nathan Jacobs. 2017. A unified model for near and remote sensing. In IEEE International Conference on Computer Vision. 2688–2697.
- Wu et al. (2019) Yue Wu, Luke S Blunden, and AbuBakr S Bahaj. 2019. City-wide building height determination using light detection and ranging data. Environment and Planning B: Urban Analytics and City Science 46, 9 (2019), 1741–1755.
- Xie and Zhou (2017) Junfei Xie and Jianhua Zhou. 2017. Classification of urban building type from high spatial resolution remote sensing imagery using extended MRS and soft BP network. IEEE Journal of Selected Topics in Applied Earth Observations and Remote Sensing 10, 8 (2017), 3515–3528.