The effect of the morphological quenching mechanism on star formation activity
at in 3D-HST/CANDELS
Abstract
Several mechanisms for the transformation of blue star-forming to red quiescent galaxies have been proposed, and the green valley (GV) galaxies amid them are widely accepted in a transitional phase. Thus, comparing the morphological and environmental differences of the GV galaxies with early-type disks (ETDs; bulge dominated and having a disk) and late-type disks (LTDs; disk dominated) is suitable for distinguishing the corresponding quenching mechanisms. A large population of massive () GV galaxies at in 3D-HST/CANDELS is selected using extinction-corrected color. After eliminating any possible active galactic nucleus candidates and considering the “mass-matching”, we finally construct two comparable samples of GV galaxies with either 319 ETD or 319 LTD galaxies. Compared to the LTD galaxies, it is found that the ETD galaxies possess higher concentration index and lower specific star formation rate, whereas the environments surrounding them are not different. This may suggest that the morphological quenching may dominate the star formation activity of massive GV galaxies rather than the environmental quenching. To quantify the correlation between the galaxy morphology and the star formation activity, we define a dimensionless morphology quenching efficiency and find that is not sensitive to the stellar mass and redshift. When the difference between the average star formation rate of ETD and LTD galaxies is about 0.7 , the probability of is higher than 90%, which implies that the degree of morphological quenching in GV galaxies might be described by .
1 Introduction
With the development of the high-quality all-sky galaxy surveys, a conspicuous bimodality has been discovered on various diagrams, such as on the color-color diagram (e.g., Strateva et al. 2001; Hogg et al. 2002; Blanton et al. 2003a), on the color-magnitude (e.g., Graves et al. 2009) or color-mass diagram (e.g., Schawinski et al. 2014), and on the star formation rate (SFR)-mass diagram (e.g., Schiminovich et al. 2007). Two distinct galaxy populations with red and blue colors have been commonly referred to as the red sequence (RS) and the blue cloud (BC), respectively. The intermediate zone between the two main populations, commonly known as the green valley (GV), has been viewed as the crossroads of galaxy evolution (e.g., Salim et al. 2007; Gu et al. 2018).
By the description in a series of papers (e.g., Faber et al. 2007; Martin et al. 2007; Schawinski et al. 2007; Thomas et al. 2010; Schawinski et al. 2014; Pandya et al. 2017; Gu et al. 2018), the galaxy may cross over the GV in many possible different evolutionary pathways. On one hand, the GV galaxies can be undergoing the quenching process of star formation, which moves a galaxy from the BC to the RS. To explore the evolutionary connection among red, green, and blue galaxy populations, Gu et al. (2018) investigate different physical properties of these three populations at in the five 3D-HST/CANDELS fields, including dust content, morphologies, structures, active galactic nucleus (AGN) fraction, and environments. Their findings favor the scenario that the GV galaxies are at a transitional phase from the BC to the RS, which is consistent with multiple survey-based studies (e.g., Schiminovich et al. 2007; Pandya et al. 2017). On the other hand, the GV galaxies may be caused by rejuvenation events from infalling of gas clouds or gas-rich smaller galaxies. Thomas et al. (2010) and Chauke et al. (2019) find that rejuvenating galaxies have undergone some secondary star-formation events at low and high redshifts. The rejuvenation event can also give a possible explanation for some GV galaxies showing blue outer regions (Thilker et al. 2010; Salim & Rich 2010; Fang et al. 2012).
The time-scale of a galaxy across the GV relies on the evolutionary process of the galaxy itself, accompanying morphological transformation (e.g., Wuyts et al. 2011b). Utilizing galaxies at from the Galaxy and Mass Assembly (GAMA) survey, Phillipps et al. (2019) derive that the evolutionary time-scales of typical low-redshift galaxies from the BC through the GV to the RS are about 2-4 Gyr. In contrast, Pandya et al. (2017) place an observational upper limit on the average population transition time-scale as a function of redshift, finding that galaxy quenching is on a fast track at high redshift, whereas it is on a slow track at low redshift, which is also consistent with the results from Gu et al. (2019). Note that the quenching should be correlated with the morphology of the galaxy, if the quenching mechanism involves the reorganization of the stellar component of the galaxy via compaction events or dissipative mergers (Dekel et al. 2009; Barro et al. 2013, 2017; Wellons et al. 2015) or a natural consequence of ‘inside-out’ growth combined with disk fading (e.g., Lilly & Carollo 2016). Schawinski et al. (2014) analyze the morphology of GV galaxies, and reveal two evolutionary pathways toward quenching in early-type galaxies (ETGs) and late-type galaxies (LTGs): a short quenching timescale (100 Myr) for ETGs and a longer timescale (2-3 Gyr) for LTGs.
Contrary to the common quenching mechanisms, used to remove the cold gas reservoir or shut down any fresh supply of cold gas, such as merger or disk instabilities (e.g., Toomre & Toomre 1972; Dekel et al. 2009) and some feedback (e.g., Cai et al. 2013; Brennan et al. 2017), “morphological quenching” (MQ), proposed by Martig et al. (2009), has usually been regarded as a quenching mechanism of star formation, where once the spheroid has been built up via early minor merger the gas disk can be stabilized against star formation without an external mechanism to remove its present gas or terminate its fresh gas supply. The gravitational potential of a centrally concentrated bulge not only can help stabilize the gas against fragmenting, suggested by simulations from Su et al. (2019) and Gensior et al. (2020), but also can decrease the strength of bars and the efficiency of gas consumption toward the galactic center (Barazza et al. 2008; Fragkoudi et al. 2016), finally leading to a reduced SFR (Zurita et al. 2004; Sheth et al. 2005). The natural process of MQ proposes a simple explanation for the local observations of some red ETGs hosting significant amounts of atomic or molecular gas with high densities (e.g., Morganti et al. 2006; Crocker et al. 2009; Young et al. 2009; Donovan et al. 2009), and the conspicuously observed bimodality of galaxies.
The GV galaxy is thus a suitable sample to be studied because it can make sense to compare the morphological transition of ETGs and LTGs in the GV at the same evolutionary stage. Recently, on the basis of the CO( =1-0) observation of nearby () GV galaxies, Koyama et al. (2019) assess the effects of GV galaxy morphologies (i.e., disk- and bulge-dominated GV galaxies) on the efficiency of star formation, and find that the emergence of the stellar bulge does not decrease the efficiency of ongoing star formation, which contrasts with the prediction of the MQ (e.g., Martig et al. 2009; Bluck et al. 2014). But conceivably, the MQ could be even more important at high redshift, which results from the fact that the RS is already in place (e.g., Gu et al. 2018, 2019), and the gas fraction in ETGs might be higher owing to the higher gas infall rates and the greater presence of unvirialized clusters (e.g., Bell et al. 2004; Cirasuolo et al. 2007). Therefore, it is still desirable to assess the effects of galaxy morphologies on the star formation quenching at higher redshift.
In order to discern the real impact of the MQ mechanism on star formation activity, especially at high redshift, we utilize the extinction-corrected rest-frame - color (Wang et al. 2017) to construct a sample of massive () GV galaxies at in the five fields of 3D-HST/CANDELS (Grogin et al. 2011; Koekemoer et al. 2011; Skelton et al. 2014). After excluding the influence of AGNs as much as possible, the sample of GV galaxies is further separated into ETGs and LTGs, based on a catalog of visual-like H-band morphologies estimated using convolutional neural networks, which is provided by Huertas-Company et al. (2015b). We then compare the concentration, the specific SFR (sSFR), the morphology quenching efficiency (), and the surrounding environment of ETGs and LTGs to gradually clarify the effect of MQ on the star formation activity.
The layout of this paper is as follows. The data set and our sample construction are described in Section 2. We analyze the MQ on star formation activity for early-type disk (ETD) and late-type disk (LTD) galaxies in GV galaxies in Section 3 through comparisons of the concentration in Section 3.1, the sSFR in Section 3.2, the MQ efficiency in Section 3.3, and the environment in Section 3.4. Discussion on the MQ is presented in Section 4. The final summary is given in Section 5. Throughout our paper, we adopt the cosmological parameters as follows: , , and .
2 Data and Sample
2.1 3D-HST/CANDELS
The 3D-HST and CANDELS Multi-Cycle Treasury programs have provided WFC3 and ACS spectroscopy and photometry in five fields in a homogenous way, including the AEGIS, COSMOS, GOODS-North, GOODS-South, and UKIDSS UDS fields (Grogin et al. 2011; Koekemoer et al. 2011; Skelton et al. 2014). The coverage is over 900 arcmin2 which is helpful to relieve the effect of cosmic variance. A wealth of the homogeneous imaging data benefits construction of the spectral energy distributions (SEDs) of objects over a wide wavelength range.
The corresponding derived data products are provided by Skelton et al. (2014), including the photometric redshift, the rest-frame colors, and the stellar population parameters. Skelton et al. (2014) use the EAZY code (Brammer et al. 2008) to determine the photometric redshift by fitting the SED of each galaxy with a linear combination of seven galaxy templates. In this work, we preferentially take the spectroscopic redshift () if available; otherwise, we use the photometric redshift (). The estimates have a high precision, with the largest (lowest) =0.026 (0.007) for GOODS-N (COSMOS). Additionally, Skelton et al. (2014) utilize the FAST code (Kriek et al. 2009) to derive stellar population parameters, such as the stellar mass () and dust attenuation (), adopting the Bruzual & Charlot (2003) stellar population synthesis (SPS) models with a Chabrier (2003) initial mass function (IMF) and solar metallicity. While it is more reasonable for high-redshift star-forming galaxies (SFGs) to take the contribution of the asymptotic giant branch (AGB) stars into consideration, Wang et al. (2017) thus adopt the Maraston (2005) SPS models instead of Bruzual & Charlot (2003) SPS models to better estimate the dust attenuation (). In order to ensure the consistency on the definition of the GV, we also perform the FAST code to reassess the stellar population parameters, following Wang et al. (2017). This means that, assuming an exponentially declining star-forming history and the Calzetti et al. (2000) extinction, the Maraston (2005) SPS models with a Kroupa (2001) IMF and solar metallicity are taken instead. As described in Gu et al. (2018), comparing the values of stellar mass and derived with the Bruzual & Charlot (2003) SPS models and the Chabrier (2003) IMF to those derived with Maraston (2005) SPS models and the Kroupa (2001) IMF, the difference is small. The average values of stellar mass () for the latter are 0.05 dex (0.18 dex) lower than those for the former, which is due to the contribution of AGB stars.
The SFR of a galaxy is estimated by combing contributions of the ultraviolet (UV) light from massive stars and of the infrared (IR) emissions of dust-reprocessed light from an older stellar population. Both UV and IR emissions have been provided by Whitaker et al. (2014). Assuming a Chabrier (2003) IMF and the Bell et al. (2005) UV conversion, the total SFR can be derived by
| (1) |
where represents the integrated rest-frame UV (1216-3000 Å) luminosity, defined by a factor of 1.5 times the 2800 Å rest-frame monochromatic luminosity, . The IR luminosity, , represents the integrated 8-1000 luminosity, which is converted from the Spitzer/MIPS 24 data using a single luminosity-independent template (Dale & Helou, 2002; Wuyts et al., 2008; Franx et al., 2008). If the 24 detection is unavailable, the SFR will be corrected by dust attenuation (), assuming the Calzetti et al. (2000) dust attenuation curve:
| (2) |
where , assuming the Chabrier (2003) IMF, which is following Wuyts et al. (2011a). The is derived during the SED fitting with the FAST code. The acceptable agreement between and is confirmed by previous works (e.g., Rangel et al. 2014; Fang et al. 2018; Gu et al. 2019, 2020).
2.2 Morphology
The kinematics and evolutionary history of a galaxy are all relevant to its morphology (Kormendy & Kennicutt, 2004).
Huertas-Company et al. (2015b) present a catalog of visual-like -band morphologies of 50,000 galaxies in the five CANDELS fields. Morphologies are estimated by mimicking human perception with deep learning using convolutional neural networks.
For each galaxy there are five parameters , , , , and , which refer to the probabilities of having a spheroid, a disk, some irregularities, being a point source (or unresolved), and being unclassifiable, respectively. From the morphological analysis of Gu et al. (2018) (see their Section 4 for details), in the same five 3D-HST/CANDELS fields, it can be found that there are more than 50 of GV galaxies at that classified as the ETD and LTD types. Therefore, following the classification of Huertas-Company et al. (2015b), we utilize the thresholds in the different probabilities to select the ETD galaxies (bulge dominated and having a disk) and LTD galaxies (disk dominated) at , for the purpose of a more comprehensive analysis on the MQ in the GV galaxies. The definitions of classification for ETD and LTD galaxies are presented here:
1. ETDs: , , and ;
2. LTDs: , , and .
To quantitatively describe the bulge of a galaxy, we perform the nonparametric measurements on the near-IR (NIR) images, using the Morpheus software developed by Abraham et al. (2007). The nonparametric parameter refers to the concentration index (), which can describe the concentration of the surface brightness distribution of a galaxy. Many previous works have tested and adopted this measurement (Kong et al. 2009; Wang et al. 2012; Fang et al. 2015; Gu et al. 2018, 2019; Lu et al. 2020). The nonparametric measurements are sensitive to the signal-to-noise ratio () per pixel, especially for (Lotz et al. 2004; Lisker 2008), while one of our selection criteria, =1, can ensure that our measurements are performed on a reliable detection in the (see section 2.3). Therefore, the measurement of the concentration index, , is reliable and should not suffer from the signal-to-noise ratio () effect.
2.3 Sample Selection
We make use of a large set of multiwavelength photometric data from 3D-HST/CANDELS to construct a sample of massive () galaxies with reliable detection (=1) at . The flag of =1 can ensure that the source is a galaxy and not close to a bright star and is detected in at least two individual exposures in each of the F125W and F160W bands. Meanwhile, the flag also means that the detected source has an in the F160W with “noncatastrophic” fits on both the photometric redshift and stellar population properties (see section 3.8 in Skelton et al. 2014). The completeness above the mass threshold, , is 90% up to the highest redshift considered (Grogin et al. 2011; Wuyts et al. 2011a; Newman et al. 2012; Barro et al. 2013; Pandya et al. 2017).
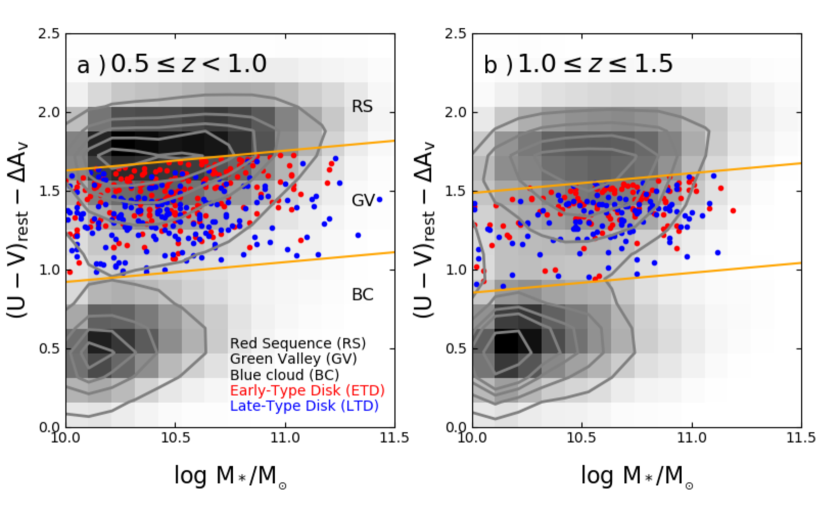
For constructing the sample of GV galaxies precisely, we adopt the color-based separation criteria from Wang et al. (2017). Inspired by Brammer et al. (2009), Wang et al. (2017) consider the extinction correction to avoid the blend of quiescent RS galaxies and dusty SFGs. The criteria for separating galaxies into BC, GV, and RS galaxy populations are as follows:
where is the extinction correction of rest-frame color, and the correction factor 0.47 is determined by the Calzetti et al. (2000) extinction law. The GV galaxies are distributed in the middle of the double lines. In this work, we first select 1316 GV galaxies at , and utilize the morphological classification of galaxies in Huertas-Company et al. (2015b) to select 376 ETD and 436 LTD galaxies (see section 2.2 for details).
Considering the AGN effect on galaxy morphology and avoiding the complexity of GV evolutionary mechanisms due to AGN feedback, we eliminate AGN candidates from the sample of GV galaxies as much as possible. The X-ray sources are classified as AGN candidates by Xue et al. (2016) in Chandra Deep Field-North (CDF-N) and Luo et al. (2017) in Chandra Deep Field-South (CDF-S), which satisfy at least of one of the following criteria: (1) the intrinsic X-ray luminosity erg s-1; (2) the effective photon index ; (3) the X-ray-to-optical flux ratio , where =, , or , and represents the observed-frame R-band flux; (4) , where represents the rest-frame 1.4 GHz monochromatic luminosity in units of W Hz-1; (5) identified as AGN by spectral certification (more detail to see Xue et al. 2011). By cross-matching the catalogs from Xue et al. (2016) and Luo et al. (2017) within a radius of , we remove those X-ray AGN candidates from our GV sample. Besides, the mid-infrared (MIR) color criterion as a potentially powerfully technique is gradually accepted by many studies to identify obscured AGN candidates (Fang et al. 2015; Bornancini et al. 2017; Chang et al. 2017; Lu et al. 2020), because the MIR emission is relatively insensitive to the intervening obscuration, so that it can trace the reprocessed radiation of dust heated by its central nucleus (Lacy et al. 2004, 2007; Stern et al. 2005; Donley et al. 2012). Therefore, we also adopt the MIR color criteria from Donley et al. (2012) to get rid of MIR AGN candidates. After removing a total of 66 AGN candidates, there are 216 ETD and 200 LTD galaxies left at , and 119 ETD and 211 LTD galaxies left at . It is worth noting that within observation limits, although we have adopted as much as possible criteria to eliminate the effect of AGN candidates on our sample, it is still hard to remove some sources with weak AGN activity or star-forming feedback. Thus, these potential sources can also fit well with the following results.
Subsequently, in order to minimize the stellar mass effects on the statistics of the morphological analysis, we further build a “mass-matched” sample of massive galaxies at to ensure that the selected ETD and LTD galaxies have the same distributions of redshift and stellar mass. Following Gu et al. (2019), we also define the minimum count among two populations as the number of galaxies in the mass-matched sample in fixed redshift and stellar mass bins. To be specific, for every galaxy with (, ) in the ETD galaxies with the minimum count, the unique one with the smallest value of is selected from the other LTD galaxies into the mass-matched sample. Finally, our sample consists of 200 ETD and 200 LTD galaxies at , and 119 ETD and 119 LTD galaxies at . As shown in Figure 1, the extinction-corrected rest-frame color as a function of stellar mass is present. The orange lines represent the separation criteria from Wang et al. (2017). The region between two orange lines is called as the GV, and the upper and lower regions are the RS and BC, respectively. The ETD (red) and LTD (blue) galaxies in our GV sample are evenly distributed in the middle region.
3 Analysis
In order to understand the impact of the MQ mechanism on the star formation activity of GV galaxies, the comparison between ETD and LTD galaxies in the concentration, sSFR, morphology quenching efficiency , and environment will be analyzed and discussed.
3.1 Concentration
Nonparametric measurements are performed on the NIR images to derive the concentration index () by using the Morpheus software (Abraham et al. 2007). The concentration index , defined by Abraham et al. (1994), can be calculated by the ratio between the integral flux within the inner isophotal radius, 0.3R, and the integral flux within the outer isophotal radius, R. For a given galaxy with a high , this implies that the light of a galaxy is concentrated at the center, and a galaxy with a higher might further possess a centrally concentrated bulge, which can bind more masses through its central gravitational potential.
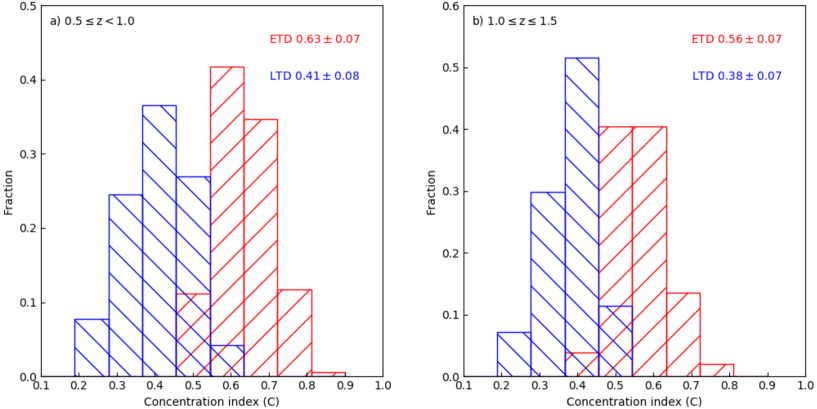
The histograms of the concentration index of ETD (red) and LTD (blue) galaxies in GV at and are shown in Figure 2. This presents that the histograms of ETD galaxies are obviously distributed at the higher end of concentration index , whereas the histograms of LTD galaxies place at the lower end. As expected, ETD galaxies possess a higher concentration, which is in line with the result of van der Wel et al. (2014), who find that ETGs are on average smaller than LTGs. The corresponding mean values and standard deviations of ETD and LTD galaxies are also present in the upper right corner of the figure. From the higher- to lower-redshift bin, it can be found that both the mean values of the concentration indices of ETD and LTD galaxies become larger and the concentration difference between them seems to be larger. Similar results also can be found within a fixed stellar mass bin (i.e., , , and ). As mentioned in panels (e)-(h) of Figure 5 from Gu et al. (2018), the morphological transformation of GV galaxies with cosmic time is accompanied by the growth of the bulge component as well.
3.2 Specific Star Formation Rate
Trends between the sSFR and morphology have been studied in many previous works in which the sSFR of a galaxy is anticorrelated with central mass concentration or the presence of a bulge (e.g., Kauffmann et al. 2003b; Franx et al. 2008; Wuyts et al. 2011b; Lang et al. 2014; Whitaker et al. 2015; McPartland et al. 2019). For instance, earlier-type spiral galaxies have lower sSFRs than later-type spirals (Parkash et al. 2018). The lower sSFRs of massive galaxies may indicate a lower star formation efficiency rather than a lower gas fraction (Schreiber et al. 2016). Therefore, we compare the sSFR distribution of ETD galaxies with that of LTD galaxies to figure out whether the morphological suppression due to the presence of a central bulge has an influence on the sSFR.
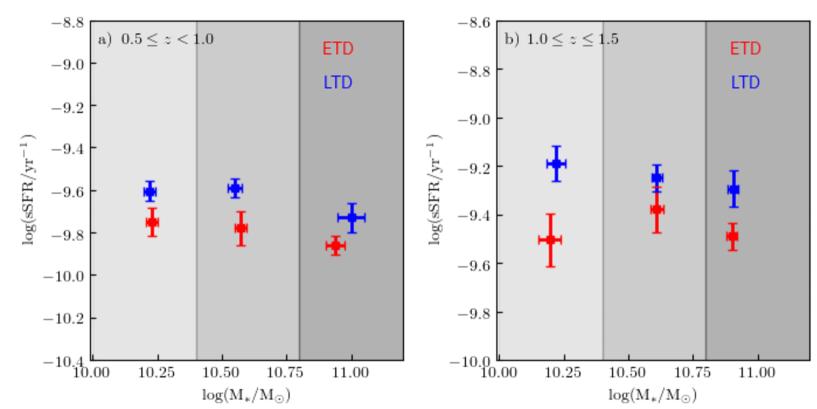
Figure 3 shows the sSFR-stellar mass relation at , considered in three stellar mass bins. Comparing the relation of ETD (red) galaxies with that of LTD (blue) galaxies, it is apparent that ETD galaxies possess lower sSFR than LTD galaxies regardless of the different stellar mass bins, which is consistent with previous works (e.g., Kauffmann et al. 2003b; Franx et al. 2008; Wuyts et al. 2011b). It also might hint that the presence of a central bulge is conducive to suppress the star formation activity of a galaxy. With the increase of the stellar mass, both ETD and LTD galaxies have slightly decreasing signs of their star formation, especially for massive ETD galaxies. This implies that massive bulge-dominated GV galaxies may spend a shorter time quenching their star formation than less massive GV galaxies, which is also in line with the “downsizing” scenario, where massive SFGs are formed and subsequently quenched at an earlier epoch than those less massive SFGs (e.g., Cowie et al. 1996; Noeske et al. 2007; Gonçalves et al. 2012; Gu et al. 2018). Besides, if we ignore the red point with a larger error bar for the ETD galaxies in the lowest stellar mass bin at , it can be found that both the sSFR of ETD galaxies and that of LTD galaxies are getting smaller with cosmic time, which might suggest that the GV galaxies are gradually quenching their star formation into the red sequence with the gradual consumption of gas reserves.
3.3 Morphology Quenching Efficiency
It has long been known that SFGs evolve into the passive galaxies by quenching their star formation, which is usually accompanying morphological transformation (e.g., Kauffmann et al. 2003b; Wuyts et al. 2011b; Whitaker et al. 2015).
From the studies of the Sérsic index and stellar mass profiles, it has been found that GV galaxies host larger bulges than BC galaxies at the same stellar mass (Schiminovich et al. 2007; Fang et al. 2013).
The so-called MQ scenario thus has been proposed for the star formation quenching mechanism (Martig et al. 2009). The description of MQ has always been qualitative for a long time, whereas it lacks a quantitative description and discussion instead. Therefore, in order to quantify the contribution of the galaxy bulge to the suppression of star formation, we try to define a simple morphology quenching efficiency (), a dimensionless parameter, as the deficiency in the ratio of the median sSFR of ETD galaxies and LTD galaxies compared with the unity:
| (3) |
Removing the effect of AGNs on our sample as much as possible, if the presence of the bulge of a galaxy can help quench its star formation, it will result in that the median sSFR of ETD galaxies is lower than that of LTD galaxies. Subsequently, the MQ can be reflected by the increase of . When the value of is close to zero, it implies that the morphology quenching may not be important for GV galaxies, as claimed by Koyama et al. (2019) for local GV galaxies.
| Redshift Range | Stellar Mass Range | |
|---|---|---|
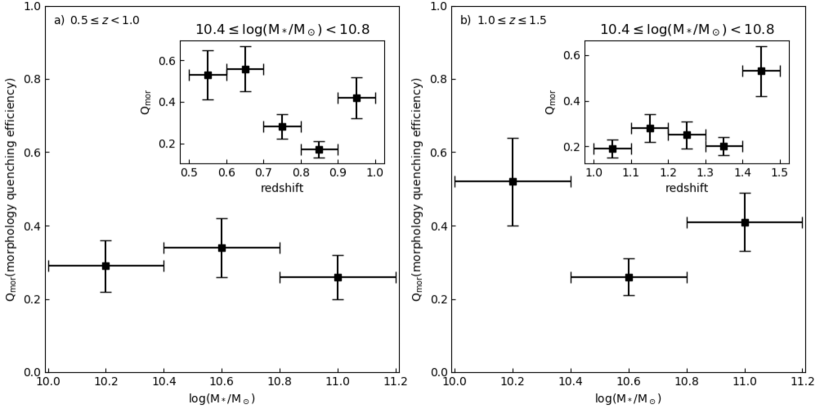
In two redshift intervals, the is calculated in three stellar mass bins and the corresponding values are given in Table 1. Figure 4 also presents the distribution of in different stellar mass bins. From both Figure 4 and Table 1, it can be found that the is always larger than 0.2 regardless of the difference in stellar mass. Considering the dependence of on redshift, we recalculate in smaller different redshift bins and find that the morphology quenching efficiency is not sensitive to redshift. The inset panels of Figure 4 show for a fixed redshift bin of =0.1 the redshift evolution of in the typical stellar mass bin (). On average, all are greater than 0.2 within the error range. The above results may suggest that within the redshift range from 0.5 to 1.5 the morphology quenching efficiency seems to be insensitive to the different stellar mass and redshift.
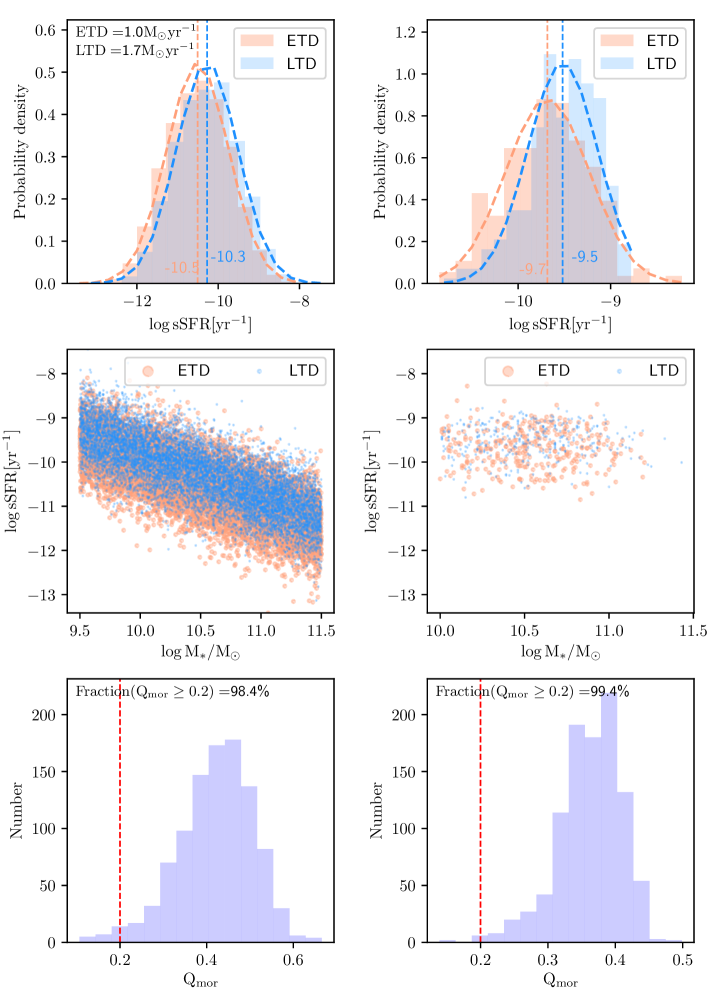
Besides, in order to measure the effect of SFR on the value of , a quantitative experiment is adopted. First, each type of mock sample consists of 10,000 galaxies with stellar masses spanning uniformly from to . And normal distributions of for both are assumed with different means but the same variances , which are derived by fitting our real ETD and LTD subsamples. As shown in Figure 5, the top panels present the sSFR’s distributions of the ETD (salmon) and LTD (blue) galaxies for the mock (left) and real (right) sample, respectively, and the corresponding scatter diagrams between sSFR and stellar mass are shown below. Then, we randomly choose 500 galaxies from each type of sample at a time to calculate the corresponding median value of sSFR and . After repeating this process 1000 times, as shown in the bottom of Figure 5, when the difference of the mean SFR between ETD and LTD galaxies is about , about 98.4 of are greater than 0.2, which is comparative to that fraction (99.4%) by repeating the process for our real sample. And the fraction tends to be smaller () with the increasing variance . While both the intrinsic scatter and uncertainties of SFR included in its variance, are hardly separated clearly, the more precise criterion of thus is not easily obtained. Therefore, the degree of morphological transition on the quenching of GV galaxies at in this work tends to be described by the value of the morphology quenching efficiency of 0.2 with the difference of the mean SFR between ETD and LTD galaxies , which is a quantitative value compared to before.
3.4 Environment
The observed properties of galaxies are generally considered to be related to their host environment. In the local universe, it has been confirmed that early-type passive galaxies often live in dense environments (e.g., groups and clusters), whereas in less dense environments (i.e., field) most galaxies are late-type and star-forming (e.g., Dressler 1980; Balogh et al. 2004; Kauffmann et al. 2004; Peng et al. 2010; Woo et al. 2013; Abraham et al. 2007). While this situation remains controversial at intermediate to high redshifts, the star formation of galaxies is found to be enhanced in a dense environment (e.g., Elbaz et al. 2007; Cooper et al. 2008), or to be not significant related to the environment (e.g., Darvish et al. 2016), or to be similar to the relation as in the local universe (e.g., Patel et al. 2009). Compared to the “MQ” (an internal process), the “environmental quenching” (an external process) is also a relevant mechanism to reduction and cessation of star formation in a galaxy. In order to further discern which mechanism is the most dominant in quenching galaxies, we improve the traditional measurement of the environment (as mentioned in Gu et al. 2020) and compare the environment around ETD galaxies to that around LTD galaxies.
Instead of the traditional indicator of local environment, which often relies on the 10th nearest neighbor or the total number of near galaxies in a fixed radius (Dressler 1980), we have modified the environmental indicator using the Bayesian metric to consider the distances of all N neighboring galaxies (Ivezić et al. 2005; Cowan & Ivezić 2008). The method can improve the accuracy of density estimation by 3.5 times over the reconstructed probability density distribution (see Ivezić et al. 2005 for details). To ensure the high accuracy of redshift in the 3D-HST/CANDELS (Skelton et al. 2014), a magnitude-limited ( ) sample at is constructed first, and then we can estimate the local surface density of every galaxy in the sample by , where is the projected distance to the ith nearest neighbor within a redshift slice (, ). Subsequently, we define the dimensionless overdensity, , as the environment indicator:
| (4) |
where /arcmin-2 is the surface number density within a given redshift slice. The denominator , a typical tracer of environment, can be evaluated by multiplying the correction factor and the local surface density , where the adopted value of is equal to 0.06. And the determination of overdensity has been proven to be competent to trace the high-redshift structure by reseeking some known galaxy groups and cluster candidates, such as J021734-0513 at (Galametz et al. 2018) and CIG 0218.3-0510 at (Papovich et al. 2010).
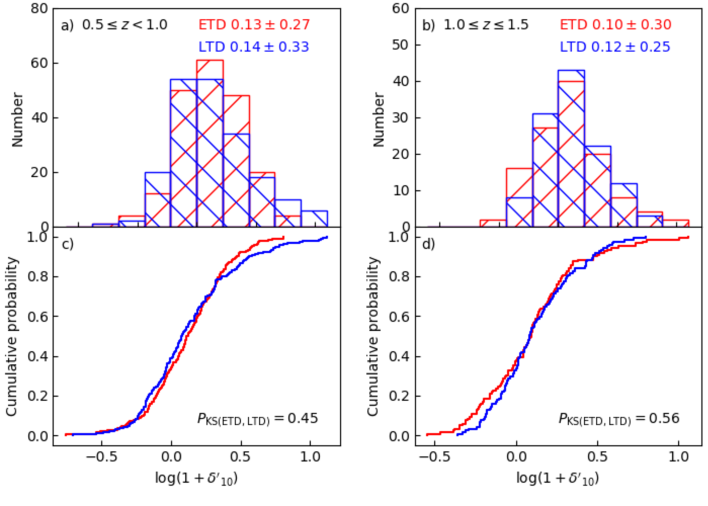
The overdensity distributions of ETD (red) and LTD (blue) galaxies in two redshift bins are shown in the top panels of Figure 6. Both ETD and LTD galaxies have similar histograms and mean values of the environmental tracer. In order to illuminate the difference between their environments, the corresponding cumulative distribution functions are given in the bottom panels. And the Kolmogorov-Smirnov (K-S) tests between ETD and LTD galaxies in two z-bins are performed to see whether both subsamples are drawn from the same underlying parent distribution. The upper limit of the probability of K-S test, quantitative, is 0.05, verifying that two samples have different distributions of environment at significance. In Figure 6, the high probabilities of the K-S test between ETD and LTD galaxies reveal that there is no difference between the environments surrounding the ETD and LTD galaxy, which are still established within fixed stellar mass bins. Compared to LTD galaxies, ETD galaxies tend to have lower sSFR, but both reside in a similar environment, which might suggest that the quenching of star formation for massive () GV galaxies at is not predominated by the environment. Based on the same CANDELS, Ge et al. (2020) and Chartab et al. (2020) both have confirmed that the environmental quenching is more efficient for low-mass () galaxies at , rather than for massive () galaxies, which agrees with our result.
4 Discussion
Much of the work on GV galaxies has found that GV galaxies are expected to be in the star formation quenching phase (Bell et al. 2004; Faber et al. 2007; Martin et al. 2007; Gu et al. 2018, 2019), which is suitable for studying the impact of galaxy morphologies on the quenching of star formation. Thus, we construct two subsamples of ETD and LTD galaxies in the GV stage at the intermediate redshifts to compare their concentrations, sSFRs, morphology quenching efficiencies , and environment. Actually, both internal and external processes are closely related to the suppression of the star formation of a galaxy. The internal processes often refer to those that are relevant to individual galaxy properties, such as the morphology and the presence of an AGN, while in this work, regardless of the effect of some sources with weak AGN activity or star-forming feedback, we have eliminated as much as possible the influence of AGNs on host galaxies (see section 2.3 for details), just leaving the impact of the morphology of the galaxy. In contrast, the external processes are usually relative to the surrounding environment of a galaxy. In section 3, the comparisons of ETD and LTD galaxies have suggested that the environments surrounding both ETD and LTD galaxies are similar, whereas ETD galaxies possess higher concentration and lower sSFR than LTD galaxies. This might hint that it is the impact of the galaxy morphology, not the environment, that may play a more important role in the star formation quenching of the massive () GV galaxies at , which is consistent with the results of Gu et al. (2019) and Ge et al. (2020). And it also agrees with the previous result that low-mass () galaxies at is more dependent on the environmental effect (Scoville et al. 2013; Lee et al. 2015; Guo et al. 2017). Note that those comparisons between ETD and LTD galaxies are under similar stellar mass and redshift distributions (see section 2.3 for details).
To quantify the effect of quenching on star formation in a galaxy, we define a parameter of the morphology quenching efficiency to correlate the sSFR of the galaxy with its morphological transformation. In Figure 4, it is shown that the has no apparent dependence on stellar mass and redshift, and the value of is always larger than 0.2 within the error range. Meanwhile, a quantitative experiment on the SFR’s effect on the measured indicates that, assuming a uniform stellar mass distribution and a normal distribution of SFR for each type, the fraction of can be as high as 98.4 when the difference between the mean SFRs of ETD and LTD galaxies is about . It is comparable to that fraction () from our real GV sample, which might hint that the level of the difference between the mean SFRs of ETD and LTD galaxies in our GV sample tends to be about , and the level of the morphology quenching in our GV galaxies tends to be quantified by this value (i.e., =0.2). Generally, our results are in line with the morphological transformation sequence of bulge buildup for the similar GV galaxies from Gu et al. (2019), which is seen as their star formation activities are gradually shut down at . In contrast, Koyama et al. (2019) use 35 GV galaxies at to reveal their distributions of molecular gas mass and fraction and the star formation efficiency, while their results suggest that the presence of the stellar bulge does not reduce the efficiency of ongoing star formation in GV galaxies. The cause may be that their GV galaxies are selected from a small window in the -sSFR plane (i.e., and ), in which the intrinsic effect of a galaxy bulge may not be well revealed. Compared to our higher stellar mass bin (i.e., ), our median values of sSFR for ETD and LTD galaxies are larger than the upper limit of sSFR in Koyama et al. (2019), and the calculated by us are still more than 0.2.
Besides, it is worth mentioning that the quenching time of the GV sample at is longer than that at higher redshift. Previous works have found that the average galaxy quenching timescale decreases with increasing redshift (Pandya et al. 2017; Gu et al. 2019). Following the definition of the GV of Wang et al. (2017), Lin et al. (2021) have introduced a cluster method to estimate the lifetimes of the RS, GV, and BC galaxies at by adopting six different halo mass functions (HMFs) from previous works (Sheth et al. 2001; Reed et al. 2007; Tinker et al. 2008; Crocce et al. 2010; Watson et al. 2013 ). And it is found that the average lifetime of GV at is about 2 Gyr, while it is about 334 Myr at regardless of the adopted HMFs. Due to the same GV definitions used in this work, this perhaps implies that our GV galaxies go through a longer timescale of morphology quenching at . Therefore, the results presented here tend to be biased toward GV galaxies with slower quenching rates.
5 Summary
In this work, we present an analysis of the effect of MQ on the massive () ETD and LTD green valley galaxies at in all five 3D-HST/CANDELS fields by comparing their morphology, sSFR, and environment. Following are our main conclusions.
After eliminating the influence of AGNs as much as possible, we find that, regardless of whether it is within a fixed stellar mass bin, ETD galaxies have higher concentration index and lower sSFR, compared to LTD galaxies. This suggests that ETD galaxies possess the more concentrated morphologies and the more rapid star formation quenching.
Considering the external process to the galaxy star formation quenching, we also compare the environment surrounding the targeted ETD galaxies to that of LTD galaxies and find that there is no significant difference of environment between them. This hints that the environment may not be a dominated factor of quenching the star formation of massive () GV galaxies at .
Excluding the effect of the external process of the environment, the MQ on the star formation then becomes more important qualitatively. To quantify it, we define a morphology quenching efficiency , a dimensionless parameter, to measure the correlation between morphology and star formation. Regardless of the stellar mass and redshift, when the difference between the mean SFRs of ETD and LTD galaxies is about 0.7 , the fraction of 0.2 is much higher than 90%, which might suggest that the level of MQ in GV galaxies might be described by 0.2.
References
- Abraham et al. (1994) Abraham, R. G., Valdes, F., Yee, H. K. C., & van den Bergh, S. 1994, ApJ, 432, 75
- Abraham et al. (2007) Abraham, R. G., Nair, P., McCarthy, P. J., et al. 2007, ApJ, 669, 184
- Balogh et al. (2004) Balogh, M., Eke, V., Miller, C., et al. 2004, MNRAS, 348, 1355
- Barazza et al. (2008) Barazza, F. D., Jogee, S., & Marinova, I. 2008, ApJ, 675, 1194
- Barro et al. (2013) Barro, G., Faber, S. M., Pérez-González, P. G., et al. 2013, ApJ, 765, 104
- Barro et al. (2017) Barro, G., Faber, S. M., Koo, D. C., et al. 2017, ApJ, 840, 47
- Bell et al. (2004) Bell, E. F., Wolf, C., Meisenheimer, K., et al. 2004, ApJ, 608, 752
- Bell et al. (2005) Bell, E. F., Papovich, C., Wolf, C., et al. 2005, ApJ, 625, 23
- Blanton et al. (2003a) Blanton, M. R., Hogg, D. W., Bahcall, N. A., et al. 2003a, ApJ, 594, 186
- Bluck et al. (2014) Bluck, A. F. L., Mendel, J. T., Ellison, S. L., et al. 2014, MNRAS, 441, 599
- Bornancini et al. (2017) Bornancini, C. G., Taormina, M. S., & Lambas, D. G. 2017, A&A, 605, A10
- Brammer et al. (2008) Brammer, G. B., van Dokkum, P. G., & Coppi, P. 2008, ApJ, 686, 1503
- Brammer et al. (2009) Brammer, G. B., Whitaker, K. E., van Dokkum, P. G., et al. 2009, ApJ, 706, L173
- Brennan et al. (2017) Brennan, R., Pandya, V., Somerville, R. S., et al. 2017, MNRAS, 465, 619
- Bruzual & Charlot (2003) Bruzual, G., & Charlot, S. 2003, MNRAS, 344, 1000
- Cai et al. (2013) Cai, Z.-Y., Lapi, A., Xia, J.-Q., et al. 2013, ApJ, 768, 21
- Calzetti et al. (2000) Calzetti, D., Armus, L., Bohlin, R. C., et al. 2000, ApJ, 533, 682
- Chabrier (2003) Chabrier, G. 2003, PASP, 115, 763
- Chang et al. (2017) Chang, Y.-Y., Le Floc’h, E., Juneau, S., et al. 2017, MNRAS, 466, L103
- Chartab et al. (2020) Chartab, N., Mobasher, B., Darvish, B., et al. 2020, ApJ, 890, 7
- Chauke et al. (2019) Chauke, P., van der Wel, A., Pacifici, C., et al. 2019, ApJ, 877, 48
- Cirasuolo et al. (2007) Cirasuolo, M., McLure, R. J., Dunlop, J. S., et al. 2007, MNRAS, 380, 585
- Cooper et al. (2008) Cooper, M. C., Newman, J. A., Weiner, B. J., et al. 2008, MNRAS, 383, 1058
- Cowan & Ivezić (2008) Cowan, N. B., & Ivezić, Ž. 2008, ApJ, 674, L13
- Cowie et al. (1996) Cowie, L. L., Songaila, A., Hu, E. M., & Cohen, J. G. 1996, AJ, 112, 839
- Crocce et al. (2010) Crocce, M., Fosalba, P., Castander, F. J., & Gaztañaga, E. 2010, MNRAS, 403, 1353
- Crocker et al. (2009) Crocker, A. F., Jeong, H., Komugi, S., et al. 2009, MNRAS, 393, 1255
- Dale & Helou (2002) Dale, D. A., & Helou, G. 2002, ApJ, 576, 159
- Darvish et al. (2016) Darvish, B., Mobasher, B., Sobral, D., et al. 2016, ApJ, 825, 113
- Dekel et al. (2009) Dekel, A., Sari, R., & Ceverino, D. 2009, ApJ, 703, 785
- Donley et al. (2012) Donley, J. L., Koekemoer, A. M., Brusa, M., et al. 2012, ApJ, 748, 142
- Donovan et al. (2009) Donovan, J. L., Serra, P., van Gorkom, J. H., et al. 2009, AJ, 137, 5037
- Dressler (1980) Dressler, A. 1980, ApJ, 236, 351
- Elbaz et al. (2007) Elbaz, D., Daddi, E., Le Borgne, D., et al. 2007, A&A, 468, 33
- Faber et al. (2007) Faber, S. M., Willmer, C. N. A., Wolf, C., et al. 2007, ApJ, 665, 265
- Fang et al. (2015) Fang, G., Ma, Z., Kong, X., & Fan, L. 2015, ApJ, 807, 139
- Fang et al. (2013) Fang, J. J., Faber, S. M., Koo, D. C., & Dekel, A. 2013, ApJ, 776, 63
- Fang et al. (2012) Fang, J. J., Faber, S. M., Salim, S., Graves, G. J., & Rich, R. M. 2012, ApJ, 761, 23
- Fang et al. (2018) Fang, J. J., Faber, S. M., Koo, D. C., et al. 2018, ApJ, 858, 100
- Fragkoudi et al. (2016) Fragkoudi, F., Athanassoula, E., & Bosma, A. 2016, MNRAS, 462, L41
- Franx et al. (2008) Franx, M., van Dokkum, P. G., Förster Schreiber, N. M., et al. 2008, ApJ, 688, 770
- Galametz et al. (2018) Galametz, A., Pentericci, L., Castellano, M., et al. 2018, MNRAS, 475, 4148
- Ge et al. (2020) Ge, X., Liu, F.-S., Gu, Q.-S., Contini, E., & Gu, Y.-Z. 2020, Research in Astronomy and Astrophysics, 20, 116
- Gensior et al. (2020) Gensior, J., Kruijssen, J. M. D., & Keller, B. W. 2020, MNRAS, 495, 199
- Gonçalves et al. (2012) Gonçalves, T. S., Martin, D. C., Menéndez-Delmestre, K., Wyder, T. K., & Koekemoer, A. 2012, ApJ, 759, 67
- Graves et al. (2009) Graves, G. J., Faber, S. M., & Schiavon, R. P. 2009, ApJ, 693, 486
- Grogin et al. (2011) Grogin, N. A., Kocevski, D. D., Faber, S. M., et al. 2011, ApJS, 197, 35
- Gu et al. (2018) Gu, Y., Fang, G., Yuan, Q., Cai, Z., & Wang, T. 2018, ApJ, 855, 10
- Gu et al. (2020) Gu, Y., Fang, G., Yuan, Q., & Lu, S. 2020, PASP, 132, 054101
- Gu et al. (2019) Gu, Y., Fang, G., Yuan, Q., et al. 2019, ApJ, 884, 172
- Guo et al. (2017) Guo, Y., Bell, E. F., Lu, Y., et al. 2017, ApJ, 841, L22
- Hogg et al. (2002) Hogg, D. W., Blanton, M., Strateva, I., et al. 2002, AJ, 124, 646
- Huertas-Company et al. (2015b) Huertas-Company, M., Gravet, R., Cabrera-Vives, G., et al. 2015b, ApJS, 221, 8
- Ivezić et al. (2005) Ivezić, Ž., Vivas, A. K., Lupton, R. H., & Zinn, R. 2005, AJ, 129, 1096
- Kauffmann et al. (2004) Kauffmann, G., White, S. D. M., Heckman, T. M., et al. 2004, MNRAS, 353, 713
- Kauffmann et al. (2003b) Kauffmann, G., Heckman, T. M., White, S. D. M., et al. 2003b, MNRAS, 341, 54
- Koekemoer et al. (2011) Koekemoer, A. M., Faber, S. M., Ferguson, H. C., et al. 2011, ApJS, 197, 36
- Kong et al. (2009) Kong, X., Fang, G., Arimoto, N., & Wang, M. 2009, ApJ, 702, 1458
- Kormendy & Kennicutt (2004) Kormendy, J., & Kennicutt, Robert C., J. 2004, ARA&A, 42, 603
- Koyama et al. (2019) Koyama, S., Koyama, Y., Yamashita, T., et al. 2019, ApJ, 874, 142
- Kriek et al. (2009) Kriek, M., van Dokkum, P. G., Labbé, I., et al. 2009, ApJ, 700, 221
- Kroupa (2001) Kroupa, P. 2001, MNRAS, 322, 231
- Lacy et al. (2007) Lacy, M., Petric, A. O., Sajina, A., et al. 2007, AJ, 133, 186
- Lacy et al. (2004) Lacy, M., Storrie-Lombardi, L. J., Sajina, A., et al. 2004, ApJS, 154, 166
- Lang et al. (2014) Lang, P., Wuyts, S., Somerville, R. S., et al. 2014, ApJ, 788, 11
- Lee et al. (2015) Lee, S.-K., Im, M., Kim, J.-W., et al. 2015, ApJ, 810, 90
- Lilly & Carollo (2016) Lilly, S. J., & Carollo, C. M. 2016, ApJ, 833, 1
- Lin et al. (2021) Lin, X., Fang, G., Xue, Y., Fan, L., & Kong, X. 2021, arXiv e-prints, arXiv:2103.04631
- Lisker (2008) Lisker, T. 2008, ApJS, 179, 319
- Lotz et al. (2004) Lotz, J. M., Primack, J., & Madau, P. 2004, AJ, 128, 163
- Lu et al. (2020) Lu, S., Gu, Y., Fang, G., et al. 2020, arXiv e-prints, arXiv:2006.06223
- Luo et al. (2017) Luo, B., Brandt, W. N., Xue, Y. Q., et al. 2017, ApJS, 228, 2
- Maraston (2005) Maraston, C. 2005, MNRAS, 362, 799
- Martig et al. (2009) Martig, M., Bournaud, F., Teyssier, R., & Dekel, A. 2009, ApJ, 707, 250
- Martin et al. (2007) Martin, D. C., Wyder, T. K., Schiminovich, D., et al. 2007, ApJS, 173, 342
- McPartland et al. (2019) McPartland, C., Sanders, D. B., Kewley, L. J., & Leslie, S. K. 2019, MNRAS, 482, L129
- Morganti et al. (2006) Morganti, R., de Zeeuw, P. T., Oosterloo, T. A., et al. 2006, MNRAS, 371, 157
- Newman et al. (2012) Newman, A. B., Ellis, R. S., Bundy, K., & Treu, T. 2012, ApJ, 746, 162
- Noeske et al. (2007) Noeske, K. G., Faber, S. M., Weiner, B. J., et al. 2007, ApJ, 660, L47
- Pandya et al. (2017) Pandya, V., Brennan, R., Somerville, R. S., et al. 2017, MNRAS, 472, 2054
- Papovich et al. (2010) Papovich, C., Momcheva, I., Willmer, C. N. A., et al. 2010, ApJ, 716, 1503
- Parkash et al. (2018) Parkash, V., Brown, M. J. I., Jarrett, T. H., & Bonne, N. J. 2018, ApJ, 864, 40
- Patel et al. (2009) Patel, S. G., Holden, B. P., Kelson, D. D., Illingworth, G. D., & Franx, M. 2009, ApJ, 705, L67
- Peng et al. (2010) Peng, Y.-j., Lilly, S. J., Kovač, K., et al. 2010, ApJ, 721, 193
- Phillipps et al. (2019) Phillipps, S., Bremer, M. N., Hopkins, A. M., et al. 2019, MNRAS, 485, 5559
- Rangel et al. (2014) Rangel, C., Nandra, K., Barro, G., et al. 2014, MNRAS, 440, 3630
- Reed et al. (2007) Reed, D. S., Bower, R., Frenk, C. S., Jenkins, A., & Theuns, T. 2007, MNRAS, 374, 2
- Salim & Rich (2010) Salim, S., & Rich, R. M. 2010, ApJ, 714, L290
- Salim et al. (2007) Salim, S., Rich, R. M., Charlot, S., et al. 2007, ApJS, 173, 267
- Schawinski et al. (2007) Schawinski, K., Thomas, D., Sarzi, M., et al. 2007, MNRAS, 382, 1415
- Schawinski et al. (2014) Schawinski, K., Urry, C. M., Simmons, B. D., et al. 2014, MNRAS, 440, 889
- Schiminovich et al. (2007) Schiminovich, D., Wyder, T. K., Martin, D. C., et al. 2007, ApJS, 173, 315
- Schreiber et al. (2016) Schreiber, C., Elbaz, D., Pannella, M., et al. 2016, A&A, 589, A35
- Scoville et al. (2013) Scoville, N., Arnouts, S., Aussel, H., et al. 2013, ApJS, 206, 3
- Sheth et al. (2005) Sheth, K., Vogel, S. N., Regan, M. W., Thornley, M. D., & Teuben, P. J. 2005, ApJ, 632, 217
- Sheth et al. (2001) Sheth, R. K., Mo, H. J., & Tormen, G. 2001, MNRAS, 323, 1
- Skelton et al. (2014) Skelton, R. E., Whitaker, K. E., Momcheva, I. G., et al. 2014, ApJS, 214, 24
- Stern et al. (2005) Stern, D., Eisenhardt, P., Gorjian, V., et al. 2005, ApJ, 631, 163
- Strateva et al. (2001) Strateva, I., Ivezić, Ž., Knapp, G. R., et al. 2001, AJ, 122, 1861
- Su et al. (2019) Su, K.-Y., Hopkins, P. F., Hayward, C. C., et al. 2019, MNRAS, 487, 4393
- Thilker et al. (2010) Thilker, D. A., Bianchi, L., Schiminovich, D., et al. 2010, ApJ, 714, L171
- Thomas et al. (2010) Thomas, D., Maraston, C., Schawinski, K., Sarzi, M., & Silk, J. 2010, MNRAS, 404, 1775
- Tinker et al. (2008) Tinker, J., Kravtsov, A. V., Klypin, A., et al. 2008, ApJ, 688, 709
- Toomre & Toomre (1972) Toomre, A., & Toomre, J. 1972, ApJ, 178, 623
- van der Wel et al. (2014) van der Wel, A., Franx, M., van Dokkum, P. G., et al. 2014, ApJ, 788, 28
- Wang et al. (2012) Wang, T., Huang, J.-S., Faber, S. M., et al. 2012, ApJ, 752, 134
- Wang et al. (2017) Wang, T., Elbaz, D., Alexander, D. M., et al. 2017, A&A, 601, A63
- Watson et al. (2013) Watson, W. A., Iliev, I. T., D’Aloisio, A., et al. 2013, MNRAS, 433, 1230
- Wellons et al. (2015) Wellons, S., Torrey, P., Ma, C.-P., et al. 2015, MNRAS, 449, 361
- Whitaker et al. (2014) Whitaker, K. E., Franx, M., Leja, J., et al. 2014, ApJ, 795, 104
- Whitaker et al. (2015) Whitaker, K. E., Franx, M., Bezanson, R., et al. 2015, ApJ, 811, L12
- Woo et al. (2013) Woo, J., Dekel, A., Faber, S. M., et al. 2013, MNRAS, 428, 3306
- Wuyts et al. (2008) Wuyts, S., Labbé, I., Förster Schreiber, N. M., et al. 2008, ApJ, 682, 985
- Wuyts et al. (2011a) Wuyts, S., Förster Schreiber, N. M., Lutz, D., et al. 2011a, ApJ, 738, 106
- Wuyts et al. (2011b) Wuyts, S., Förster Schreiber, N. M., van der Wel, A., et al. 2011b, ApJ, 742, 96
- Xue et al. (2016) Xue, Y. Q., Luo, B., Brandt, W. N., et al. 2016, ApJS, 224, 15
- Xue et al. (2011) —. 2011, ApJS, 195, 10
- Young et al. (2009) Young, L. M., Bendo, G. J., & Lucero, D. M. 2009, AJ, 137, 3053
- Zurita et al. (2004) Zurita, A., Relaño, M., Beckman, J. E., & Knapen, J. H. 2004, A&A, 413, 73