marginparsep has been altered.
topmargin has been altered.
marginparwidth has been altered.
marginparpush has been altered.
The page layout violates the ICML style.
Please do not change the page layout, or include packages like geometry,
savetrees, or fullpage, which change it for you.
We’re not able to reliably undo arbitrary changes to the style. Please remove
the offending package(s), or layout-changing commands and try again.
Tackling the Overestimation of Forest Carbon
with Deep Learning on Aerial Imagery
Anonymous Authors1
Preprint. Work in progress.
Abstract
Forest carbon offsets are increasingly popular and can play a significant role in financing climate mitigation, forest conservation, and reforestation. Measuring how much carbon is stored in forests is, however, still largely done via expensive, time-consuming, and sometimes unaccountable field measurements. To overcome these limitations, many verification bodies are leveraging machine learning (ML) algorithms to estimate forest carbon from satellite or aerial imagery. Aerial imagery allows for tree species or family classification, which improves on the satellite imagery-based forest type classification. However, aerial imagery is significantly more expensive to collect and it is unclear by how much the higher resolution improves the forest carbon estimation. In this proposal paper, we describe the first systematic comparison of forest carbon estimation from aerial imagery, satellite imagery, and “ground-truth“ field measurements via deep learning-based algorithms for a tropical reforestation project. Our initial results show that forest carbon estimates from satellite imagery can overestimate aboveground biomass by up to 10-times for tropical reforestation projects. The significant difference between aerial and satellite-derived forest carbon measurements shows the potential for aerial imagery-based ML algorithms and raises the importance to extend this study to a global benchmark between options for carbon measurements.
1 Introduction
The deterioration of the natural world is unparalleled in human history and a key driver of the climate crisis. Since 2000, we have lost 361 million ha of forest cover (the size of Europe) (Hansen et al., 2013) accounting for 18% of global anthropogenic emissions IPCC (2019). The causes of deforestation are mostly economically driven and major conservation efforts are underway to mitigate and safeguard against these losses.
Carbon offsets are a way of financing and trading on the capture of carbon for businesses and governments. The carbon offsetting market is expected to grow by a factor of 100 until 2050 and demand is rapidly increasing Blaufelder et al. .
Recent investigations Badgley et al. (2021); West et al. (2020) have shown that the current manual practices systematically overestimate forestry carbon offsetting projects with up to 29% of the offsets analyzed, totaling up to 30 million tCO2e and worth approximately $410 million. There is thus a need for higher quality carbon offsetting protocols and higher transparency and accountability in the monitoring, reporting, and verification (MRV) of these projects Haya et al. (2020).
Several verification bodies and academic environments are currently developing remote sensing technologies to automate parts of the certification process of forestry carbon offsetting projects Narine et al. (2020); Dao et al. (2019). Remote sensing through satellite or aerial imagery and lidar combined with ML models can be used to estimate carbon stock baselines and additionality, and for MRV of projects. Compared to current manual estimates, these advancements reduce time and cost and increase transparency and accountability, thus lowering the threshold for forest owners and buyers to enter the market Lütjens et al. (2019).
Satellite imagery is increasing in quality and availability and combined with state-of-the-art deep learning, promises to soon map every tree on earth Hanan & Anchang (2020) and carbon stock globally Saatchi et al. (2011). Nevertheless, these algorithms risk additionally contributing to the systematic overestimation of carbon stocks, not reducing it.
2 Quantifying the difference in forest carbon stock estimations and field measurements
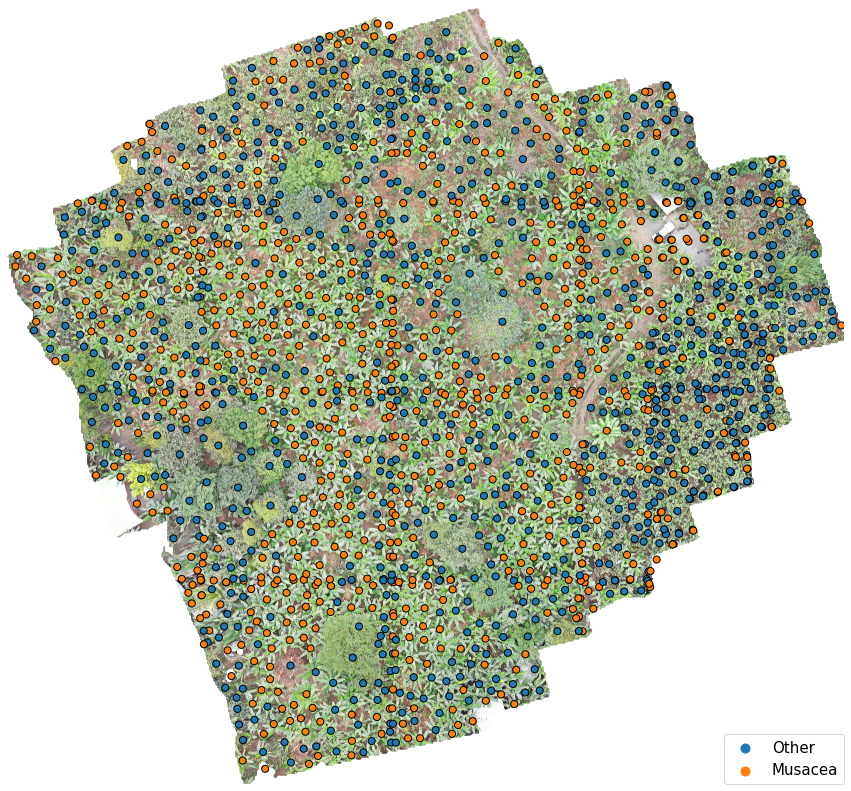
To quantify the difference between the estimated forest carbon stock taken from available remote sensing products, we propose a study of field measurements of six cacao agro-forestry sites in the central coastal region of Ecuador eligible for carbon offsetting certification collected in 2020. See Table 1 for information on each site. By mapping field measurements to trees instances from drone imagery, an end-to-end deep learning-based carbon stock estimations can be done for each individual tree as seen in Figure 2 in the Appendix. Calculating the carbon stock at an individual tree level increases the accuracy of the estimations as it allows both species Schiefer et al. (2020) and metrics Omasa et al. (2003) to be detected.
| Site | No. of | No. of | Plot | AGB |
|---|---|---|---|---|
| no. | Trees | Species | Area | density |
| 1 | 743 | 18 | 0.53 | 19 |
| 2 | 929 | 22 | 0.47 | 27 |
| 3 | 846 | 16 | 0.48 | 24 |
| 4 | 789 | 20 | 0.51 | 24 |
| 5 | 484 | 12 | 0.56 | 17 |
| 6 | 872 | 14 | 0.62 | 29 |
| Site | Ground | Filtered | Over |
|---|---|---|---|
| no. | Truth | estimation | |
| 1 | 19 | 176 | 9.2 |
| 2 | 27 | 160 | 5.9 |
| 3 | 24 | 47 | 2.0 |
| 4 | 24 | 62 | 2.6 |
| 5 | 17 | 19 | 1.1 |
| 6 | 29 | 141 | 4.9 |
2.1 Data
Field measurements were taken manually for all live trees and bushes within the site polygon and include GPS location, species, and diameter at breast height (DBH). Drone imagery was captured by an RGB camera from a Mavic 2 Pro drone in 2020. Each site is around 0.5 ha, mainly containing banana trees (Musaceae) and cocoa plants (Cocoa). The aboveground biomass (AGB) is calculated using published allometric equations for tropical agro-forestry, namely fruit trees 1 Segura et al. (2006), banana trees 2 Van Noordwijk et al. (2002), cacao 3 Yuliasmara et al. (2009), and shade trees (timber) 4 Brown & Iverson (1992). These are commonly used in global certification standards.
| (1) |
| (2) |
| (3) |
| (4) |
We used the Global Forest Watch (GFW)’s aboveground live woody biomass density dataset as a comparison Global Forest Watch (2019). It is a global map of AGB and carbon density at 30m x 30m resolution for the year 2000. It is based on more than 700.000 quality-filtered Geoscience Laser Altimeter System (GLAS) lidar observations using machine learning models based on allometric equations for the different regions and vegetation types.
2.2 Approach
For each site, we computed the total AGB from the field measurements and the allometric equations. We compare this ground truth with the estimate obtained from GFW for the same location.
-
•
Ground Truth: Total AGB values from field measurements divided by the area of the site.
-
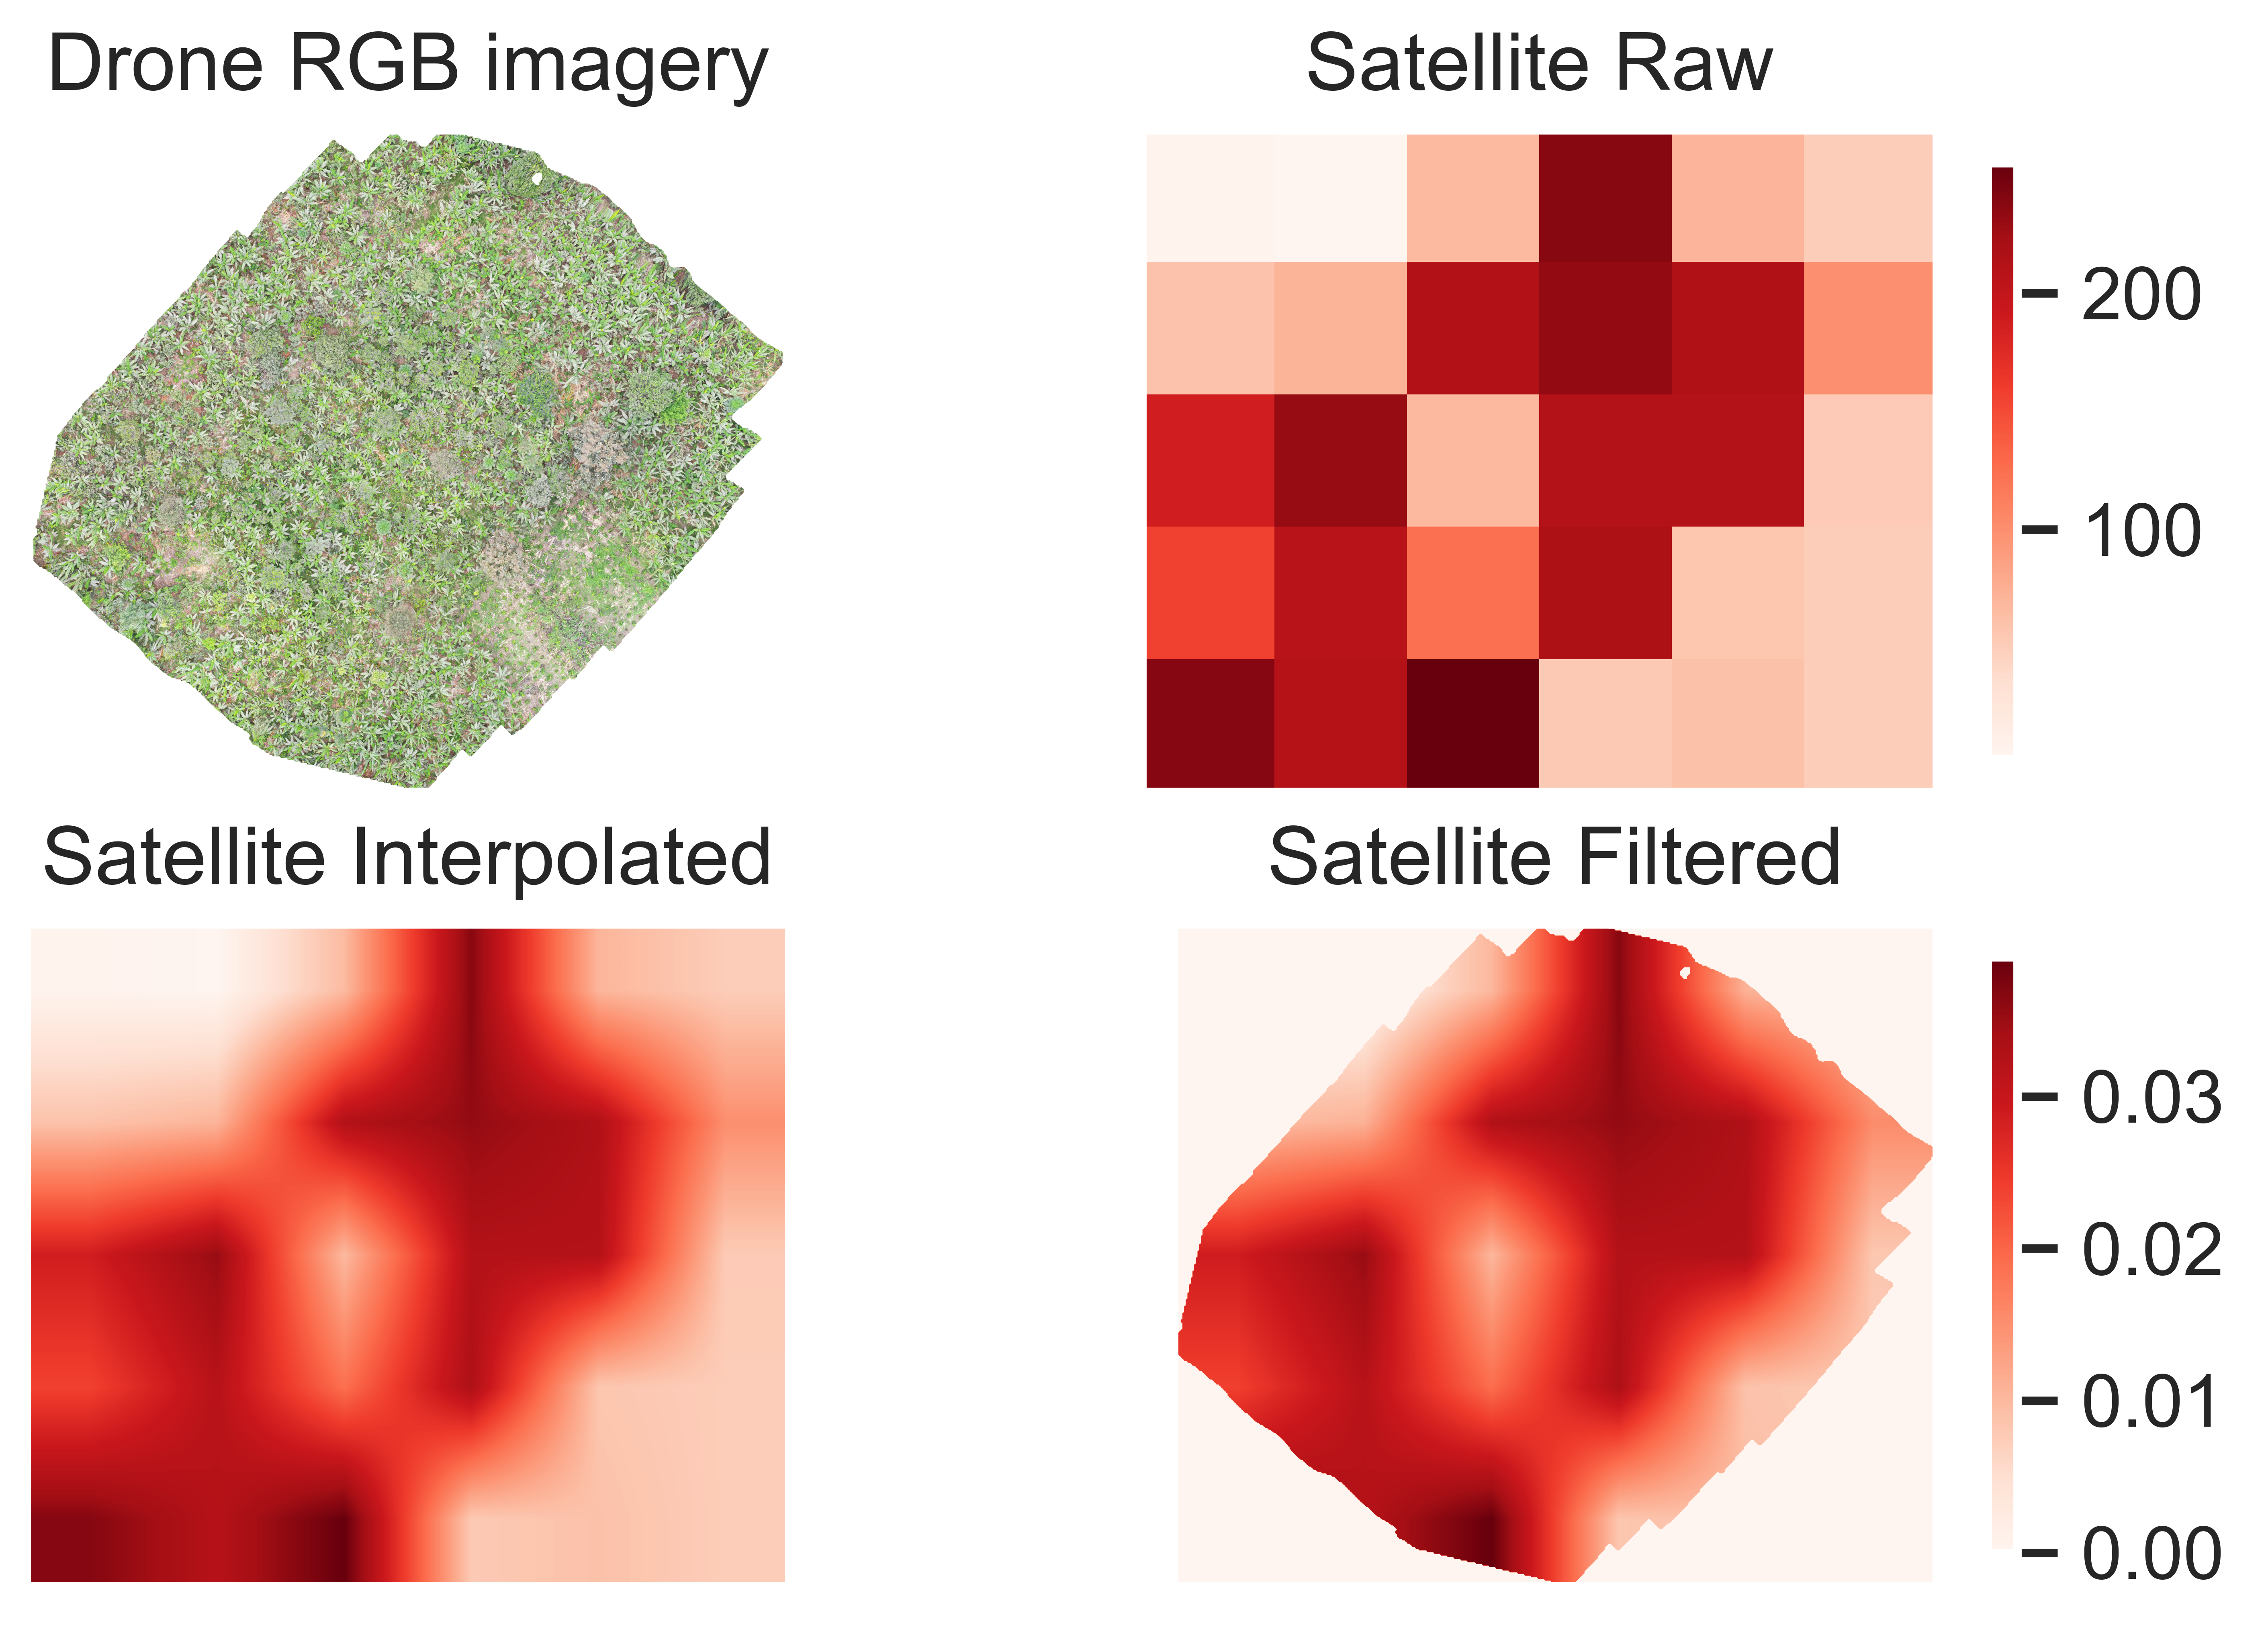
•
Filtered: The AGB density cubically interpolated to the resolution of the drone imagery and filtered on its polygon.
Comparing the AGB density estimations in tonnes AGB per hectare for each site in Table 2 we see that for all plots the satellite-based estimates significantly overestimate the AGB density in the plots, despite their relatively high resolution of 30m x 30m. Drone imagery (1cm/px) combined with convolutional neural networks (CNN) have previously been used to directly estimate biomass and carbon stock in individual trees Jones et al. (2020) or indirectly by detecting species or tree metrics such as DBH or H Nåfält (2018) Schiefer et al. (2020), achieving an accuracy similar to manual field measurements. We propose an end-to-end carbon stock estimation at the individual tree level by leveraging multi-fusion approaches Du & Zare (2020) Zhang (2010) (e.g. combining low-resolution satellite, high-resolution drone imagery, and field measurements or contextual data) and multi-task learning Crawshaw (2020) (e.g. tree metrics and carbon storage factors as auxiliary tasks).
3 Conclusion
There is great potential in combining remote sensing and ML to increase the quality of MRV of forestry carbon offsets and to play a key role in is scaling natural carbon sequestration at the speed necessary to mitigate climate change. However, in this proposal, we identify and highlight the need to audit the algorithms and data used to avoid systematic wrong estimations by quantifying its current gap. We propose to leverage current advancements in remote sensing and ML when creating new automated carbon offset certification protocols, starting with high-resolution data combined with field measurements as benchmarks.
Acknowledgments
The authors are thankful for the guidance and advice by academic collaborators (Prof. Tom Crowther, Prof. Dava Newman, Simeon Max, Kenza Amara), non-governmental institutions (WWF Switzerland, Restor), and support from the local community in Ecuador.
References
- Badgley et al. (2021) Badgley, G., Freeman, J., Hamman, J. J., Haya, B., Trugman, A. T., Anderegg, W. R., and Cullenward, D. Systematic over-crediting in california’s forest carbon offsets program. bioRxiv, 2021. doi: 10.1101/2021.04.28.441870.
- (2) Blaufelder, C., Levy, C., Mannion, P., Pinner, D., and Weterings, J. A blueprint for scaling voluntary carbon markets to meet the climate challenge. https://www.mckinsey.com/business-functions/sustainability/our-insights. Accessed: 2020-05-31.
- Brown & Iverson (1992) Brown, S. and Iverson, L. Biomass estimates for tropical forest. World Res. Rev., 4:366–383, 01 1992.
- Crawshaw (2020) Crawshaw, M. Multi-task learning with deep neural networks: A survey. 9 2020. URL http://arxiv.org/abs/2009.09796.
- Dao et al. (2019) Dao, D., Cang, C., Fung, C., Zhang, M., Pawlowski, N., Gonzales, R., Beglinger, N., and Zhang, C. GainForest: Scaling Climate Finance for Forest Conservation using Interpretable Machine Learning on Satellite Imagery. ICML Climate Change AI workshop 2019, 2019.
- Du & Zare (2020) Du, X. and Zare, A. Multiresolution multimodal sensor fusion for remote sensing data with label uncertainty. IEEE Transactions on Geoscience and Remote Sensing, 58, 4 2020. ISSN 0196-2892. doi: 10.1109/TGRS.2019.2955320.
- Global Forest Watch (2019) Global Forest Watch. Aboveground live woody biomass density, 2019. URL https://www.globalforestwatch.org.
- Hanan & Anchang (2020) Hanan, N. P. and Anchang, J. Y. Satellites could soon map every tree on earth. Nature, 587, 11 2020. ISSN 0028-0836. doi: 10.1038/d41586-020-02830-3.
- Hansen et al. (2013) Hansen, M. C., Potapov, P. V., Moore, R., Hancher, M., Turubanova, S. A., Tyukavina, A., Thau, D., Stehman, S. V., Goetz, S. J., Loveland, T. R., Kommareddy, A., Egorov, A., Chini, L., Justice, C. O., and Townshend, J. R. G. High-resolution global maps of 21st-century forest cover change. Science, 342(6160):850–853, 2013.
- Haya et al. (2020) Haya, B., Cullenward, D., Strong, A. L., Grubert, E., Heilmayr, R., Sivas, D. A., and Wara, M. Managing uncertainty in carbon offsets: insights from california’s standardized approach. Climate Policy, 20(9):1112–1126, 2020. doi: 10.1080/14693062.2020.1781035. URL https://doi.org/10.1080/14693062.2020.1781035.
- IPCC (2019) IPCC. 2019: Summary for policymakers. In Shukla, P., Skea, J., Buendia, E. C., Masson-Delmotte, V., Pörtner, H.-O., Roberts, D. C., Zhai, P., Slade, R., Connors, S., van Diemen, R., Ferrat, M., Haughey, E., Luz, S., Neogi, S., Pathak, M., Petzold, J., Pereira, J. P., Vyas, P., Huntley, E., Kissick, K., Belkacemi, M., and Malley, J. (eds.), Climate Change and Land: an IPCC special report on climate change, desertification, land degradation, sustainable land management, food security, and greenhouse gas fluxes in terrestrial ecosystems, pp. 7–11. 2019.
- Jones et al. (2020) Jones, A. R., Raja Segaran, R., Clarke, K. D., Waycott, M., Goh, W. S. H., and Gillanders, B. M. Estimating mangrove tree biomass and carbon content: A comparison of forest inventory techniques and drone imagery. Frontiers in Marine Science, 6:784, 2020. ISSN 2296-7745. doi: 10.3389/fmars.2019.00784. URL https://www.frontiersin.org/article/10.3389/fmars.2019.00784.
- Lütjens et al. (2019) Lütjens, B., Liebenwein, L., and Kramer, K. Machine Learning-based Estimation of Forest Carbon Stocks to increase Transparency of Forest Preservation Efforts. 2019 NeurIPS Workshop on Tackling Climate Change with Machine Learning, 2019.
- Narine et al. (2020) Narine, L. L., Popescu, S. C., and Malambo, L. Using icesat-2 to estimate and map forest aboveground biomass: A first example. Remote Sensing, 12(11), 2020. ISSN 2072-4292. URL https://www.mdpi.com/2072-4292/12/11/1824.
- Nåfält (2018) Nåfält, S. Estimating above ground biomass in a salix plantation using high resolution uav images, 2018. Student Paper.
- Omasa et al. (2003) Omasa, K., Qiu, G. Y., Watanuki, K., Yoshimi, K., and Akiyama, Y. Accurate estimation of forest carbon stocks by 3-d remote sensing of individual trees. Environmental Science & Technology, 37, 3 2003. ISSN 0013-936X. doi: 10.1021/es0259887.
- Saatchi et al. (2011) Saatchi, S. S., Harris, N. L., Brown, S., Lefsky, M., Mitchard, E. T. A., Salas, W., Zutta, B. R., Buermann, W., Lewis, S. L., Hagen, S., Petrova, S., White, L., Silman, M., and Morel, A. Benchmark map of forest carbon stocks in tropical regions across three continents. Proceedings of the National Academy of Sciences, 108(24):9899–9904, 2011. ISSN 0027-8424. doi: 10.1073/pnas.1019576108. URL https://www.pnas.org/content/108/24/9899.
- Schiefer et al. (2020) Schiefer, F., Kattenborn, T., Frick, A., Frey, J., Schall, P., Koch, B., and Schmidtlein, S. Mapping forest tree species in high resolution uav-based rgb-imagery by means of convolutional neural networks. ISPRS Journal of Photogrammetry and Remote Sensing, 170:205–215, 12 2020. doi: 10.1016/j.isprsjprs.2020.10.015.
- Segura et al. (2006) Segura, M., Kanninen, M., and Suárez, D. Allometric models for estimating aboveground biomass of shade trees and coffee bushes grown together. Agroforestry Systems, 68:143–150, Oct. 2006.
- Van Noordwijk et al. (2002) Van Noordwijk, M., Rahayu, S., Hairiah, K., Wulan, Y., Farida, A., and Verbist, B. Carbon stock assessment for a forest-to-coffee conversion landscape in sumber-jaya (lampung, indonesia): from allometric equations to land use change analysis. Science in China, 45, 10 2002.
- Weinstein et al. (2019) Weinstein, B. G., Marconi, S., Bohlman, S., Zare, A., and White, E. Individual tree-crown detection in rgb imagery using semi-supervised deep learning neural networks. Remote Sensing, 11(11):1309, 2019.
- West et al. (2020) West, T. A. P., Börner, J., Sills, E. O., and Kontoleon, A. Overstated carbon emission reductions from voluntary redd+ projects in the brazilian amazon. Proceedings of the National Academy of Sciences, 117(39):24188–24194, 2020. ISSN 0027-8424. doi: 10.1073/pnas.2004334117. URL https://www.pnas.org/content/117/39/24188.
- Yuliasmara et al. (2009) Yuliasmara, F., Wibawa, A., and Prawoto, A. Carbon stock in different ages and plantation system of cocoa: allometric approach. Pelita Perkebunan (a Coffee and Cocoa Research Journal), 26, 08 2009. doi: 10.22302/iccri.jur.pelitaperkebunan.v26i3.137.
- Zhang (2010) Zhang, J. Multi-source remote sensing data fusion: status and trends. International Journal of Image and Data Fusion, 1, 3 2010. ISSN 1947-9832. doi: 10.1080/19479830903561035.
Appendix A Appendix