mydate\THEDAY \monthname[\THEMONTH] \THEYEAR
Quantification of Captopril using Ultra High Performance Liquid Chromatography
Abstract
We develop an efficient, sensitive, accurate, cost effective, and greener liquid chromatography method for the determination of a quantification method concerning Captopril in pharmaceutical dosage forms by using ultra high performance liquid chromatography (UHPLC) equipment. Satisfactory resolution was able to be achieved using a Water Aquity UHPLC BEH C18 1.7 m 2.1 mm 50 mm column and an isocratic mobile phase composition of Methanol, Milli-Q water and Trifluoroacetic acid in the ratio of 55:45:0.05 v/v/v respectively at a flow rate of 0.1mL/min and a wavelength detection of 220nm. The retention time for Captopril was found to be 1.744 minutes while for Captopril disulfide it was found to be 2.657 minutes. The method was validated based on the ICH and USP guidelines.
pacs:
06.60.-c, 06.60.Mr, 06.90.+v, 07.90.+cI I. Introduction
Captopril (((2S)-1-[(2S)-2-Methyl-3-sulfanylpropanoyl] pyrrolidine-2- carboxylic acid), molecular formula C9H15NO3S is a popular well-known drug which subjects in the class of drugs called angiotensin-converting enzyme (ACE) inhibitors vidt1982captopril . Captopril is the first orally active inhibitor of ACE inhibitor in which the enzyme is responsible for the conversion of inactive angiotensin I to the potent pressor peptide angiotensin II vidt1982captopril . ACE inhibitors are mainly used for the treatment of high blood pressure but they also contain some other medical properties such as vasculo-protective and antithrombotic activities which plays a favourable role in terms of cardiovascular morbidity bojarska2015captopril . Captopril, has established a position in the medical treatment for hypertension and congestive heart failure amar2021captopril ; sigit2020comparison . Amongst the hypertension drugs, Captopril is a preferred drug amongst doctors, it is prescribed to patients who are chronically ill and require a long-term treatment, due to its therapeutic benefits and because of its effectiveness, low price and low toxicity vidt1982captopril ; brogden1988captopril ; captopril1988comparative ; amar2021captopril ; sigit2020comparison .
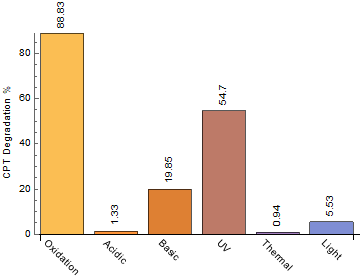
Captopril disulfide (1,1′-[Disulfanediylbis[(2S)-2-methyl-1-oxopropane3,1- diyl]] bis[(2S)-pyrrolidine-2-carboxylic] acid), molecular formula C18H28N2O6S2 is the major degradation impurity of Captopril vasconcelos2021structural . Captopril disulfide is also referred to as impurity A vasconcelos2021structural . The Captopril molecule starts to degrade after eight hours when in solution and also when being exposed to air by means of oxidation timmins1982factors ; hillaert1999determination . The Captopril molecule was analytically tested for stability under different stress conditions carje2019hplc . The stability testing was performed under various pH and temperature conditions, in the presence of strong oxidizing agents and under both natural light and ultra-violet (UV) light exposure, this was done in order to distinguish it from other types of impurities that may be present in the final product. Although approved in 1981 in the USA, Captopril is still widely used today national2018livertox .
The aim of this research is to develop a cost effective, efficient and a greener liquid chromatography method for the determination of Captopril in pharmaceutical dosage forms using shorter runs and using less mobile phase than conventional liquid chromatography methods.
I.1 Greener instrumental analytical chemistry
The use of UHPLC methods in pharmaceutical analysis while reducing the time for analysis of bathces for relese to patients and customers, decreases cost of testing. Much less solvents are used. In fact this study shows that a significant reduction of 75% of mobile phase is achieved compared to the USP method for Captopril USP . This means that the UHPLC method proposed is greener. UHPLC methods reduce energy consumption, reduce the use of solvents, and make waste management more manageable in terms of costs and environmental impacts cielecka2013uhplc .
The UHPLC method validated in this paper satisfies some of the principles of green analytical chemistry as described in galuszka201312 . In particular using UHPLC rather than a conventional HPLC method generates much less waste, reduces analysis time and the use of energy. The number of samples to test for assay in the pharmaceutical industry is determined according to guidelines such as the ICH guidelines guideline2005validation and good manufacturing practices (GMP) nally2016good .
II II. Materials and Methods
II.1 Materials and reagents
USP grade CPT, USP grade CPT-DIS, captopril tablets, and necessary reagents.
II.2 Apparatus
Waters Acquity UHPLC and Aquity UHPLC BEH C18 1.7m 2.1mm 50mm column. ACQUITY H-CLASS UHPLC.
II.3 Chromatographic conditions
Both the sample cooler temperature and the column oven temperature were set at 25∘C. The compounds were separated isocratically with a mobile phase composition of 550mL methanol (Carlo Erba. Gold Ultragradient grade), 450mL milli-Q water and 0.50mL trifluoroacetic acid (Fisher, 99% HPLC Grade) having a flow rate of 0.1mL/min with an injection volume of 0.8L. The wavelength detection for was set at 220nm.
II.4 Preparation of stock solutions for system suitability criteria
Captopril standard solution was prepared in duplicate, labelled as ‘standard solution 1’ and ‘standard solution 2’, by dissolving 10mg of Captopril reference standard in a 50mL volumetric flask. Dissolved and diluted up to volume using mobile phase, filtered through a 0.45m Millipore Millex-HV Hydrophilic PVDF Filter discarding the first 6mL of filtrate. This solution contains a concentration of 0.2mg/mL of Captopril API, prepared fresh on the day of use.
Captopril-disulfide solution was prepared by dissolving 25mg of CPT-Dis into a 50mL volumetric flask. Dissolved and diluted up to volume using mobile phase. This solution contains a concentration of 0.5mg/mL of Captopril-disulfide. Prepared fresh on the day of use.
Resolution solution was prepared by dissolving 10mg of Captopril reference standard into a 50mL volumetric flask. 5mL of Captopril disulfide solution (0.5mg/mL) was added together with sufficient mobile phase. Dissolved and diluted up to volume using mobile phase, filtered through a 0.45m Millipore Millex-HV Hydrophilic PVDF Filter discarding the first 6mL of filtrate. This solution contains a concentration of 0.2mg/mL of captopril API and 0.05mg/mL captopril disulfide, prepared fresh on the day of use.
II.5 Injection procedure
The UHPLC column was left to equilibrate with mobile phase, and blank runs were initially injected. These were followed by six repeated injections of Captopril ‘standard solution 1’ and a duplicate injection of ‘standard solution 2’. The resolution solution was injected afterwards. The six injections were used to determine the %RSD and to calculate the % recovery with the average area of the duplicate injection of ‘standard solution 2’. Resolution between Captopril and Captopril disulfide was determined and the tailing factor was recorded. Test solutions were bracketed with a duplicate injection of Captopril ‘standard solution 1’ and %RSD was calculated and compared with the six repeated injection of Captopril ‘standard solution 1’ for system suitability.
II.6 Sample preparation
The contents of 20 Captopril 100mg tablets were crushed and homogenized using a pestle and mortar. 96 mg of the Captopril crushed tablet sample were transferred to a 100mL volumetric flask. About 40mL of diluent were added, followed by sonication for 15 minutes. Dilution up to volume with diluent and filtration through a 0.45m Millipore Millex-HV Hydrophilic PVDF Filter followed, discarding the first 6mL of filtrate. The final test solution had a concentration of 0.2mg/mL of Captopril API.
III III. Results and Discussion
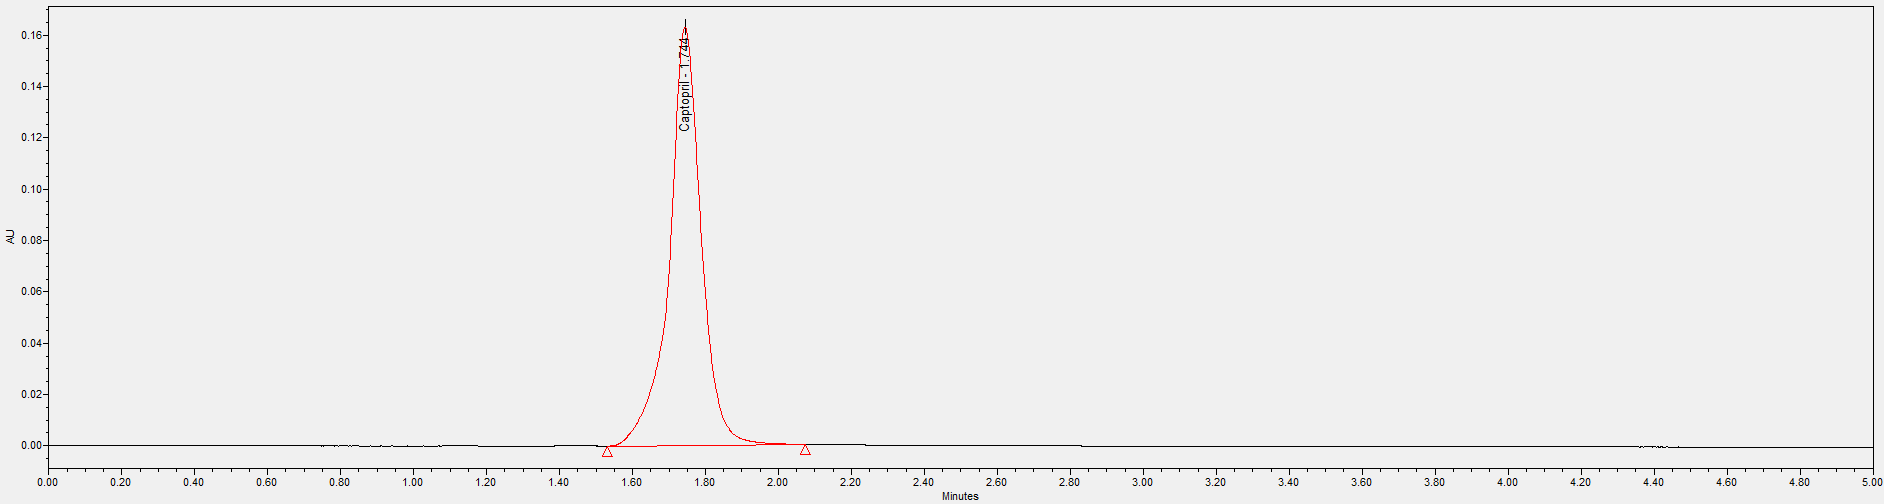
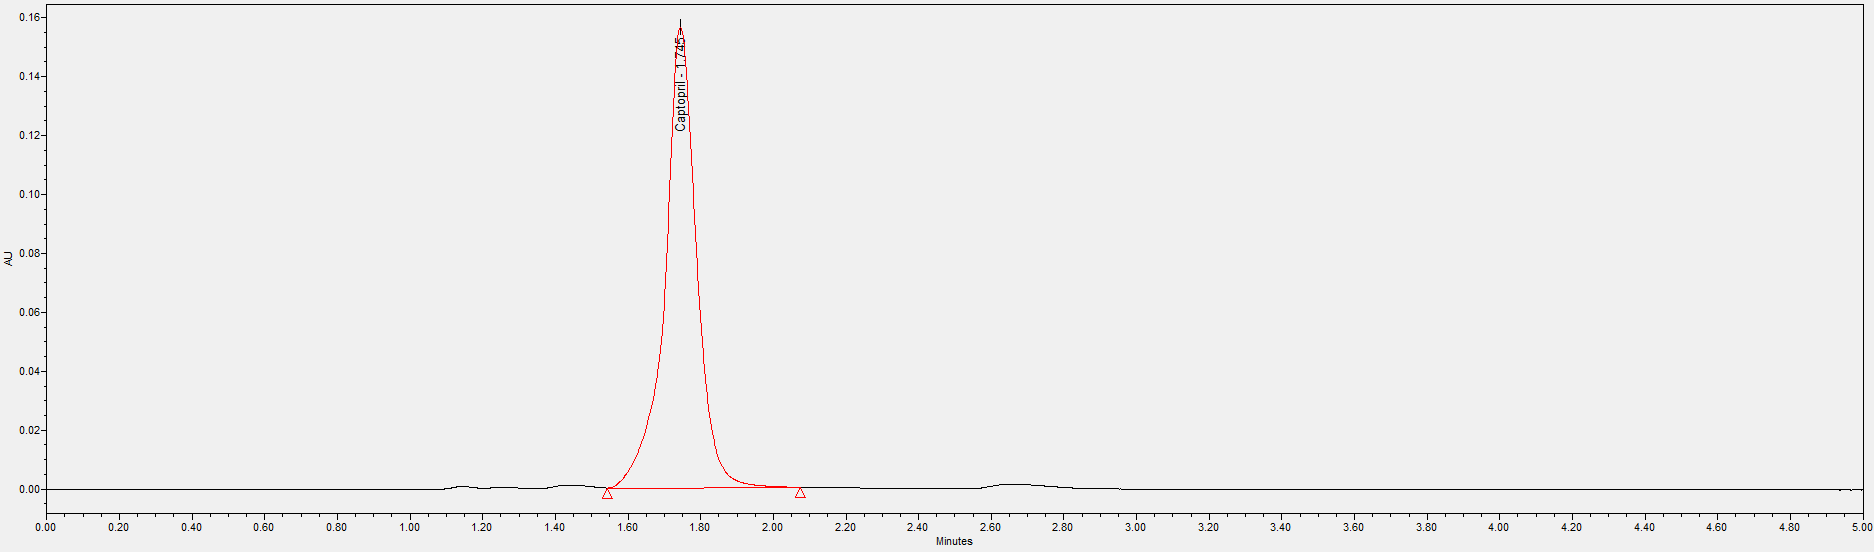
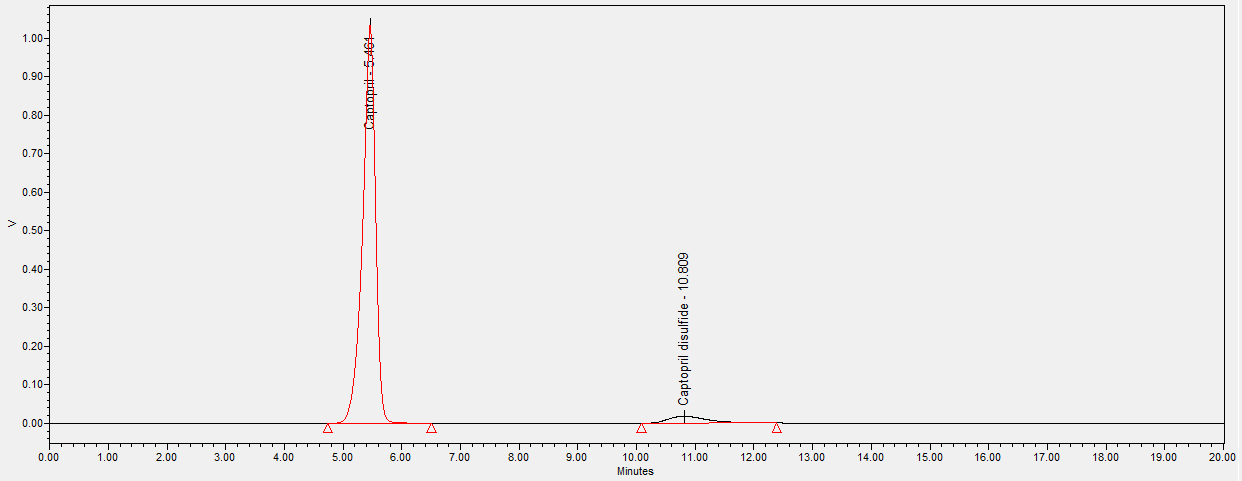
During this study trials were conducted in order to find the optimum chromatographic conditions. The objective of this study was to develop a chromatographic method, which is more environmentally friendly compared to an HPLC method, cost effective, yet following all regulations and achieving results according to the standards set out in ICH and USP guidelines. The chromatographic method was set to achieve a peak tailing factor between 0.8 and 1.2, a retention time between 1 to 2 minutes, along with a good resolution of 1.5. A relative standard deviation of 2.0% and a similarity factor between ‘standard 1’ and ‘standard 2’ injections between 98.0 and 102.0%. The peaks for Captopril molecule and its dimer, Captopril disulfide were well defined, resolved and free from tailing. The elution order was Captopril at 1.744 minutes and Captopril disulfide at 2.657 minutes for the UHPLC method developed, whilst for the USP HPLC method the elution order is Captopril at 5.461 minutes and Captopril disulfide at 10.809 minutes.
| System suitability parameters | ||
|---|---|---|
| Parameter | Limit | Result |
| Resolution of CPT with CPT-DIS | 1.5 | 4.3 |
| %RSD on 6 injections of STD 1 | 2.0% | 0.5% |
| Tailing factor | 0.8 - 1.2 | 0.9 |
| Bracketing check | 98.0 - 102.0% | 99.5 - 99.8% |
| Similarity factor STD 1 and STD 2 | 98.0 - 102.0% | 100.9% |
Running a single batch for analyses using the HPLC and UHPLC methods consist of 17 runs which includes; 2 blank injections at the beginning, 6 injections of ‘standard solution 1’, 2 injections of ‘standard solution 2’ followed by a single resolution injection. Then another 2 ‘standard solution 1’ injections, batch sample in duplicate and another 2 ‘standard solution 1’ injections to close off the bracketing of standards.
HPLC method: Running the above sample set, a mobile phase usage of 340mL for the analysis of one batch.
Developed UHPLC method: Running the same sample set using the UHPLC method parameters, a mobile phase usage of 8.5mL for the analysis of one batch.
On another note, the Captopril USP monograph declares that Captopril solutions have a stability of 8 hours, meaning that when using the conventional USP HPLC method only a total of 24 injections i.e., a maximum of 4 batch runs can be conducted when excluding the 2 blank injections at the beginning of the run. Whilst with the newly developed UHPLC method it is possible to run a total of 96 injections i.e., a maximum of 31 batches in a single 8-hour sample set, excluding the 2 blank injections at the beginning of the run. This clearly shows that the new greener UHPLC method is far more efficient and requires a much less solvent to carry out the quantification analysis.
| Comparing HPLC vs UHPLC method when conducting one batch of quantification analysis | |||
|---|---|---|---|
| Parameter | HPLC method | UHPLC method | Results in % |
| Run time (minutes) | 20 | 5 | UHPLC is 75% more efficient when compared to HPLC method |
| Mobile phase used (mL) | 340 | 8.5 | 97.5% less mobile phase was used for the UHPLC analysis |
| Batch runs that can be conducted within 8 hours for stability tests | ||
| HPLC method | UHPLC method | Percentage |
| 4 | 31 | 775% more batches for the UHPLC method |
IV IV. Method Validation Results
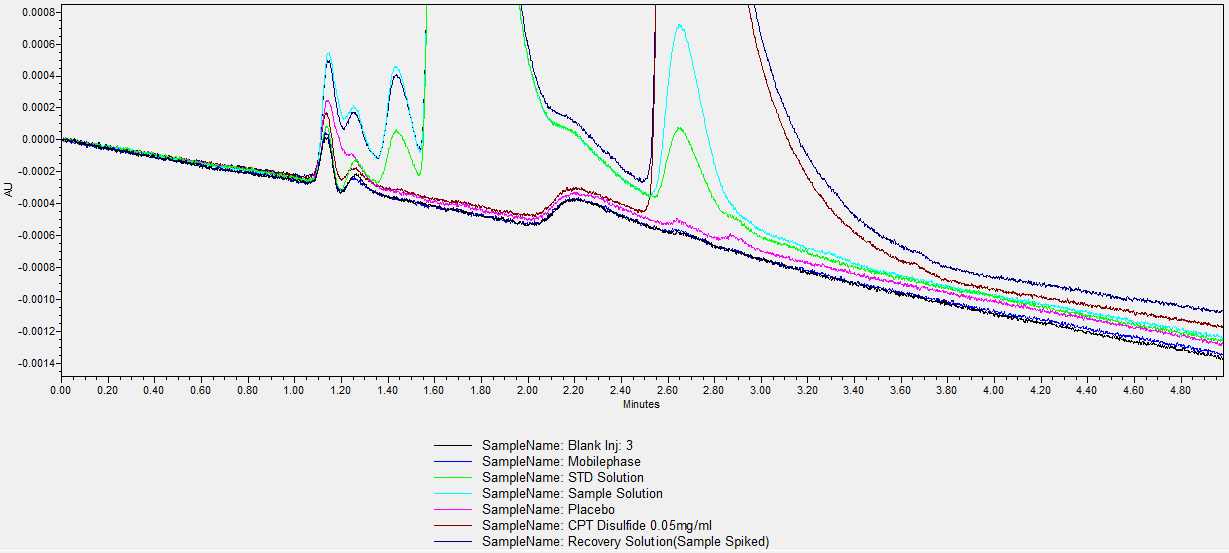
IV.1 Specificity
The specificity tests, for any interference found in the excipients (placebo), mobile phase, blank, and degradation impurity with the main analyte Captopril. As chromatograms were overlayed together the test is said to comply because there was no interference from excipients and degradant impurity Captopril disulfide with the main analyte of interest, Captopril, retention time 1.744 minutes.
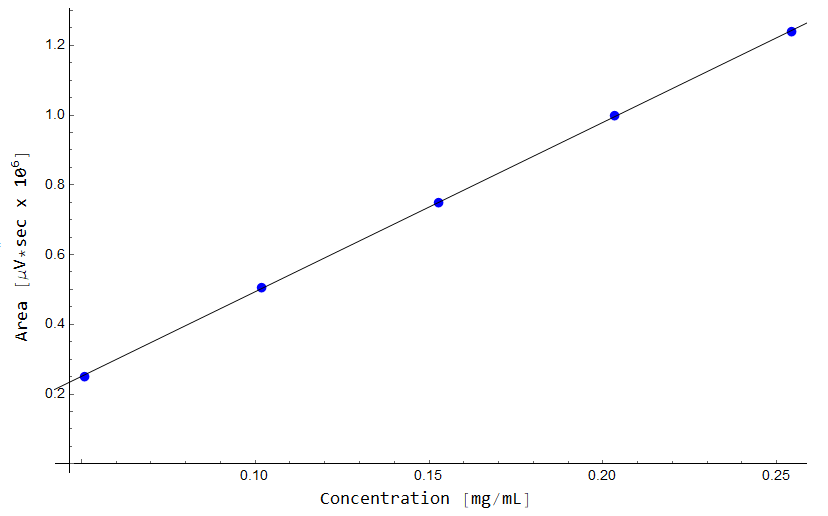
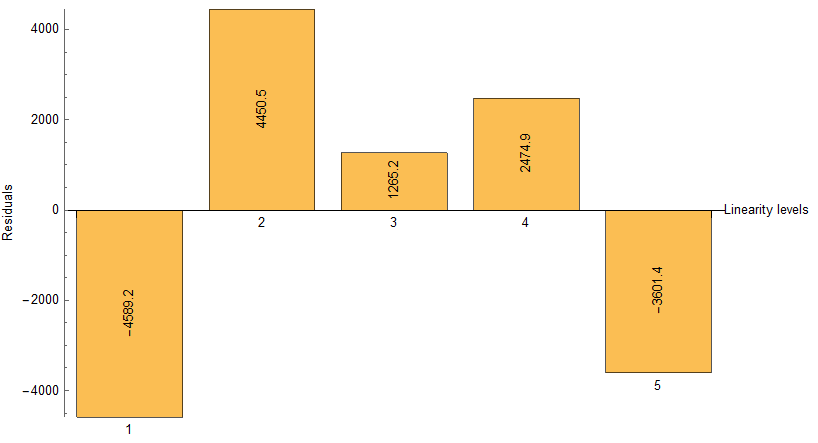
IV.2 Linearity and range
The linearity was determined by injecting a series of 5 standard solutions whose concentrations were at 0.05mg/mL, 0.10mg/mL, 0.15mg/mL, 0.2mg/mL (Target concentration, 100%), and 0.25mg/mL. As shown in Fig. (6) a plot of area of response (UNITS) vs linearity concentration levels in mg/mL was plotted. The correlation coefficient (R), range and the residual sum of squares graph were determined. All values comply with the ICH and USP guidelines. The values of the correlation coefficient were close to unity which indicates a good linearity and shows that the developed UHPLC method has a high sensitivity.
IV.3 Summary of results
| Parameter | ICH Guidelines Limit | Result | ||
|---|---|---|---|---|
| Correlation coefficient (R) | >0.995 | 0.99995 | ||
| The residual sum of squares should be randomly distributed and show no bias | Complies, distributed and show no bias | |||
| Residual Sum of Squares (RSS) | 61563649.90 | |||
| Range (Upper and lower intervals) | 25 to 125% | |||
IV.4 Accuracy
The accuracy of a method was determined by performing a recovery experiment. Concentration levels and preparations were done according to the ICH and USP guidelines. For 70% and 130% concentration levels, 3 preparations were done, and for the 100% concentration levels 6 preparations were prepared and injected. The percentage recovery i.e. the actual concentration divided by the theoretical concentration multiplied by a 100 was calculated. The percent recovery of each individual should be 98.0%. The %RSD was determined for each concentration level where the limit is 2.0%.
None of the individual samples were less than 98.0% and the %RSD was found to be less than 2.0% for all concentration levels. This indicates a good repeatability and reliability of the proposed UHPLC method.
| Accuracy Concentration Levels | %Recovery | %Mean | %RSD |
|---|---|---|---|
| Accuracy 70% S1 | 101.11 | 100.29 | 1.1 |
| Accuracy 70% S2 | 99.08 | ||
| Accuracy 70% S3 | 100.69 | ||
| Accuracy 100% S1 | 100.35 | 99.30 | 0.8 |
| Accuracy 100% S2 | 98.42 | ||
| Accuracy 100% S3 | 99.18 | ||
| Accuracy 100% S4 | 99.35 | ||
| Accuracy 100% S5 | 98.36 | ||
| Accuracy 100% S6 | 100.13 | ||
| Accuracy 130% S1 | 101.36 | 99.50 | 1.7 |
| Accuracy 130% S2 | 99.13 | ||
| Accuracy 130% S3 | 98.02 |
IV.5 Precision and intermediate precision
The precision testing was performed by injecting six determinations of batch sample at a concentration level of 100% (0.2mg/mL). It was imperative that the limits for the precision for individual values fall between 90.0 to 110.0% of the labelled amount and the %RSD on the six injections should be 2.0%.
The intermediate precision tests were conducted by a different analyst, on different equipment and on a different day.
These results were gathered from 6 injections of precision and 6 of intermediate combined together. The limits for intermediate precision is that of 2.0%.
| Precision | %Assay | %RSD on 6 samples | %RSD on 12 samples |
|---|---|---|---|
| Precision S1 | 96.91 | 0.7 | 0.8 |
| Precision S2 | 96.96 | ||
| Precision S3 | 97.98 | ||
| Precision S4 | 98.56 | ||
| Precision S5 | 97.36 | ||
| Precision S6 | 97.02 | ||
| Intermediate Precision S1 | 98.61 | 0.7 | |
| Intermediate Precision S2 | 97.86 | ||
| Intermediate Precision S3 | 99.16 | ||
| Intermediate Precision S4 | 98.24 | ||
| Intermediate Precision S5 | 98.33 | ||
| Intermediate Precision S6 | 97.27 |
V V. Conclusion
In this study we have developed a new method for quantifying captopril using UHPLC. The study shows that this is may be a viable way forward for the pharmaceutical industry, given the increasing emphasis on environmental responsibility and efficient and cost-effective use of resources. This validation study of the new method was carried out according the ICH and USP guidelines.
VI VI. Acknowledgements
We would like to thank Combino Pharm Malta Ltd. for their invaluable contributions to this study.
References
- (1)
- (2)