MALS SALT-NOT survey of MIR-selected powerful radio-bright AGN at
Abstract
We present results of an optical spectroscopic survey using SALT and NOT to build a WISE mid-infrared color-based, dust-unbiased sample of powerful radio-bright (200 mJy at 1.4 GHz) AGN for the MeerKAT Absorption Line Survey (MALS). Our sample has 250 AGN (median ) showing emission lines, 26 with no emission lines, and 27 without optical counterparts. Overall, our sample is fainter (=0.6 mag) and redder (=0.2 mag) than radio-selected quasars, and representative of fainter quasar population detected in optical surveys. About 20% of the sources are narrow line AGN (NLAGN) – of these, at are galaxies without strong nuclear emission, and 10% at , have emission line ratios similar to radio galaxies. The farthest NLAGN in our sample is M15132524 (), and the largest radio source (size330 kpc) is M09093133 (). We discuss in detail 110 AGN at . Despite representing the radio loudest quasars (median =3685), their Eddington ratios are similar to the SDSS quasars having lower . We detect 4 C iv BALQSOs, all among AGN with least , and highest black hole masses and Eddington ratios. The BAL detection rate (%) is consistent with that seen in extremely powerful ( W Hz-1) quasars. Using optical light-curves, radio polarization and -ray detections, we identify 7 high-probability BL Lacs. We also summarize the full MALS footprint to search for H i 21-cm and OH 18-cm lines at .
1 Introduction
Active Galactic Nuclei (AGN) radiate across the entire electromagnetic spectrum but in their early phases of evolution the thermal emission from the accretion disk especially at UV to optical wavelengths can be obscured by the dusty material fueling the central engine. Subsequently, as the radiative and mechanical feedback clears the obscuring material the central AGN can become observable as optically selected AGN (e.g., Sanders & Mirabel, 1996). The direct view of the accretion disk may also be blocked by a dusty ‘torus’ which has been postulated to explain the appearances of different types of AGN through orientation-based unification schemes (e.g., Urry & Padovani, 1995). In this paradigm, type i and type ii AGN appear different merely due to varying amounts of dust along the observer’s line of sight. The redder AGN are then more obscured simply because they are being viewed at inclinations closer to the equatorial plane of the torus.
In principle, AGN can also be obscured by dust from high-column density H i absorbers such as damped systems (DLAs), which are defined to have (H i)cm-2 (Wolfe & Prochaska, 2000) and associated with intervening galaxies intercepting the line of sight. Despite the availability of large samples of intervening DLAs (e.g., Noterdaeme et al., 2009; Parks et al., 2018) and the fact that they trace the bulk of neutral hydrogen in the Universe (Wolfe et al., 2005), the detected DLAs show little dust (e.g. Murphy & Liske, 2004) and only a small fraction exhibit the presence of molecular hydrogen (Petitjean et al., 2000; Ledoux et al., 2003; Noterdaeme et al., 2008; Srianand et al., 2012; Noterdaeme et al., 2015; Muzahid et al., 2015; Balashev & Noterdaeme, 2018; Zahedy et al., 2020; Boettcher et al., 2021).
Interestingly, none of the DLAs detected to date have properties similar to dense molecular clouds in the Galaxy. In fact, PKS 1830-211 which exhibits extreme reddening (visual extinction, ; Mathur & Nair, 1997) due to an intervening absorber at with properties similar to dense molecular clouds, was identified on the basis of its peculiar radio spectrum and morphology (Pramesh Rao & Subrahmanyan, 1988; Jauncey et al., 1991). The redshift of the lensing galaxy responsible for the intervening absorption was discovered through a spectroscopically blind search of molecular absorption at millemeter wavelengths (Wiklind & Combes, 1996). A dust-unbiased census of DLAs is required to correctly estimate the key observables such as H i and metal mass densities of the Universe, and the extent of dust-obscured AGN missed in UV-optical colour based surveys (e.g., Pei et al., 1991; Srianand & Kembhavi, 1997; Ellison et al., 2001; Pontzen & Pettini, 2009; Frank & Péroux, 2010; Krogager et al., 2019).
Regardless of the origin of obscuration, it is desirable to build dust-unbiased samples of AGN to distinguish between competing paradigms based on evolution or orientation to understand the AGN population itself and its impact on galaxy evolution via feedback (e.g., Fabian, 2012; Heckman & Best, 2014). The most effective techniques to achieve this are naturally based on photometric selection at hard X-ray, mid-infrared (MIR) or radio wavelengths. In recent years the AllWISE catalog from the Wide-field Infrared Survey Explorer (WISE; Wright et al., 2010; Cutri & et al., 2014) in its four bands, namely (3.4 m), (4.6 m), (12 m), and (22 m), has emerged as an excellent resource to identify obscured AGN across the full sky. The 5 point-source sensitivities of the WISE All-Sky release in the four bands in Vega-based magnitudes are 16.83, 15.60, 11.32 and 8.0, respectively.
The MIR selection of AGN works exactly in the same manner as the traditional optical color selection except that it is less susceptible to dust extinction. The near-IR spectrum of an AGN is simply an extension of the UV-optical power law. The MIR and longer wavelength IR emission comes from the hot dust in the ‘torus’ which absorbs UV-optical emission and reprocesses it (Netzer et al., 2007). All these give rise to a power law spectrum which dominates at wavelengths longer than 1 and is easily distinguishable from a declining Rayleigh-Jeans spectrum of galaxies and stars in MIR color space up to . Thus, the MIR color selection can potentially detect obscured AGN missed in UV-optical and even X-ray selections over a wide redshift range (e.g., Lacy et al., 2004; Stern et al., 2005; Mateos et al., 2012; Stern et al., 2012).
Taking advantage of the segregation of various classes of objects i.e., stars, early-type and spiral galaxies, brown dwarfs and AGN in the WISE color space (see Fig. 12 of Wright et al., 2010), several AGN identification techniques based on the ALLWISE data release have been proposed in the literature. The majority of these are based on the and i.e., the two most sensitive bands of WISE (see Assef et al., 2018, for a large all sky catalog of AGN), and have been shown to yield AGN space density much higher than those from the optical and X-ray surveys (Stern et al., 2005; Assef et al., 2010). The MIR colors corresponding to Fermi detected AGN have been used to build large samples (15,000) of blazars (D’Abrusco et al., 2019). The MIR color diagnostic has also been applied to identify dual AGN candidates which represent a crucial and rare stage in the galaxy evolution (e.g., Satyapal et al., 2017).
In this paper, we present a MIR-color scheme based on , and that efficiently selects quasars at . We have also carried out a large spectroscopic campaign using the Nordic Optical Telescope (NOT) and the Southern African Large Telescope (SALT) to measure the redshifts and confirm the nature of a subset of AGN candidates identified using our MIR-color scheme. The NOT component of the survey has already been presented by Krogager et al. (2018). Here we present the complete SALT–NOT catalog of the 303 AGN at that constitutes radio sources brighter than 200 mJy at 1.4 GHz in the NRAO VLA Sky Survey (NVSS; Condon et al., 1998) and at declination, .
The SALT-NOT sample represents a small minority of AGN that are extremely powerful in radio with 1.4 GHz spectral luminosity, W Hz-1. In past many studies have attempted to isolate the physical mechanisms responsible for the quasar radio-loudness dichotomy. The massive black holes (BHs) in radio loud AGN are found to be systematically a few times heavier than those in their radio quiet counterparts (e.g., Laor, 2000). A further interesting trend that has emerged from these studies is the anti-correlation between the Eddington ratio and radio loudness (e.g., Sikora et al., 2007). The physical parameters such as BH mass, spin and accretion rate along with the in situ magnetic field are believed to determine the extent of radio loudness and overall appearance of the AGN (e.g., Sikora & Begelman, 2013). The SALT-NOT sample offers an opportunity to revisit these issues for extremely radio loud quasars selected through MIR colors.
This paper is organized as follows. In Section 2, we present details of radio-infrared-optical cross-matching to select candidates for the SALT-NOT survey and the sample selection criteria. The latter is based on the requirements of the MeerKAT Absorption Line Survey (MALS; see Gupta et al., 2017, for key science objectives), an ongoing large survey at the South African precursor (Jonas & MeerKAT Team, 2016) of the upcoming Square Kilometer Array (SKA). In Section 3, we present the details of SALT observations and data analysis. These details for the NOT component of the survey are available in Krogager et al. (2018). The details of emission line identification, redshift measurement and AGN classifications based on the SALT-NOT spectra are provided in Section 4. Section 5 presents selected results based on radio continuum and optical emission line properties. For AGN at , we also estimate BH masses, accretion rates and the occurrence of broad absorption lines, and revisit the issue of their dependence on radio loudness. We also discuss emission line less AGN with highest optical photometric variability and the targets with no optical counterparts. Finally, in Section 6 we summarize the results and complement the SALT-NOT catalog with AGN from the literature to assemble a target list of 650 AGN defining the MALS footprint to search for cold atomic and molecular gas at .
Throughout this paper we use the CDM cosmology with =0.315, =0.685 and H0=67.4 km s-1 Mpc-1 (Planck Collaboration et al., 2020).
2 Sample Selection
The SALT-NOT sample definition is based on the requirements of MALS. MALS is using MeerKAT’s L and UHF bands covering 900–1670 and 580–1015 MHz to carry out a sensitive search for H i 21-cm (OH 18-cm) absorbers at () and (), respectively (see Gupta et al., 2017, for key science objectives). In order to ensure reasonable observability with the MeerKAT telescope located in South Africa, the majority of MALS pointings will be at . The survey is well underway and the first L- and UHF-band spectra based on the science verification data are presented in Gupta et al. (2021a) and Combes et al. (2021), respectively.
Each MALS pointing is centered at a radio source brighter than 200 mJy at 1 GHz. For L-band we require these bright AGN to be at whereas for the UHF-band all must be at and a significant fraction at , i.e., the H i 21-cm line redshift corresponding to the lower frequency edge of the band.
Since dust bias can be very significant towards sight lines with cold atomic and molecular gas, it is also desirable that the central targets for MALS are selected without any bias towards dust extinction. Thus, to efficiently identify quasars that can be used for both the L- and UHF-bands we have developed a selection scheme optimized to identify quasars based primarily on MIR colors from the AllWISE catalog. The WISE color space of radio sources identified as quasars in the SDSS spectroscopic catalog is presented in Fig. 2 of Krogager et al. (2018). This figure shows that low- and high- quasars are separated in , and color space, and the following color cuts:
| (1) |
can be used to efficiently select high- quasars.
To summarize, SALT–NOT sample is based on the following three criteria: (i) flux density 200 mJy at 1 GHz, (ii) , and (iii) MIR colors consistent with Equation 1. The last condition requires that the object is detected in the first three WISE bands. Note that only 10% of 747 million objects are detected in all three bands. We revisit the efficacy of the MIR-color selection scheme in subsequent sections.
2.1 Cross-matching and reference sample
Cross-matching multi-wavelength datasets poses multiple challenges. Firstly, not all objects may be detected in all the datasets. Secondly, due to different spatial resolutions of datasets, an object in one dataset may have multiple counterparts in the other. This is particularly relevant for radio sources which often display extended emission made up of components such as core, jets and lobes. Depending on the frequency the strongest radio component may be far away from the optical or IR counterpart. For reliable cross-matching it is desirable to have radio data with a spatial resolution of few arcseconds or better.
Another major challenge is that each selection method has its own systematics. For quasars, it is quite possible that selections using different methods may lead to objects with different characteristics such as different Eddington ratios, clustering properties and host galaxy masses. The selected quasars may then be intrinsically different, therefore comparison with samples from other selection approaches ought to be done with caution.
Concerning our sample definition, only111The Rapid ASKAP Continuum Survey (McConnell et al., 2020) was unavailable at the time of planning this project. the NRAO VLA Sky Survey (NVSS; Condon et al., 1998) and the Sydney University Molonglo Sky Survey (SUMSS; Mauch et al., 2003) at 1.4 GHz and 0.843 GHz, respectively, have the sensitivity, positional accuracy and the sky coverage required to perform cross-matching with the AllWISE catalog (Cutri & et al., 2014) at MIR wavelengths. But the spatial resolution offered by NVSS is typically ″.
In comparison, the angular resolutions in the four WISE bands are ″, ″, ″, and ″, respectively.
The coarse resolution at radio wavelength might then lead to a bias against extended lobe-dominated quasars: either they will be assigned a wrong WISE counterpart or completely missed.
To quantify the impact of this and the other above-mentioned challenges in our selection process, we start with constructing a reference sample.
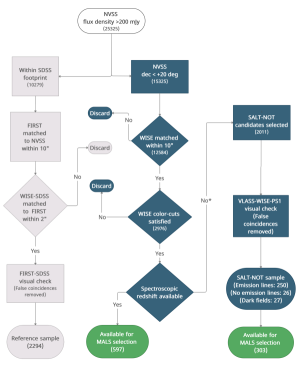
The process of building the reference sample is shown in Fig. 1. We start with NVSS which has 25,325 radio sources brighter than 200 mJy at 1.4 GHz and . We use optical data from SDSS and higher spatial resolution (i.e 5”) radio data from the Faint Images of the Radio Sky at Twenty-Centimeters (FIRST; Becker et al., 1995) to examine our selection process. The FIRST survey has observed 10,000 square degrees of the North and South Galactic Caps at 1.4 GHz, which overlaps very well with the SDSS sky coverage. These two surveys provide the best available radio-optical data covering a large area of the sky. Since the bulk of FIRST-SDSS coverage is at positive declination, we do not apply any declination cuts to the reference sample.
We cross-match 10,279 NVSS sources which are within the SDSS footprint with FIRST. We adopt a search radius of ″. Since FIRST has a spatial resolution of ″ and positional accuracy of ″, it will allow us to identify the resolved radio source components associated with the NVSS sources. Next, we cross-match FIRST radio source components with SDSS (DR14 photometry) and AllWISE catalogs to identify the closest match. Note that we require a valid WISE match to have detections in all three bands, i.e., , and . For this we adopt a search radius of ″, which has been shown to provide a good compromise between completeness and random association for FIRST–SDSS quasars (e.g., Lu et al., 2007). We visually examined all 2327 FIRST–SDSS associations using the FIRST and SDSS -band images, and excluded: (i) 8 unreal radio source components: these are due to an artefact in the FIRST image; and (ii) 12 radio sources with complex morphology: for these it is not possible to reliably assign an optical–MIR counterpart to the radio source. Spectra of 1164 sources are available in SDSS. We inspect these and reject 13 cases with false spectral line identifications. Finally, we have a reference sample of 2294 sources from NVSS, with WISE detections in , and bands, and cross-matching further refined by FIRST and SDSS.
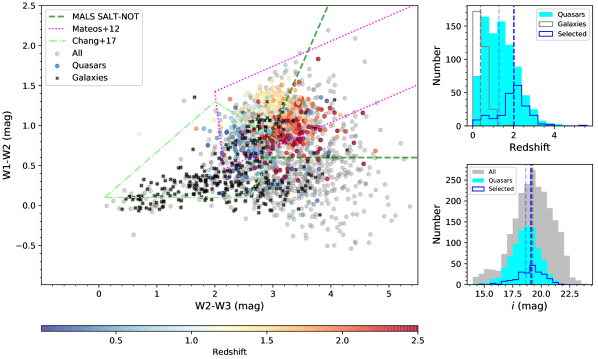
The WISE colors of the reference sample are shown in the left panel of Fig. 2. Among 1151 reference sample sources with SDSS spectra, 834 are identified as quasars and 317 as galaxies. Clearly, as expected the majority of radio bright quasars have red colors. Only beyond , the rest frame 1m minimum would shift into the band causing the color to turn blue (see Stern et al., 2012). But for high- quasars this can be compensated by even small amounts of dust, allowing the method based only on color to perform rather well even at high redshifts. However, significant host galaxy contribution can also turn blue. In the figure, we show the color wedge of Mateos et al. (2012) defined based on X-ray selected AGN. The additional constraint based on allows the wedge of Mateos et al. (2012, also see their Fig. 5) to efficiently identify AGN as long as the host galaxy contribution is less than 20%. Indeed the wedge efficiently identifies the bulk of powerful reference quasars.
In Fig. 2, we also demarcate the region corresponding to Equation 1. The redshift and -band magnitude distributions of the reference sample are shown in the right panels of Fig. 2. The median redshift and -band magnitude are 0.9 and 18.6 mag, respectively. If we consider only quasars, these values are 1.3 and 18.6 mag, respectively. For quasars within our MIR-wedge these values are 2.0 and 19.1 mag, respectively (see vertical dashed lines in Fig. 2). Also, within the wedge the fraction of AGN classified as quasars increases to 946% (214/228) whereas for the full sample it is 733% (834/1151). The fraction of quasars also increases from 30% (full sample) to 75% (within the wedge). Thus, our MIR-wedge preferentially selects more powerful and higher redshift quasars.
2.2 SALT-NOT candidate sample
The process of identifying candidates for SALT–NOT survey is shown in Fig. 1. We start with 25,325 sources brighter than 200 mJy in NVSS but first restrict ourselves to 15,325 at and then to 12,584 with WISE matches within ″. Since we use NVSS all the candidates are at . Next we consider only 2976 sources that satisfy our WISE-color cuts. Of these, 597 sources (340 at ) have spectroscopic redshifts from the literature222Nasa/IPAC Extragalctic Database (NED) and the Million Quasars (Milliquas) Catalog v4.0, and will be used later for MALS target selection (see Section 6). For the SALT-NOT survey, we exclude these and consider the remaining 2011 radio sources which have a high probability of being a quasar at .
Next, targets were drawn from the pool of 2011 candidates to fill the allocated and observable local sidereal time (LST) ranges at the NOT and SALT locations. The final sample of 303 candidates which could be observed in the allocated time is presented in Table LABEL:tab:wisesamp. The sample has been subjected to visual checks using the quick look radio images at 2–4 GHz from the Very Large Array Sky Survey (VLASS; Lacy et al., 2020). These quick look images have a spatial resolution of ″ but are not the final data products meeting the overall survey requirements. The positional accuracy is limited to ″. Therefore, we used these images only to verify the coincidence between the MIR source and the radio peak. In the cases where a VLASS image was unavailable or not of reasonable quality, the corresponding candidate was assigned a lower priority. Following the process described in Sect. 2.1, we have rejected dubious coincidences which primarily meant rejecting sources with complex radio morphologies. It was straightforward to verify and accept the compact radio sources (i.e., single component in VLASS), and indeed our overall selection process preferentially picks quasars associated with compact radio emission. But wherever possible we also included targets with clear core-jet or compact symmetric object (CSO) type morphology. In both these cases it is possible to identify the location of MIR/optical AGN. The details of radio structure of AGN observed with SALT-NOT are presented in Sect. 5.
For candidates at , we have also examined the -band images from the Panoramic Survey Telescope and Rapid Response System (PanSTARRS; Chambers et al., 2016) by considering the nearest match within 2″. Ideally, in the pursuit of dust-obscured quasars one does not include any criteria based on optical wavelengths. Therefore, we limited the majority of our targets to those that could be successfully observed with SALT and NOT in a modest amount of observing time but included a small (%) fraction with very faint ( mag) optical counterparts. Note that in Table LABEL:tab:wisesamp we have excluded 7 targets (list provided in the notes to Table LABEL:tab:wisesamp) from the NOT sample presented in table 1 of Krogager et al. (2018). The VLASS–WISE–PS1 visual check revealed that the lack of spectroscopic outcome in these cases is due to the misidentification of the optical/IR source associated with the radio source. Such misidentifactions have already been removed from the sample for the SALT component.
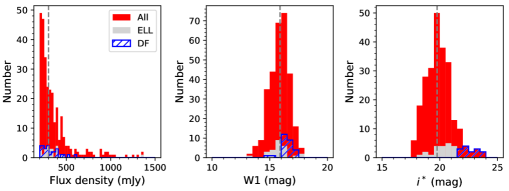
The sample presented in Table LABEL:tab:wisesamp is split into three categories: (i) with emission lines in the optical spectrum (250 objects), (ii) with no emission lines in the optical spectrum i.e., emission line less (ELLs; 26), and (iii) dark fields (DFs; 27) i.e., neither emission line nor a continuum source in optical spectra and images, respectively despite being detected in WISE images. The distributions of 1.4 GHz flux density, and -band magnitudes are shown in Fig. 3. Further details and comparison with the reference sample are provided in subsequent sections.
2.3 Efficacy of selection process
As previously mentioned, our target selection process is optimized for identifying powerful quasars at . We have therefore included a set of criteria on the WISE photometry (see Eq. 1). The mere fact that we require detections in all three WISE bands might introduce a bias in the resulting quasar sample, and the subsequent color criteria might further affect their optical properties. In this section, we aim to quantify any such selection effects.
For this purpose, we compile a highly complete spectroscopic sample of 10,498 quasars from the SDSS (DR16) in the so-called ‘Stripe 82’ region where the spectroscopic completeness is the highest in SDSS. We then cross-match this sample with the AllWISE catalog to produce our optical comparison sample. We note that although no radio flux density limits have been applied here, only 347/10,498 are detected in FIRST, and only 7 of these are brighter than 200 mJy. We will ignore this distinction in our statistical analysis.
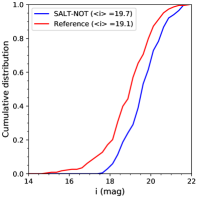
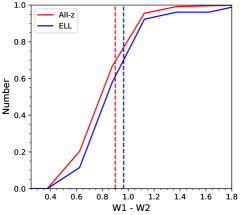
We first check the effect of requiring detections in all three WISE bands used in our criteria. We find that out of the 10,498 quasars, only 56% have WISE photometry in all three bands. Overall, the quasars with WISE detections are brighter and have slightly redder colors compared to the quasars without WISE detections in all three bands. The median -band brightness is 19.9 and 20.4 mag for quasars with and without WISE detections, respectively, and the median color differs by 0.034 mag (Fig. 4). When restricting the color comparison to quasars with the same brightness ( mag), the color difference diminishes to 0.023 mag; i.e., at the order of the photometric uncertainty.
The average redshift of quasars with WISE detections is lower () than quasars without WISE detections (), which is in line with the brighter -band magnitudes for quasars with WISE detections. Yet, there are no significant color differences as a function of redshift.
The next step is to quantify the effect of our WISE color criteria. We use the same optical comparison sample as defined above to check the optical brightness and colors of those quasars that meet the criteria in Eq. (1) and those that do not. Our WISE criteria have been designed to reduce the number of quasars, and as shown in Fig. 2, our sample effectively reduces the number of low-redshift quasars. Due to the largely different redshift-distributions, it is not surprising to find that the quasars that follow Eq. (1) are 0.4 mag fainter on average. Considering only quasars at , the quasars that follow our WISE criteria Eq. (1) are on average only 0.2 mag fainter. We find no significant difference in optical color between quasars that meet our criteria and those that do not.
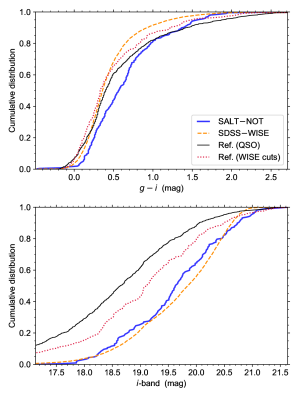
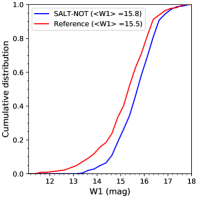
Lastly, we compare the SALT–NOT sample with the reference sample of quasars as well as the optically-selected SDSS quasar sample. In Fig. 4, we show the cumulative distributions of color and -band brightness. We find that the SALT–NOT sample has on average redder colors than the other samples, with the optically-selected sample showing the bluest colors. The median color difference is 0.2 mag. On the other hand, the SALT–NOT sample is fainter than the reference quasar sample and shows a distribution of optical brightness similar to the SDSS quasar sample.
In conclusion, we find that our imposed WISE criteria result in a sample of radio-bright quasars that is fainter and slightly redder than radio-selected (reference) quasars. Part of this difference in color and brightness can be attributed to the difference in the respective redshift distributions. Nonetheless, our sample is representative in terms of redder optical colors commonly observed in radio-selected samples while probing fainter quasars more representative of deep, optically-selected samples.
3 Observations and data analysis
We observed 255 and 99 targets with SALT and NOT, respectively. Of these, 40 targets, labelled as SUGAR (NOT-SALT) in column 7 of Table LABEL:tab:wisesamp, are common to both the sub-surveys. In this section, we present details of SALT observations and data analysis. The corresponding details for NOT observations carried out in 2016 August (P53-012) and 2017 February (P54-005; PI: Krogager) are presented by Krogager et al. (2018).
We used the Robert Stobie Spectrograph (RSS; Burgh et al., 2003; Kobulnicky et al., 2003) on SALT to obtain optical spectra of 255 targets. These service mode observations were carried out between November 2014 and April 2017 through the programmes: 2014-2-SCI-027, 2015-1-SCI-012, 2015-2-SCI-030, 2016-1-SCI-022 and 2016-2-SCI-17 (PI: N. Gupta). Each observing block typically contained two 10 minutes science exposures, in the long-slit mode having a slit width of 2″. We note that the calibration lamp and the flat field images required for the wavelength calibration and flat fielding were obtained separately, as part of 2015-1-SCI-012. The detector in RSS consists of a mosaic of three CCDs with a total size of 31712052 pixels. The pixel size is 15 which corresponds to a spatial sampling of ″ per pixel. We opted for 2 2 pixel binning to improve the signal-to-noise ratio (SNR). We used RSS PG0900 grating with a grating tilt angle of 15.875∘. This provides a wavelength coverage of 4486–7533 Å, but with gaps at 5497–5551 and 6542–6589 Å. The resulting spectral resolution is at 6041 Å. The observations were performed on clear nights with a median seeing of ″. The fainter targets were assigned higher priority for observations on dark and gray nights.
The preliminary data reduction, i.e., gain correction, overscan bias subtraction, cross-talk correction and amplifier mosaicing were performed by the SALT observatory staff using the semi-automated pipeline PySALT333http://pysalt.salt.ac.za, the Python/PyRAF software package for SALT data reduction (Crawford et al., 2010). Using IRAF444IRAF is distributed by the National Optical Astronomy Observatories, which are operated by the Association of Universities for Research in Astronomy, Inc., under cooperative agreement with the NSF. packages, we further removed cosmic rays and applied the flat-field correction. The wavelength calibration was performed using a Xenon arc lamp and the spectrophotometric standard star L377 was used for flux calibration. We extracted 1D spectra from individual exposures after subtracting the background. We also corrected the 1D spectra for atmospheric extinction and applied the air to vacuum correction to the wavelengths. The final 1D spectra of the quasars used for analysis is the combination of all the available exposures (typically 20 min on-source).
4 Spectral analysis
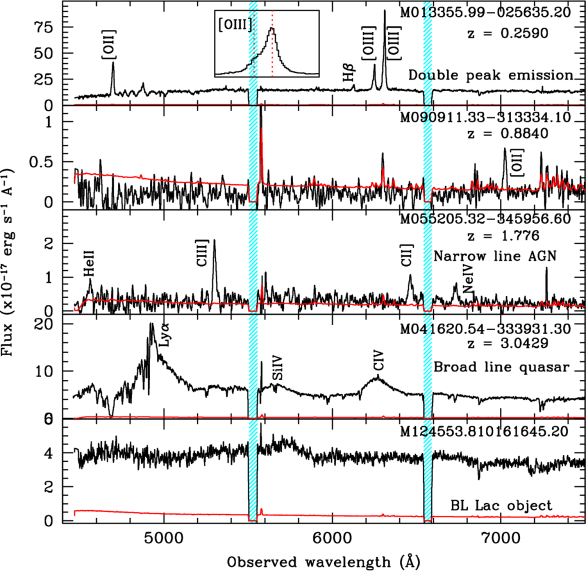
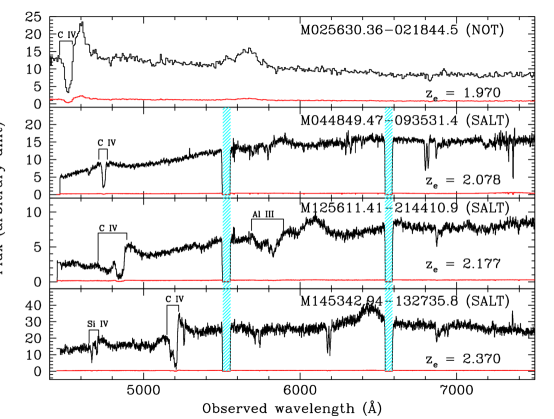
We visually examined all the spectra for the presence of emission lines. In Fig. 5, we show 5 representative SALT spectra. These represent: low- (; top two panels), intermediate- (; middle panel), high- (; second panel from the bottom) and the emission line less (ELL; bottom panel) AGN. Flux scale for each spectrum is corrected for slit losses using the PS1 photometry. Here, we have ignored the possibility of continuum variability between our spectra and the PS1 observations.
For the spectra exhibiting two or more emission lines, the line identifications are robust, and hence the redshifts estimated are also correct within the wavelength uncertainty. However, the line identification is more challenging in the cases with very faint trace/emission lines or with only single emission line detection (see second panel from top in Fig 5 for example). For such sources the identification is based on line widths, expected relative strengths and the absence of other lines within the observed wavelength range. We also used various AGN (QSO, Seyfert1 and Seyfert2) templates from the literature555https://archive.stsci.edu/hlsps/reference-atlases/cdbs/grid/agn to aid the process of line identification.
After line identification, we used peaks of prominent lines, i.e., for , C iv for , Mg ii for , C iii for , [O ii] for and, [O iii] and H for , to measure the redshifts. The rest wavelengths are taken from the SDSS emission line list666http://classic.sdss.org/dr6/algorithms/linestable.html. In the cases where the peak of the prominent emission line is affected by absorption or it falls in the CCD gap, we fit the emission line avoiding these regions and take the centroid of the fit to estimate the redshift. The overall uncertainty in redshift () that is introduced due to wavelength calibration issues and uncertainty in measuring the peak is roughly .
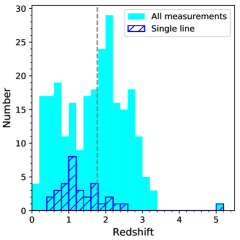
The redshift distribution of all the AGN (250) with emission line identifications is shown in Fig. 6. In 32 cases the redshift is based on a single emission line assumed to be C iv, C iii, Mg ii, [O ii] or . In Table LABEL:tab:wisesamp, these are marked with *a, *b, *c, *d and *f, respectively. In 26 cases, no emission lines (i.e., ELLs) are detected in the spectra. In 27 cases, no continuum or emission lines are detected (i.e., DFs).
5 Results
The properties of the SALT–NOT sample consisting of 250 quasars with emission lines, 26 ELLs and 27 DFs are provided in Table LABEL:tab:wisesamp. In this section, we present selected results based on continuum and emission lines detected in our optical spectra. It is well beyond the scope of this paper to discuss all the aspects in detail. Hence, we present overall properties of the observed sample and comparison with the reference sample in Sect. 5.1. This is followed by short overviews of AGN detected at split across Sections 5.2 to 5.5 on the basis of different groups of observable emission lines. For AGN at , we discuss only the fraction of narrow emission line objects (type II quasars or radio galaxies) found in different redshift intervals and the morphology of associated radio emission. For quasars at , we also present the distribution of BH masses and the fraction of broad absorption line (BAL) quasars. The farthest narrow line AGN in our sample is M15132524 (), and the one with largest projected linear size of radio emission (size330 kpc) is M09093133 (). For some individual objects the details, such as the morphology of associated radio emission, host galaxy and emission line properties, relevant to the discussion presented in these sections are provided in Appendix B. The properties of M1312-2026, the potential highest redshift AGN in the sample, are discussed in Sect. 5.6. In Sections 5.7 and 5.8, we discuss AGN with no optical emission lines and dark fields, respectively.
5.1 Overall properties
The basic properties, i.e., redshift, and -band magnitudes of the SALT–NOT sample are summarized in Fig. 7. We have also used emission lines detected in our spectra to classify objects as narrow-line (NL) or broad-line (BL) AGN. In Table LABEL:tab:wisesamp, these are labeled as ‘G’ and ‘Q’, respectively. In total, 51/250 objects are NLAGN and 33 of these are at . As expected the fraction of NLAGN in our sample falls off at higher redshifts.
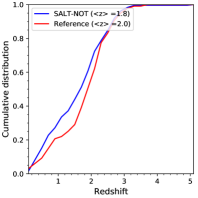
Fig. 7 also provides a comparison with the reference sample of quasars satisfying our MIR cut (see Section 2.1). The median redshift of the SALT–NOT sample is only slightly lower but a deficit of lower redshift AGN in the reference sample is apparent. A two-sample Kolmogorov–Smirnoff (KS) test shows that there is a less than 1 percent chance (p-value = 0.008) that the two samples are different purely by chance. Related to this, we also note that in the SALT–NOT sample, % objects are NLAGN whereas based on the reference sample only % are expected.
In Fig. 7, we also compare and -band magnitudes of the two samples. Clearly, the SALT–NOT sample corresponds to a population of fainter AGN. We note that the probabilities of two samples being drawn from the sample populations are for brightness and for -band brightness. This further confirms the assertion made in Sect. 2.3 that the inclusion of , the less sensitive WISE band, in our target selection has not biased our sample towards brighter objects. In particular, the -band magnitudes of AGN in our sample at and are similar. Therefore, the excess of NLAGN at in our sample is intriguing. It is likely a direct consequence of the selection of optically fainter targets through MIR color selection. Excluding these NLAGN renders the -distributions of the SALT–NOT sample and the reference sample statistically identical.
5.2 AGN at
For AGN, our SALT spectra cover [O ii], [O iii] and H emission lines. The NOT spectra additionally cover the Mg ii emission line as well. Overall, the SALT–NOT sample has 33/303, i.e., 11% AGN in our sample are at . We find the spectra in all the 33 cases to be mostly dominated by narrow permitted emission lines (with FWHM2000 km s-1). The available optical images are also consistent with their hosts being galaxies with weak or no nuclear emission. Compared to this, in the reference sample (SDSS), only 32% (6/19) of the AGN satisfying our MIR wedge are classified as galaxies. As mentioned above, this difference with respect to the reference sample is most likely due to the optical faintness of the SALT–NOT sample and the specific goal to reject low-redshift AGN (Barrows et al., 2021).
The radio emission associated with these NLAGN is often extended, the largest projected linear size being 250 kpc (details in Appendix B). An examination of optical emission lines led to identification of 2 dual AGN showing double peaked spectra (an example is shown in top panel of Fig. 5; more details in Appendix B). Our detection rate of % is marginally higher, but only at 1, than the detection rate (1%) of dual AGN in SDSS (Liu et al., 2010).
5.3 AGN at
For AGN at (35/303), the SALT–NOT spectra cover both Mg ii and [O ii] emission lines. About % (12/35) of these show emission lines of [O ii], Ne iv and Ne v without (or narrow) Mg ii broad emission lines. The fraction of NLAGN (8/28 i.e., %) is consistent with the reference sample.
In VLASS 3 GHz images, 8/12 (%) of the NLAGN in the SALT–NOT sample exhibit extended radio emission with lobes, the largest projected linear size being 330 kpc. Among BLAGN, as expected, a much smaller fraction (40%) is associated with extended radio emission (Padovani et al., 2017; Hickox & Alexander, 2018). The largest extent is only 180 kpc (see Appendix B for details). We also examined the radio morphology and optical emission line profiles for evidences of interaction between radio jet and the host galaxy emission (see e.g., Mullaney et al., 2013). In three cases, the radio morphology is distorted. But only in one of these (details in Appendix B), the [O ii] line is asymmetric, which may be an indication of radio jet-ISM interaction (e.g., Gupta et al., 2005).
5.4 AGN at
At , our sample has 71 AGN. Only two of these are possibly NLAGN and the radio emission in both the cases has a double lobed morphology (details in Appendix B). This low fraction (3%; 2/71) of NLAGN is consistent with the reference sample, which has 0/53 such AGN in this redshift range.
5.5 AGN at
As previously mentioned, for these redshifts the SALT-NOT spectra of 110 AGN in our sample allow detection of C iv emission lines. Based on the width of C iv emission line (i.e FWHM 2000 km s-1) we identify 4 of these objects to be the NLAGN. In comparison, the reference sample has no NLAGN (0/128) at , which is consistent at 2 considering one-sided Poissonian statistics. The details of NLAGN at in our sample are provided in Appendix B). The emission line ratios are typical of what is observed in high- radio galaxies. Two of these i.e., M13152745 and M15132524 are among the largest radio galaxies at these redshifts (see figure 13 of Shukla et al., 2021a, for the latest compilation). In the rest of this section, we discuss BH masses, Eddington ratios and BALS associated with the BLAGN.
5.5.1 BH masses and Eddington ratios
Under the assumption that broad line region (BLR) clouds are in virial equilibrium, the mass of the black hole, , is given by
| (2) |
where is the gravitational constant and is the virial coffecient that depends on the geometry and kinematics of the BLR. The radius of the BLR, , is generally estimated using empirical relations between continuum or line luminosity (e.g., Kaspi et al., 2000). The value of is also empirically determined (e.g., Onken et al., 2004). Following Shen et al. (2011), we estimate virial BH masses for quasars with the C iv emission line using a relation of the form
| (3) |
where and are calibrated from reverberation mapping for a particular emission line (e.g., Denney et al., 2010). The broad line FWHM is in km s-1 and the continuum luminosity, , which is a proxy for is in units of erg s-1. We adopt = 0.660 and = 0.53 for equation 3 based on the empirical relationship provided by Vestergaard & Peterson (2006) to estimate BH mass for our sample.
Further, to place our SALT–NOT sample in the broader context of the overall quasar population, we compare our measurements to the compilation of 105,783 SDSS DR7 quasars provided by Shen et al. (2011). For direct comparability of the measurements, we largely follow the method of Shen et al. (2011) to measure C iv FWHM and at 1350Å. In short, we fit a power law to the continuum in the rest wavelength ranges of 1445 – 1465 and 1700 – 1705 Å. Prior to continuum fitting we mask any unwanted spikes stronger than 5. Then, we fit the continuum subtracted emission line in the wavelength range 1500 – 1600 Å using three Gaussians. The FWHM of the emission line, referred to as the full line FWHM, is then estimated from the fit after rejecting any individual components with strength 5%. The continuum luminosity at 1350Å () is estimated using the same power law used to fit the continuum underlying the C iv emission line. We are able to reliably estimate full C iv line FWHM, continuum luminosity at 1350Å and BH mass of 86/110 quasars () from our sample. We have excluded 24 AGN with low SNR profiles or lines affected by the CCD edge. Similar to Shen et al. (2011), the bolometric luminosity () have been estimated by applying the bolometric correction factor of 3.81 to (Richards et al., 2006). The Eddington ratio () is estimated as /, where is the Eddington luminosity.
The compilation of Shen et al. (2011) consists of 11,840 non-BAL quasars at (median = 2.29), the redshift range covered by our sample (median = 2.34). We have restricted the sample of Shen et al. (2011) to the subset that has been identified by a uniform target selection algorithm and flux limited to = 19.1 at or = 20.2 at (Richards et al., 2002). A distinguishing feature of the SALT–NOT sample is the high radio brightness of quasars. In particular, the quasars in SALT–NOT sample have predominantly flat radio spectra. The median spectral index777Spectral index is defined by the power law, , , derived using the NVSS 1420 MHz and the uGMRT 420 MHz total flux densities is (Gupta et al., 2021b). In the uGMRT images, 79/88 of these are represented by a single Gaussian component. Therefore, we further restrict the sample of Shen et al. (2011) to 786 core-dominated quasars, hereafter Shen11-core in short, detected in FIRST.
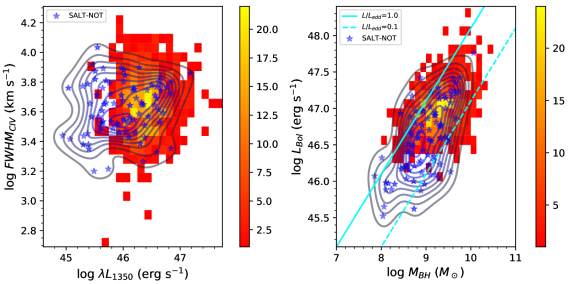
In left panel of Fig. 8, we show the distributions of full C iv FWHM and 1350 Å luminosity for SALT–NOT and Shen11-core quasars. The SALT–NOT sample extends about 0.5 dex fainter in 1350 Å luminosity. The two-sample KS test probability of these two samples being drawn from the same parent sample is extremely small (p-value = ). The C iv FWHM of the SALT–NOT sample (median FWHM = 4445 km s-1) is marginally smaller than the Shen11-core sample (median FWHM = 4660 km s-1), and this difference is statistically insignificant. We note that if the C iv profiles are affected by non-virial motions such as outflows (Coatman et al., 2016), the influence ought to be similar in both the samples. Due to the luminosity dependence of in the virial mass estimator, the overall BH masses estimated using equation 3 are lower for the SALT–NOT sample (see right panel of Fig. 8). The KS test probability of two distributions being drawn from the same parent sample is extremely small (p-value = ; see left panel of Fig. 9).
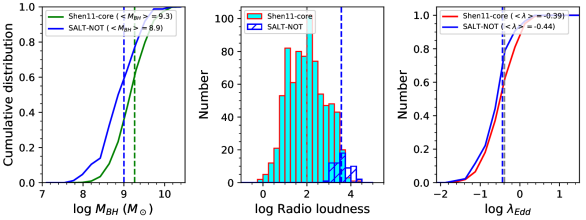
In the middle panel of Fig. 9, we show the radio-loudness parameter (), defined as the ratio of the rest-frame flux densities at 5 GHz () and at 2500 Å (), for the two samples. For SALT-NOT quasars, the values of have been estimated using the flux density at 1.4 GHz from NVSS using the spectral slopes from Gupta et al. (2021b). In cases where is unavailable, we have used the median of instead. The values of have been estimated by interpolating the PS1 photometry. Clearly, the SALT–NOT sample represents extremely radio-loud quasars (median ). The corresponding Eddington ratio is only slight smaller (median log = vs. ) as compared to the Shen11-core sample and the difference is statistically insignificant (-value = 0.02). Thus, over four orders of magnitude covered by the radio-loudness in the SALT–NOT and Shen11-core quasars, we see no dependence of radio-loudness on the accretion rate. This confirms the saturation of radio-loudness observed at low Eddington ratios (see Fig. 3 of Sikora et al., 2007).
5.5.2 BAL occurrence
We focus now on the 105 SALT–NOT AGN showing C iv emission at to search for broad absorption lines (BALs) representing outflowing gas. We exclude 7 cases at where the blue wing of C iv emission line falls in the CCD gap. In the remaining, we detect 4 C iv BAL quasars (see Fig. 10), i.e., an overall BAL detection rate of 4/98 = %. We find a consistent BAL fraction in our reference sample, without any MIR cut, where 9 out of 175 quasars at show C iv BALs (52%).
Typically, 10-20% of radio sources are detected as BALQSOs. Becker et al. (2000) studied the properties of radio selected BAL quasars from First Bright Quasar Survey sample. They also noticed that while the BAL detection rate is high among radio loud quasars their dependence on the radio luminosity is complex. In particular, the authors find a deficiency of BALQSOs among very radio bright quasars. Specifically, the BAL fraction drops from % at W Hz-1 to at W Hz-1 (Shankar et al., 2008). The low BAL detection rate in the SALT–NOT sample which has W Hz-1 is consistent with this trend in luminosity.
The radio emission associated with M14531327 is extended (largest angular size, LAS) with a projected linear size of 140 kpc. In the other three cases, the radio emission is dominated by a compact component (projected linear size 5 kpc). This is consistent with the previous results that the radio emission associated with BALQSOs is compact (Becker et al., 2000). Notably, the 4 BALQSOs have , and in the range of , and M⊙, respectively, which correspond to objects with least radio loudness, and highest BH mass and Eddington ratios.
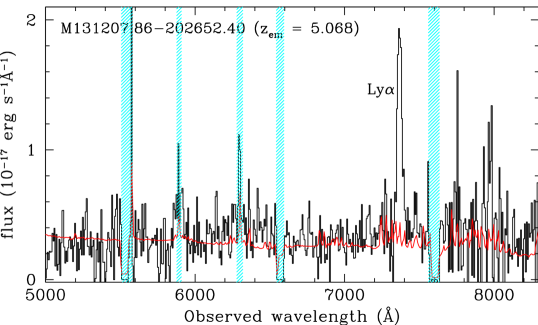
5.6 M1312–2026: a powerful AGN at ?
| Frequency | Flux | Deconvolved Size | Ref. |
|---|---|---|---|
| (GHz) | (mJy) | ||
| 0.23 | 2577 | 7.1″3.3″, 0.0∘ | (1) |
| 1.39 | 677 | 0.8″0.2″, 5.0∘ | (2) |
| 1.40 | 778 | 17.9″ | (3) |
| 4.86 | 233 | 2″ | (4) |
The bright radio sources at high- are extremely rare. This is partly due to the interaction between the emitting electrons and the cosmic microwave background (CMB) which makes AGN less luminous in radio (Ghisellini et al., 2014). In the SALT spectrum of M1312-2026 (Fig. 11), we identify only a single narrow emission line over the wavelength range covered. If this emission line is , then the corresponding redshift will be . At 4.86 GHz, the radio source has a flux density of 233 mJy and a size of (Table 1), and is unambiguously identified with a WISE and PS1 object with colors that are consistent with it being a high- radio loud quasar.
In order to confirm the redshift of M1312-2026, we reobserved the object with X-shooter of the Very Large Telescope on 2022 February 01. In the X-shooter spectrum, we do not detect expected Mg ii, C iii] and C iv lines corresponding to the presumed at z=5.068. Instead, the detection of [O iii], H and H emission lines confirm the above identified line to be [O ii] and the systemic redshift of the quasar to be . Further details of the X-shooter spectrum of this highly reddened object will be presented in a future paper.
5.7 Objects without emission lines
In recent times, the locus of MIR colors of known Fermi detected AGN have been used to build large samples of blazars (e.g., Chang et al., 2017; D’Abrusco et al., 2019). These MIR color-selection techniques use the first three or all four bands of WISE, and typically extract 0.5% (%) of the overall radio888Based on the NVSS sensitivity. (WISE) source population as blazars. They include both classes of blazars: (i) BL Lacs with featureless optical spectra, i.e., no emission lines (equivalent width 5 Å; Stickel et al., 1991), and (ii) flat spectrum, radio-loud quasars (FSRQs) with quasar-like emission lines. In the recent literature, these two classes are also referred to as BZBs, i.e., blazars of BL Lac type and BZQs, i.e., blazars of quasar type, respectively (Massaro et al., 2009).
In the following, we focus on the 26 objects without emission lines (emission line less; ELL) in our sample that can be considered candidate BZBs. The median parameter which is defined as the logarithm of the ratio of flux densities measured in -band and at 20cm of ELL targets is . This is well outside the range of (-1.85, -1) for BZB candidates based on the locus of Fermi detected BL Lacs (D’Abrusco et al., 2019, see also Fig. 2). The SALT–NOT ELLs thus represent a population of candidate BL Lacs that is under-represented in the MIR selected population.
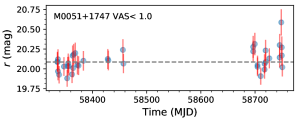
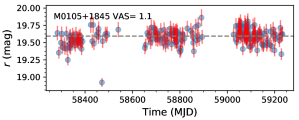
The most crucial and somewhat controversial aspect of establishing the BL Lac nature of AGN is to confirm its featureless optical spectra. Our SALT/NOT spectra are adequate to detect the broad emission lines from AGN but weak lines may be missed due to the poor spectral resolution and noisy data. This is illustrated by the case of two ELL candidates, M0051+1747 and M0105+1845, for which no redshift determination could be established based on the NOT spectra alone. However, these targets have later been observed as part of SDSS and have been identified as = 1.536 and 1.074, respectively. We note that these redshifts are consistent with weak and narrow emission lines in the NOT spectra, which were originally marked tentative. Thus, the objective of the analysis presented here is to identify BL Lac candidates based on the general properties of blazars: large time variability at all wavelengths and timescales, polarized emission, and a flat or inverted radio spectrum (e.g., Rector & Stocke, 2001a).
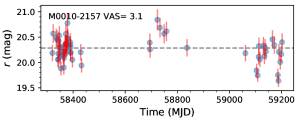
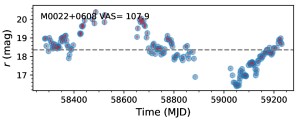
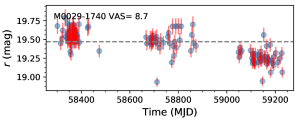
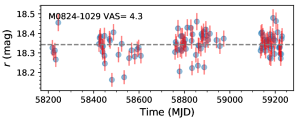
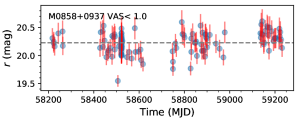
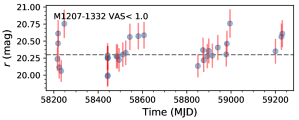
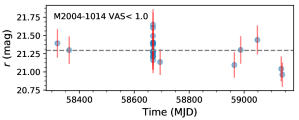
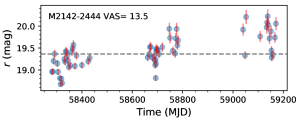
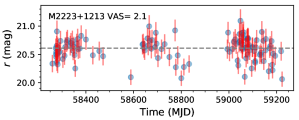
We evaluate the variability of ELLs using the data from the Zwicky Transient Facility (ZTF; Masci et al., 2019). The -band light curves are available for 15 AGN (median PS1 = 19.9 mag; see Fig. A.1 in the Appendix A). The remaining targets are either not covered (only 3) in ZTF or are fainter (median PS1 = 20.9 mag) and have time series with less than 10 data points. From the light curves, we estimate the variability amplitude () and error () on it using the normalized excess variance method described in Nandra et al. (1997) and Vaughan et al. (2003). The variability amplitude strength, VAS = /, is provided in Fig. A.1.
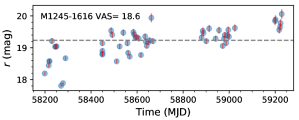
We also estimate the observed using , where are measured fluxes with individual error and mean . The hypothesis of the AGN being intrinsically non-variable can be rejected at 99% confidence level for 11/15 targets. The remaining 4 targets are among the faintest (PS1 -band: 20.3 – 21.7 mag) and the conclusion is likely influenced by the low SNR of the light curve. Rejecting these and considering objects with VAS3.0, we obtain a sample of 4 promising (M0022+0608, M00291740, M12451616 and M21422444) and two marginal (M00102157 and M08241029) BL Lac candidates (see Fig. A.1). Optical spectrum of M12451616 obtained with SALT is shown in Fig. 5.
Interestingly, the candidate with the highest VAS (M0022+0608; see Fig. A.1) is in fact a bonafide -ray emitting BL Lac (Massaro et al., 2009). Further, the candidates M00102157, M00291740, M12451616 and M21422444 are also identified in the blazar catalog of D’Abrusco et al. (2019) but as BZQ candidates on the basis of their position in the three dimensional (---) WISE color-space based on the locus of confirmed Fermi blazars (Massaro et al., 2009; Acero et al., 2015). Further, 4/6 candidates are also polarized at 2-4% level in NVSS (Taylor et al., 2009), and except one (M00291740) all are core-dominated in VLASS 3 GHz images. Note that it is not unusual for BL Lacs to exhibit extended radio emission (Rector & Stocke, 2001b).
If the BL Lacs are similarly represented in the 11 remaining ELLs not analysed due to the lack of ZTF light curves, then we expect another 4 candidates. In this context, it is also useful to cross-correlate all 26 ELLs with the latest Fermi data release (4FGL DR2; Ballet et al., 2020). We recover previously noted M0022+0608, and find two new matches corresponding to M00102157 and M05530840.
In summary, we have 7 high-probability BL Lac candidates; 6 identified on the basis of variability analysis and 1 through cross-matching with -ray sources, i.e., a detection rate of 7/303 (%). Stickel et al. (1991) used 1 Jy sample to estimate the surface density (0.005 for 1 Jy at 5 GHz) of radio selected BL Lacs. The fraction of BL Lacs in the 1 Jy sample of radio sources brighter than 20 mag (-band) is 15%. Therefore, we expect that better quality data through a targeted optical follow-up will confirm more of these ELLs as BL Lacs.
5.8 Dark fields
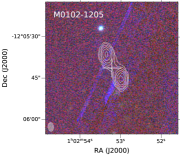
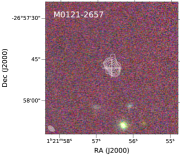
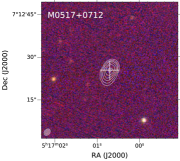
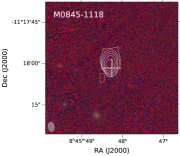
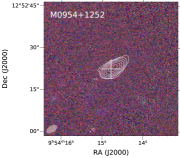
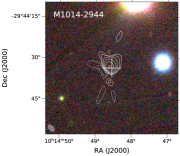
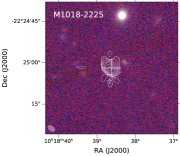
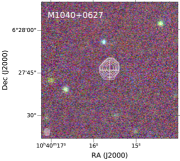
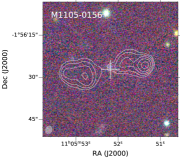
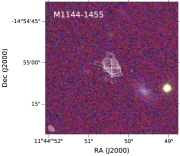
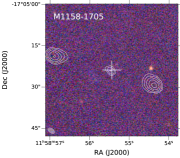
The 27 targets for which there are no firm optical identifications, i.e., dark fields (DFs), are also presented in Table LABEL:tab:wisesamp. For 14 of these, the stacked PS1 catalog implies optical counterparts with a median -band magnitude of 22.5 mag (Waters et al., 2020). Clearly, these represent the faintest targets in our sample (see last panel of Fig. 3). On average they are also fainter in WISE (see last panel of Fig. 3). But the magnitudes are still well within the range over which we have successfully obtained optical spectra (middle panel of Fig. 3). Thus, misidentifications due to errors in radio–MIR cross-matching is unlikely to significantly contribute to DFs. This is also confirmed by the VLASS–PS1 overlays of 24 DFs covered in PS1 (see Fig. A.2). In 20/24 cases, the radio source is compact and coincides () with the MIR position marked by the cross. In the remaining 4 cases, the radio emission is extended, exhibits a double-lobe morphology and the MIR source is located between them, i.e., at the expected location of the AGN.
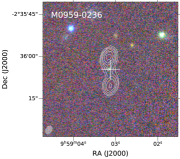
The above implies that DFs are truly fainter than the implicit magnitude limit of SALT–NOT observations and barely detectable in PS1999Note that the 5 depth of PS1 -band stack images is 23.1 mag.. Thus, it is reasonable to assume that these have the same redshift distribution (median = 1.8) as the other SALT–NOT targets. The basic statistics of MIR-wedge implies that 5% of these are low-redshift radio galaxies. Indeed, upon careful inspection of the PS1 images, we identify diffuse, low-surface brightness emission associated with two targets: M09590236 and M11441455. These two targets could plausibly be radio galaxies at .
The optical faintness of the remaining DFs, presumably quasars, could be due to (i) an intrinsically low luminosity; (ii) very large amounts of dust in the foreground (intrinsic or intervening) or (iii) a very high redshift () such that the detectable continuum and emission lines are redshifted into the near-infrared; or (iv) a non-quasar origin of the radio/MIR emission. There is already a tentative indication of a slight excess of intervening and associated DLAs towards optically faint quasars (Ellison et al., 2008; Gupta et al., 2021b). Thus, the identified DFs in our survey may be hiding a small but important population of dusty H i absorbers. The MALS observations of these central DF targets and the other optically faint AGN in the MeerKAT field-of-view will reveal any such absorbers at .
6 Summary and outlook
| SALT-NOT | MALSa | |
|---|---|---|
| Number of AGN | 303 | |
| Median flux density (mJy) | 300 | |
| Median (mag) | 15.9 | 15.6 |
| Median (mag) | 19.8 | 19.4d |
| Inside MIR wedge (equation 1) | 100% | 70% |
| With spectroscopic redshift | 83% | 79% |
| Median spectroscopic- | 1.8 | 1.7 |
Note. — : Includes SALT-NOT sample. : 70 at selected using SUMSS. The remaining at are based on NVSS. : Estimated at 1.4 GHz. SUMSS 0.850 MHz flux densities computed at 1.4 GHz assuming . : Only targets overlapping with PS1 considered. Note slight increase in the -band brightness due to the inclusion of redshifts from the literature.
In this paper, we describe a large spectroscopic survey of radio bright AGN selected based on the following criteria: (i) radio flux density at 1.4 GHz 200 mJy; (ii) ; and (iii) WISE MIR-colors: and . These criteria are optimized to select powerful quasars at . Starting from 25,325 sources brighter than 200 mJy in NVSS we identify 2011 candidate quasars, of which 303 were observed with SALT (180 hrs) and NOT (6 nights; Krogager et al., 2018).
The SALT–NOT sample of 303 objects presented in this paper consists of (i) AGN with emission lines in the optical spectrum (250); (ii) objects with no emission lines in the optical spectrum, i.e., emission line less (ELLs; 26); and (iii) dark fields (DFs; 27), i.e., neither emission lines nor a continuum source in the optical spectra or photometry (also see Table LABEL:tab:malstarget).
We compare the SALT–NOT sample with the highly complete spectroscopic sample of 10,498 quasars from the SDSS (DR16) in the so-called ‘Stripe 82’ region, and with a reference sample of 2294 AGN from SDSS selected by applying the same constraints on the radio flux density and MIR colors as the SALT–NOT sample. We show that our imposed WISE criteria has lead to a sample of radio-bright quasars which are fainter (0.6 mag) and redder ( = 0.2 mag) than radio-selected quasars in the reference sample, and representative of a fainter quasar population detected in optical surveys.
About 20% (51/303) of the AGN in our sample only have narrow emission lines. The majority of these (33/51) at , are galaxies without strong nuclear emission. In two cases the emission line is double peaked and likely corresponds to rare dual AGN. The highest redshift NLAGN (M15132524) is at . The details of this optically faint ( mag) AGN associated with a large (90 kpc) and luminous nebula are presented by Shukla et al. (2021a). The double-lobed radio emission associated with M15132524 has an extent of 184 kpc. In general, the NLAGN in our sample exhibit extended radio emission with lobes and in some cases cores – the largest being M0909-3133 (= 0.884) with a projected linear size of 330 kpc.
Based on the reference sample, we expect only 5% of objects in the SALT–NOT sample to be NLAGN. The discrepancy is primarily due to the contaminants. Excluding these would render the -distribution and broad- vs. narrow-line AGN composition of the SALT–NOT sample identical to the reference sample. Overall, the application of our WISE-color criteria improves the efficiency of identifying AGN by a factor of 1.7 (i.e., from 30% to 50%).
We discuss in detail the properties of the 110 SALT–NOT AGN at . The four NLAGN in this sub-sample show emission line ratios similar to high- radio galaxies. The radio emission associated with two of these (M13152745 and M15132524) are among the largest at these redshifts (280 and 184 kpc, respectively). We estimate Bolometric luminosities, radio-loudness parameters (), black hole masses () and Eddington ratios of the remaining 106 AGN in this sub-sample. In comparison to the optically selected core-dominated SDSS quasars from Shen et al. (2011), the SALT–NOT quasars are fainter (0.5 dex lower ) and, consequently, have lower (0.4 dex) . It is intriguing to note that despite representing the most radio-loud quasars (median = 3685), the Eddington ratios of our objects are similar to the less radio-loud (median = 100) SDSS quasars. In fact, we do not find any dependence between radio loudness and Eddintgton ratio in the SALT–NOT and SDSS quasar samples spanning four orders of magnitude in . This confirms the saturation of radio loudness observed at low Eddington ratios (Sikora et al., 2007), and the significance of physical parameters such as black hole spin and the in-situ magnetic field in influencing the overall appearance of AGN.
Among AGN, we also detect 4 C iv BAL quasars. All are associated with objects of least radio loudness, and highest BH masses and Eddington ratios. The low BAL quasar detection rate (%) is consistent with that seen in extremely powerful ( W Hz-1) radio loud quasars (Shankar et al., 2008). The systematic H i 21-cm absorption line search in these quasars suggests deficiency of cold atomic gas at host galaxy scales (Gupta et al., 2021b). In this context, it will be interesting to confirm the slight excess of proximate DLAs observed in our sample (Gupta et al., 2021b). The details of gaseous environment of these quasars at larger ( kpc) scales are presented in a separate paper (Shukla et al., 2021b).
Based on detailed optical variability analysis, radio polarization and -ray properties we identify 7 high-probability BL Lacs among 26 ELLs in our sample. Better quality optical spectra will likely confirm a larger fraction of these ELLs as bonafide BL Lacs. Finally, we discuss 27 DFs in our sample which could be due to (i) an intrinsically low luminosity; (ii) very large amounts of dust in the foreground (intrinsic or intervening) or (iii) a very high redshift () such that the continuum is strongly absorbed by the intervening forest and emission lines are redshifted into the near-infrared; or (iv) a non-quasar origin of the radio/MIR emission.
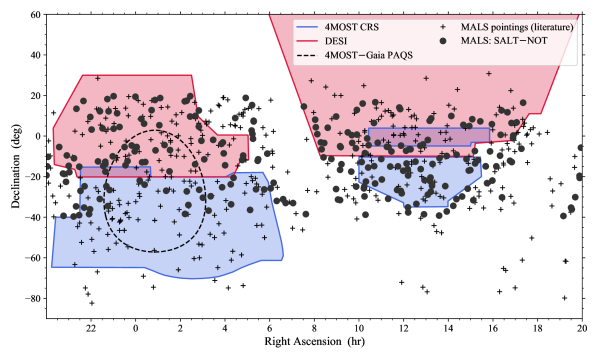
The selection criteria of SALT-NOT sample are based on the requirements of MALS. The entire MALS footprint of 500 pointings each at L and UHF bands is based on the SALT-NOT sample presented here and additional 350 bright radio sources selected from the literature. The overall properties of this larger pool of 650 AGN are presented in Table LABEL:tab:malstarget (see also Fig. 13 for the survey footprint and overlap with various optical surveys).
The complete details of the MALS sample will be provided in future papers. But, in short, these additional sources are AGN: (i) with known spectroscopic redshift and from the literature (see Fig. 1 i.e., the green box with 597 AGN), and (ii) brighter than 200 mJy at 843 MHz and in the SUMSS (Mauch et al., 2003). Further, priority has been given to AGN having excellent multi-wavelength data or close to nearby () galaxies. This extended sky coverage through a larger pool of 650 sources offers flexibility in selecting pointings for the observations, and maximising the scientific output corresponding to various galaxies and AGN detected within the MALS field-of-view (see Gupta et al., 2017, for some of the science cases).
Currently, 400 pointings mostly at L band have already been observed (Fig. 13). Looking forward, MALS will continue to observe with the MeerKAT through 2021-22 and afterwards primarily in the UHF band. We plan to release all radio continuum images and spectra along with the catalogs of detected sources and spectral lines through our survey website: https://mals.iucaa.in. This will include multi-wavelength data such as the SALT-NOT spectra presented here. We expect all these to be an excellent resource for the astronomical community for a broad range of galactic and extragalactic applications.
Appendix A Properties of MALS SALT-NOT sample
The properties of AGNs in the SALT-NOT sample are provided here. The ZTF light curves and radio-optical overlays for ELLs and DFs, respectively, are also provided.
![[Uncaptioned image]](/html/2107.09705/assets/x28.png)
![[Uncaptioned image]](/html/2107.09705/assets/x29.png)
![[Uncaptioned image]](/html/2107.09705/assets/x30.png)
Figure A.1 continued.
![[Uncaptioned image]](/html/2107.09705/assets/x43.png)
![[Uncaptioned image]](/html/2107.09705/assets/x44.png)
![[Uncaptioned image]](/html/2107.09705/assets/x45.png)
![[Uncaptioned image]](/html/2107.09705/assets/x46.png)
![[Uncaptioned image]](/html/2107.09705/assets/x47.png)
![[Uncaptioned image]](/html/2107.09705/assets/x48.png)
![[Uncaptioned image]](/html/2107.09705/assets/x49.png)
![[Uncaptioned image]](/html/2107.09705/assets/x50.png)
![[Uncaptioned image]](/html/2107.09705/assets/x51.png)
![[Uncaptioned image]](/html/2107.09705/assets/x52.png)
![[Uncaptioned image]](/html/2107.09705/assets/x53.png)
![[Uncaptioned image]](/html/2107.09705/assets/x54.png)
Figure A.2 continued.
| NVSS-ID | Flux | Bmaj | Bmin | Bpa | Redshift | Telescope | AGN-type | |||||||
|---|---|---|---|---|---|---|---|---|---|---|---|---|---|---|
| WISE-ID | W | W | ||||||||||||
| PS1-ID | nStackDets | nDetections | g | r | i | |||||||||
| (1) | (2) | (3) | (4) | (5) | (6) | (7) | (8) | |||||||
| (9) | (10) | (11) | (12) | (13) | (14) | (15) | (16) | (17) | ||||||
| (18) | (19) | (20) | (21) | (22) | (23) | (24) | (25) | (26) | (27) | (28) | (29) | (30) | ||
| Spectra with emission lines (250) | ||||||||||||||
| M000234.52-052324.5 | 235.4 | 16.7 | 15.9 | - | 0.306 | SALT | G | |||||||
| J000234.55-052324.0 | 0.6439997 | -5.3900227 | 15 | 0.04 | 14.18 | 0.05 | 10.96 | 0.14 | ||||||
| PSO J000.6440-05.3900 | 5 | 77 | 21.26 | 0.08 | 20.31 | 0.02 | 19.95 | 0.02 | 19.18 | 0.03 | 19.23 | 0.05 | ||
| M000920.42-074057.5 | 269.9 | 18.8 | 16.7 | - | 1.672 | SALT | Q | |||||||
| J000920.43-074057.3 | 2.3351346 | -7.6826025 | 16.26 | 0.07 | 15.07 | 0.09 | 11.65 | 0.25 | ||||||
| PSO J002.3351-07.6826 | 5 | 76 | 20.16 | 0.02 | 19.97 | 0.02 | 19.47 | 0.03 | 19.6 | 0.02 | 19.43 | 0.03 | ||
| M000923.07-282153.9 | 205.8 | 19.0 | 18.0 | - | 1.796 | SALT | Q | |||||||
| J000923.18-282152.0 | 2.3466024 | -28.3644449 | 15.77 | 0.05 | 14.51 | 0.06 | 11.19 | 0.15 | ||||||
| PSO J002.3465-28.3645 | 10 | 65 | 20.02 | 0.02 | 19.34 | 0.02 | 18.92 | 0.01 | 19.19 | 0.04 | 19.23 | 0.05 | ||
| M001508.49+082803.8∗b | 384 | 18.6 | 17.4 | - | 1.710 | SALT | Q | |||||||
| J001508.62+082802.2 | 3.7859185 | 8.4672841 | 15.06 | 0.04 | 14.26 | 0.05 | 10.95 | 0.14 | ||||||
| PSO J003.7858+08.4674 | 5 | 49 | 19.46 | 0.02 | 19.02 | 0.04 | 18.67 | 0.02 | 18.71 | 0.01 | 18.42 | 0.02 | ||
| M001708.03-125624.9 | 929.7 | 17.1 | 16.1 | - | 0.883 | SUGAR | G | |||||||
| J001708.22-125625.5 | 4.2842556 | -12.9404436 | 14.16 | 0.03 | 12.96 | 0.03 | 9.51 | 0.05 | ||||||
| PSO J004.2842-12.9405 | 5 | 74 | 20.46 | 0.04 | 19.68 | 0.02 | 19.25 | 0.02 | 18.87 | 0.02 | 18.1 | 0.03 | ||
| M002355.84-235717.8∗b | 211 | 17.6 | 16.3 | - | 1.442 | SALT | Q | |||||||
| J002355.79-235719.3 | 5.9824792 | -23.9553806 | 16.32 | 0.07 | 15.41 | 0.10 | 12.04 | 0.31 | ||||||
| PSO J005.9820-23.9555 | 5 | 44 | 21.82 | 0.1 | 21.13 | 0.05 | 20.79 | 0.04 | 20.91 | 0.15 | 20.17 | 0.18 | ||
| M002546.66-124725.2 | 394.4 | 17.2 | 15.3 | - | 0.770 | SALT | Q | |||||||
| J002546.68-124724.9 | 6.444512 | -12.7902504 | 15.85 | 0.05 | 15.21 | 0.10 | 11.77 | - | ||||||
| PSO J006.4444-12.7904 | 8 | 22 | -999 | -999 | 21.64 | 0.09 | 21.25 | 0.07 | 20.72 | 0.08 | -999 | -999 | ||
| M004243.06+124657.6 | 635 | 18.3 | 16.2 | - | 2.150 | NOT | Q | |||||||
| J004243.02+124657.2 | 10.6792742 | 12.7825612 | 15.78 | 0.05 | 14.54 | 0.07 | 11.13 | 0.17 | ||||||
| PSO J010.6793+12.7826 | 10 | 68 | 20.12 | 0.03 | 19.95 | 0.04 | 19.54 | 0.02 | 19.41 | 0.04 | 19.28 | 0.06 | ||
| M005315.65-070233.4 | 248.2 | 17.7 | 14.8 | - | 2.130 | NOT | Q | |||||||
| J005315.67-070232.5 | 13.3153062 | -7.0423807 | 16.31 | 0.07 | 15.25 | 0.10 | 11.95 | 0.3 | ||||||
| PSO J013.3154-07.0424 | 5 | 65 | 20.83 | 0.03 | 20.28 | 0.02 | 20.01 | 0.01 | 19.71 | 0.04 | 19.53 | 0.09 | ||
| M010329.05+052131.2 | 589.1 | 16.0 | 15.6 | - | 1.421 | SALT | Q | |||||||
| J010329.05+052132.4 | 15.871081 | 5.3590232 | 16.7 | 0.09 | 15.57 | 0.12 | 11.79 | - | ||||||
| PSO J015.8710+05.3588 | 5 | 74 | 20.87 | 0.04 | 20.68 | 0.06 | 20.14 | 0.02 | 19.99 | 0.03 | 19.89 | 0.12 | ||
| M010628.74-343409.0 | 259.8 | 18.2 | 16.0 | - | 0.116 | SALT | G | |||||||
| J010628.71-343410.5 | 16.6196616 | -34.5695834 | 13.66 | 0.03 | 12.96 | 0.03 | 9.07 | 0.03 | ||||||
| - | - | - | - | - | - | - | - | - | - | - | - | - | ||
| M011727.84-042511.5 | 421.4 | 19.2 | 16.8 | - | 1.720 | NOT | Q | |||||||
| J011727.86-042510.4 | 19.3661239 | -4.4195713 | 16.05 | 0.06 | 15 | 0.08 | 11.71 | 0.24 | ||||||
| PSO J019.3661-04.4196 | 5 | 66 | 20.3 | 0.04 | 20.67 | 0.05 | 19.27 | 0.03 | 19.9 | 0.05 | 19.64 | 0.18 | ||
| M013047.38-172505.6 | 250.3 | 17.5 | 16.1 | - | 2.528 | SALT | Q | |||||||
| J013047.31-172506.2 | 22.697147 | -17.4183991 | 16.71 | 0.1 | 16.01 | 0.18 | 12.09 | - | ||||||
| PSO J022.6972-17.418 | 5 | 42 | 20.49 | 0.04 | 20.35 | 0.03 | 20.36 | 0.03 | 20.24 | 0.05 | 20.24 | 0.15 | ||
| M013212.20-065236.8∗c | 1258.9 | 18.3 | 16.2 | - | 1.511 | SALT | Q | |||||||
| J013212.24-065236.0 | 23.0510009 | -6.8766872 | 15.95 | 0.05 | 14.73 | 0.06 | 11.32 | 0.16 | ||||||
| - | - | - | - | - | - | - | - | - | - | - | - | - | ||
| M013355.99-025635.2 | 270.2 | 19.2 | 16.9 | - | 0.261 | SALT | G | |||||||
| J013355.91-025633.3 | 23.4829682 | -2.9426108 | 13.58 | 0.03 | 12.67 | 0.03 | 9.56 | 0.04 | ||||||
| PSO J023.4830-02.9426 | 5 | 73 | 18.96 | 0.03 | 18.28 | 0.02 | 18.26 | 0.01 | 17.9 | 0.02 | 17.9 | 0.02 | ||
| M013721.79+072059.0 | 314.8 | 44.7 | 18.4 | 3.3 | 0.255 | SALT | G | |||||||
| J013721.81+072058.0 | 24.3408858 | 7.3494561 | 14.35 | 0.03 | 13.29 | 0.03 | 10.03 | 0.05 | ||||||
| PSO J024.3406+07.3495 | 0 | 7 | -999 | -999 | -999 | -999 | 19.87 | 0.14 | 19.36 | 0.07 | -999 | -999 | ||
| M015647.53-361608.3 | 1296.9 | 16.6 | 16.4 | - | 0.354 | SALT | G | |||||||
| J015647.59-361610.1 | 29.1983255 | -36.2694836 | 14.76 | 0.03 | 13.49 | 0.03 | 10.14 | 0.06 | ||||||
| - | - | - | - | - | - | - | - | - | - | - | - | - | ||
| J021148.77+170723.2 | 539.8 | 19.3 | 17.9 | - | 1.980 | NOT | Q | |||||||
| J021148.78+170722.6 | 32.9532841 | 17.1229521 | 16.22 | 0.06 | 15.42 | 0.10 | 11.82 | 0.24 | ||||||
| PSO J032.9532+17.1230 | 5 | 45 | 20.24 | 0.07 | 20.12 | 0.03 | 19.88 | 0.02 | 19.64 | 0.03 | 19.61 | 0.04 | ||
| M021231.86-382256.6 | 244.5 | 18.6 | 16.4 | - | 2.260 | SALT | Q | |||||||
| J021231.72-382256.9 | 33.1321971 | -38.382499 | 17.16 | 0.09 | 16.33 | 0.15 | 12.32 | - | ||||||
| - | - | - | - | - | - | - | - | - | - | - | - | - | ||
| M021650.70+172404.9 | 395.2 | 17.5 | 17.2 | - | 1.530 | NOT | Q | |||||||
| J021650.74+172405.7 | 34.2114448 | 17.4016026 | 15.99 | 0.06 | 15.09 | 0.10 | 11.91 | 0.36 | ||||||
| PSO J034.2114+17.401 | 5 | 54 | 20.73 | 0.05 | 20.16 | 0.04 | 19.8 | 0.04 | 19.89 | 0.03 | 19.64 | 0.09 | ||
| M021715.31-271555.4 | 265.1 | 18.7 | 15.3 | - | 1.950 | SALT | Q | |||||||
| J021715.33-271555.4 | 34.3138823 | -27.265405 | 16.7 | 0.07 | 15.54 | 0.09 | 12.09 | 0.24 | ||||||
| PSO J034.3138-27.2654 | 5 | 62 | 19.91 | 0.01 | 19.84 | 0.02 | 19.61 | 0.01 | 19.44 | 0.02 | 19.41 | 0.05 | ||
| M022128.93-335827.0 | 219.8 | 17.9 | 16.0 | - | 0.524 | SALT | Q | |||||||
| J022128.90-335826.8 | 35.3704341 | -33.9741367 | 15.67 | 0.04 | 14.29 | 0.05 | 10.33 | 0.07 | ||||||
| - | - | - | - | - | - | - | - | - | - | - | - | - | ||
| M022613.72+093726.3 | 374.6 | 17.1 | 16.4 | - | 2.605 | SUGAR | Q | |||||||
| J022613.71+093726.7 | 36.5571491 | 9.6240874 | 15.03 | 0.04 | 14.11 | 0.05 | 10.74 | 0.1 | ||||||
| PSO J036.5571+09.6241 | 5 | 55 | 18.33 | 0.01 | 18.01 | 0.01 | 17.89 | 0.02 | 17.8 | 0.01 | 17.69 | 0.02 | ||
| M022639.92+194110.1 | 209.8 | 15.9 | 14.0 | - | 2.190 | NOT | Q | |||||||
| J022639.93+194110.5 | 36.6663794 | 19.686268 | 16.52 | 0.09 | 15.46 | 0.12 | 11.9 | - | ||||||
| PSO J036.6665+19.6862 | 5 | 69 | 20.46 | 0.02 | 20.36 | 0.02 | 20.06 | 0.02 | 19.74 | 0.02 | 19.74 | 0.03 | ||
| M022924.85-243600.9∗b | 276.7 | 14.1 | 17.6 | 68.1 | 2.003 | SALT | Q | |||||||
| J022924.93-243600.9 | 37.3538803 | -24.6002552 | 16.04 | 0.05 | 15.28 | 0.07 | 12.21 | 0.24 | ||||||
| PSO J037.3539-24.6003 | 5 | 11 | -999 | -999 | -999 | -999 | 21.61 | 0.04 | -999 | -999 | 20.24 | 0.18 | ||
| M023939.11-135409.4 | 214 | 18.3 | 16.6 | - | 1.947 | SALT | Q | |||||||
| J023939.14-135409.5 | 39.9131075 | -13.9026396 | 16.04 | 0.05 | 14.95 | 0.06 | 11.66 | 0.17 | ||||||
| PSO J039.9130-13.9026 | 5 | 44 | 19.66 | 0.02 | 19.55 | 0.02 | 19.38 | 0.02 | 19.27 | 0.03 | 19.25 | 0.09 | ||
| M024027.19+095713.0 | 521.2 | 14.7 | 19.0 | -50.1 | 1.874 | SALT | Q | |||||||
| J024027.16+095713.4 | 40.113197 | 9.9537378 | 16.36 | 0.07 | 15.49 | 0.12 | 12.43 | 0.45 | ||||||
| PSO J040.1135+09.9537 | 5 | 44 | 21.01 | 0.05 | 20.98 | 0.04 | 20.48 | 0.05 | 20.27 | 0.05 | -999 | -999 | ||
| M024046.80+083258.3 | 305.4 | 19.6 | 16.4 | - | 1.100 | NOT | Q | |||||||
| J024046.81+083259.9 | 40.1950492 | 8.5499839 | 15.57 | 0.04 | 14.59 | 0.06 | 11.49 | 0.21 | ||||||
| PSO J040.1951+08.5500 | 5 | 61 | 19.74 | 0.02 | 19.41 | 0.01 | 19.2 | 0.01 | 19.11 | 0.01 | 18.9 | 0.03 | ||
| M024106.56-171640.3 | 453.9 | 17.7 | 16.6 | - | 0.365 | SALT | G | |||||||
| J024106.57-171641.5 | 40.2774033 | -17.2782204 | 15.26 | 0.04 | 14.64 | 0.05 | 11.81 | 0.25 | ||||||
| PSO J040.2774-17.2782 | 5 | 81 | 21.03 | 0.07 | 19.88 | 0.02 | 19.62 | 0.02 | 19.15 | 0.03 | 19.18 | 0.04 | ||
| M024939.93+044028.9 | 420.5 | 17.0 | 16.2 | - | 2.008 | SUGAR | Q | |||||||
| J024939.97+044028.3 | 42.4165498 | 4.6745332 | 16.15 | 0.06 | 15.10 | 0.07 | 11.68 | 0.19 | ||||||
| PSO J042.4165+04.6745 | 5 | 60 | 20.61 | 0.03 | 20.32 | 0.06 | 19.88 | 0.01 | 19.61 | 0.02 | 19.48 | 0.09 | ||
| M025035.54-262743.1 | 389.2 | 16.6 | 15.3 | - | 2.918 | SALT | Q | |||||||
| J025035.56-262742.4 | 42.6481981 | -26.4617931 | 16.08 | 0.05 | 15.06 | 0.07 | 11.63 | 0.16 | ||||||
| PSO J042.6482-26.4618 | 5 | 78 | 19.1 | 0.01 | 18.97 | 0.02 | 18.9 | 0.02 | 18.98 | 0.01 | 18.89 | 0.03 | ||
| M025630.36-021844.5 | 260.3 | 17.3 | 15.6 | - | 1.970 | NOT | Q | |||||||
| J025630.37-021844.2 | 44.1265641 | -2.312278 | 15.21 | 0.03 | 13.88 | 0.04 | 10.27 | 0.06 | ||||||
| PSO J044.1266-02.3123 | 5 | 72 | 18.85 | 0.03 | 18.63 | 0.01 | 18.46 | 0.01 | 18.25 | 0.01 | 18.32 | 0.01 | ||
| M030032.15-302243.8 | 371.4 | 16.6 | 15.4 | - | 0.310 | SALT | G | |||||||
| J030032.19-302242.4 | 45.1341357 | -30.37846 | 14.66 | 0.03 | 13.8 | 0.03 | 10.26 | 0.05 | ||||||
| - | - | - | - | - | - | - | - | - | - | - | - | - | - | |
| M030413.80-112653.5 | 335 | 16.6 | 15.3 | - | 1.552 | SUGAR | Q | |||||||
| J030413.74-112653.3 | 46.0572895 | -11.4481531 | 16.98 | 0.09 | 15.84 | 0.12 | 12.34 | - | ||||||
| PSO J046.0574-11.4480 | 5 | 82 | 20.33 | 0.02 | 20.02 | 0.03 | 19.76 | 0.04 | 19.93 | 0.03 | 19.74 | 0.11 | ||
| M031022.90+055552.6 | 200.5 | 21.2 | 17.8 | 52.5 | 0.399 | SALT | G | |||||||
| J031023.01+055552.4 | 47.5958935 | 5.9312433 | 15.12 | 0.03 | 13.89 | 0.04 | 10.27 | 0.08 | ||||||
| PSO J047.5959+05.9313 | 5 | 49 | -999 | -999 | 21.17 | 0.07 | 20.35 | 0.03 | 20.12 | 0.04 | 19.63 | 0.06 | ||
| M031407.94-090946.9 | 226.8 | 44.5 | 18.7 | 84.1 | 0.312 | NOT | G | |||||||
| J031407.90-090948.5 | 48.532931 | -9.1634772 | 15.25 | 0.04 | 14.61 | 0.05 | 11.72 | 0.24 | ||||||
| PSO J048.5329-09.1635 | 10 | 64 | 21.38 | 0.07 | 20.1 | 0.02 | 19.67 | 0.04 | 19.51 | 0.03 | 19.16 | 0.04 | ||
| M031551.28-364450.8 | 462.4 | 19.6 | 15.6 | - | 1.348 | SALT | Q | |||||||
| J031551.34-364448.9 | 48.9639505 | -36.7469393 | 15.8 | 0.04 | 14.84 | 0.05 | 11.74 | 0.17 | ||||||
| - | - | - | - | - | - | - | - | - | - | - | - | - | ||
| M031706.76+065550.3 | 247.9 | 23.9 | 17.2 | 70.8 | 0.275 | NOT | G | |||||||
| J031706.74+065549.6 | 49.2781024 | 6.9304589 | 14.78 | 0.03 | 14.12 | 0.05 | 11.13 | 0.16 | ||||||
| PSO J049.2781+06.9305 | 5 | 61 | 21.41 | 0.08 | 20 | 0.04 | 19.46 | 0.02 | 18.95 | 0.04 | 18.83 | 0.04 | ||
| M032128.78-294047.4∗d | 2061.7 | 16.5 | 15.6 | - | 0.583 | SALT | Q | |||||||
| J032128.80-294046.3 | 50.3700396 | -29.6795529 | 13.97 | 0.03 | 12.85 | 0.03 | 9.57 | 0.03 | ||||||
| PSO J050.3701-29.6796 | 5 | 50 | 20.68 | 0.02 | 19.96 | 0.03 | 18.98 | 0.02 | 19.32 | 0.02 | 18.83 | 0.03 | ||
| M032808.59-015220.2 | 221.9 | 18.3 | 15.9 | - | 2.679 | SUGAR | Q | |||||||
| J032808.68-015221.0 | 52.0361812 | -1.8725096 | 15.46 | 0.04 | 14.55 | 0.06 | 11.31 | 0.17 | ||||||
| PSO J052.0363-01.8726 | 5 | 76 | 18.7 | 0.01 | 18.53 | 0.02 | 18.48 | 0.02 | 18.36 | 0.01 | 18.33 | 0.03 | ||
| M034157.75+151925.5 | 200.4 | 17.5 | 15.1 | - | 1.699 | NOT | Q | |||||||
| J034157.69+151925.0 | 55.4903908 | 15.3236243 | 16.32 | 0.08 | 15.22 | 0.09 | 11.77 | - | ||||||
| PSO J055.4904+15.3235 | 5 | 60 | 20.87 | 0.05 | 20.58 | 0.04 | 20.18 | 0.05 | 20.04 | 0.03 | 19.85 | 0.09 | ||
| M035016.86-035111.3 | 230.5 | 17.5 | 15.3 | - | 0.611 | SUGAR | Q | |||||||
| J035016.85-035111.3 | 57.5702271 | -3.8531559 | 15.21 | 0.04 | 14 | 0.04 | 10.65 | 0.1 | ||||||
| PSO J057.5702-03.8532 | 5 | 75 | 19.25 | 0.02 | 19.06 | 0.02 | 18.81 | 0.01 | 18.86 | 0.02 | 18.79 | 0.05 | ||
| M035211.06-251449.8 | 269.3 | 17.0 | 16.4 | - | 1.675 | SALT | Q | |||||||
| J035211.06-251450.2 | 58.0460983 | -25.2473 | 14.77 | 0.03 | 13.68 | 0.03 | 10.12 | 0.06 | ||||||
| PSO J058.0461-25.2473 | 5 | 73 | 19.52 | 0.02 | 19.32 | 0.03 | 19.04 | 0.01 | 18.97 | 0.02 | 18.79 | 0.05 | ||
| M035414.70-030804.3 | 725.6 | 18.7 | 18.1 | - | 0.442 | SALT | G | |||||||
| J035414.72-030804.8 | 58.5613708 | -3.1346696 | 14.79 | 0.03 | 13.98 | 0.04 | 10.82 | 0.13 | ||||||
| PSO J058.5614-03.1348 | 5 | 58 | 20.58 | 0.03 | 19.87 | 0.02 | 19.18 | 0.01 | 19.17 | 0.03 | 18.54 | 0.02 | ||
| M035633.46+190034.6 | 1051.3 | 17.7 | 17.0 | - | 1.480 | NOT | Q | |||||||
| J035633.48+190034.3 | 59.1395029 | 19.0095492 | 15.76 | 0.05 | 14.95 | 0.08 | 11.73 | 0.32 | ||||||
| PSO J059.1394+19.0090 | 3 | 31 | -999 | -999 | -999 | -999 | 20.64 | 0.02 | 19.9 | 0.03 | 19.42 | 0.05 | ||
| M035634.55-083121.3 | 239.7 | 18.3 | 16.8 | - | 1.447 | NOT | Q | |||||||
| J035634.52-083122.3 | 59.1438555 | -8.522875 | 16.52 | 0.08 | 15.34 | 0.10 | 11.84 | - | ||||||
| PSO J059.1439-08.5229 | 5 | 60 | 21.15 | 0.04 | 20.47 | 0.03 | 20.23 | 0.02 | 20.24 | 0.05 | 20.22 | 0.05 | ||
| M040015.06-142328.0∗c | 409.7 | 19.1 | 15.8 | - | 1.136 | SALT | Q | |||||||
| J040015.04-142328.2 | 60.0626992 | -14.391167 | 15.81 | 0.05 | 15.16 | 0.08 | 12.11 | 0.33 | ||||||
| PSO J060.0627-14.3911 | 10 | 73 | 19.38 | 0.01 | 19.14 | 0.01 | 19.22 | 0.01 | 19.07 | 0.02 | 18.96 | 0.04 | ||
| M041530.42-234750.2 | 262 | 17.4 | 16.0 | - | 0.366 | SALT | G | |||||||
| J041530.38-234751.3 | 63.8765933 | -23.7975834 | 15.59 | 0.04 | 14.8 | 0.06 | 11.61 | 0.19 | ||||||
| PSO J063.8767-23.7975 | 5 | 65 | 20.74 | 0.02 | 19.63 | 0.01 | 19.53 | 0.02 | 19.11 | 0.02 | 19.15 | 0.1 | ||
| M041620.54-333931.3 | 264.1 | 20.0 | 15.8 | - | 3.045 | SALT | Q | |||||||
| J041620.47-333931.6 | 64.0853255 | -33.6587934 | 16.08 | 0.05 | 15.19 | 0.08 | 11.66 | 0.19 | ||||||
| - | - | - | - | - | - | - | - | - | - | - | - | - | ||
| M042248.53-203456.6 | 224.3 | 17.2 | 16.7 | - | 2.582 | SALT | Q | |||||||
| J042248.43-203455.8 | 65.7017923 | -20.5821781 | 16.73 | 0.08 | 15.96 | 0.14 | 12.09 | - | ||||||
| PSO J065.7019-20.5822 | 5 | 60 | 20.84 | 0.04 | 20.46 | 0.05 | 20.52 | 0.03 | 20.45 | 0.09 | 19.42 | 0.16 | ||
| M042725.05+085330.3∗c | 937.7 | 13.9 | 13.9 | - | 1.215 | SALT | Q | |||||||
| J042725.11+085329.9 | 66.8546587 | 8.8916425 | 15.91 | 0.06 | 14.9 | 0.08 | 11.64 | 0.27 | ||||||
| PSO J066.8546+08.8916 | 5 | 52 | 20.79 | 0.08 | 20.13 | 0.04 | 19.75 | 0.03 | 19.5 | 0.08 | 19.46 | 0.05 | ||
| M044604.72-114813.4 | 273.8 | 17.7 | 15.8 | - | 1.668 | SALT | Q | |||||||
| J044604.67-114812.8 | 71.5194971 | -11.8035664 | 15.12 | 0.03 | 14.28 | 0.04 | 11.08 | 0.12 | ||||||
| PSO J071.5196-11.8035 | 5 | 82 | 18.78 | 0.01 | 18.52 | 0.01 | 18.22 | 0.01 | 18.16 | 0.01 | 18.16 | 0.02 | ||
| M044849.48-093531.3 | 240.9 | 17.9 | 15.5 | - | 2.079 | SALT | Q | |||||||
| J044849.47-093531.4 | 72.2061409 | -9.5920798 | 14.57 | 0.03 | 13.64 | 0.03 | 10.27 | 0.08 | ||||||
| PSO J072.2061-09.5921 | 10 | 76 | 18.3 | 0 | 17.88 | 0.01 | 17.59 | 0 | 17.43 | 0.01 | 17.41 | 0.02 | ||
| M045541.91+185010.9 | 328.1 | 16.3 | 14.5 | - | 0.548 | NOT | Q | |||||||
| J045541.81+185009.1 | 73.9242412 | 18.8358874 | 14.61 | 0.04 | 13.86 | 0.04 | 10.79 | 0.11 | ||||||
| PSO J073.9245+18.8359 | 5 | 92 | 20.21 | 0.04 | 19.69 | 0.01 | 19.06 | 0.01 | 18.93 | 0.02 | 18.32 | 0.02 | ||
| M050725.04-362442.9 | 212.4 | 17.1 | 14.7 | - | 2.930 | SALT | Q | |||||||
| J050725.06-362443.1 | 76.8544416 | -36.4119939 | 15.66 | 0.04 | 14.63 | 0.04 | 11.14 | 0.09 | ||||||
| - | - | - | - | - | - | - | - | - | - | - | - | - | ||
| M051024.23-195950.3 | 336.2 | 15.2 | 16.6 | 89.5 | 0.472 | NOT | G | |||||||
| J051024.07-195949.9 | 77.6003298 | -19.9971964 | 14.95 | 0.03 | 14.15 | 0.04 | 11.16 | 0.12 | ||||||
| PSO J077.6003-19.9972 | 10 | 65 | 20.61 | 0.12 | 20.31 | 0.03 | 19.76 | 0.04 | 19.69 | 0.04 | 19.22 | 0.04 | ||
| M051134.05+024416.0 | 351.4 | 18.3 | 17.1 | - | 1.366 | SALT | Q | |||||||
| J051134.13+024416.5 | 77.8922114 | 2.7379244 | 16.3 | 0.07 | 15.31 | 0.09 | 12.16 | 0.37 | ||||||
| PSO J077.8921+02.7377 | 5 | 33 | 21.74 | 0.15 | 21.17 | 0.03 | 21.23 | 0.04 | 20.9 | 0 | -999 | -999 | ||
| M051240.99+151723.8 | 966.5 | 17.1 | 15.3 | - | 2.568 | NOT | Q | |||||||
| J051241.02+151723.4 | 78.1709541 | 15.289858 | 15.53 | 0.05 | 14.45 | 0.06 | 10.99 | 0.19 | ||||||
| PSO J078.1709+15.2899 | 5 | 78 | 20.3 | 0.06 | 19.75 | 0.06 | 19.62 | 0.05 | 19.11 | 0.02 | 18.86 | 0.05 | ||
| M051340.03+010023.6 | 447 | 19.0 | 17.0 | - | 2.673 | SALT | Q | |||||||
| J051340.03+010021.7 | 78.4168243 | 1.0060487 | 15.73 | 0.05 | 14.88 | 0.07 | 11.56 | 0.27 | ||||||
| PSO J078.4168+01.0060 | 10 | 87 | 19.14 | 0.01 | 18.83 | 0.01 | 18.8 | 0.02 | 18.71 | 0.01 | 18.54 | 0.02 | ||
| M051511.18-012002.4 | 288.8 | 17.5 | 15.7 | - | 2.287 | SALT | Q | |||||||
| J051511.18-012001.9 | 78.7965932 | -1.3338644 | 15.79 | 0.05 | 14.81 | 0.07 | 11.35 | 0.17 | ||||||
| PSO J078.7965-01.3339 | 10 | 62 | 18.81 | 0.01 | 18.66 | 0 | 18.6 | 0.02 | 18.59 | 0.04 | 18.4 | 0.02 | ||
| M051656.35+073252.7 | 231.7 | 17.7 | 16.4 | - | 2.594 | SUGAR | G | |||||||
| J051656.28+073251.6 | 79.2345275 | 7.5476931 | 14.18 | 0.03 | 13.53 | 0.03 | 10.65 | 0.15 | ||||||
| PSO J079.2343+07.5473 | 5 | 30 | 21.14 | 0.09 | 20.29 | 0.03 | 19.7 | 0.03 | 19.27 | 0.05 | 19.13 | 0.02 | ||
| M052318.55-261409.6 | 1354.9 | 18.9 | 15.7 | - | 3.110 | SALT | Q | |||||||
| J052318.50-261409.2 | 80.8270963 | -26.2359125 | 14.65 | 0.03 | 13.91 | 0.04 | 10.79 | 0.09 | ||||||
| PSO J080.8270-26.2360 | 10 | 90 | 18.83 | 0.01 | 18.71 | 0.01 | 18.63 | 0.01 | 18.46 | 0.01 | 18.14 | 0.02 | ||
| M052744.71-121153.7 | 335.6 | 17.7 | 16.2 | - | 0.316 | SALT | G | |||||||
| J052744.69-121153.9 | 81.936226 | -12.1983095 | 15.4 | 0.04 | 14.66 | 0.06 | 11.72 | 0.24 | ||||||
| PSO J081.9362-12.1983 | 5 | 64 | 21.24 | 0.04 | 20.12 | 0.03 | 19.75 | 0.02 | 19.29 | 0.03 | 19.24 | 0.04 | ||
| M052905.55-112607.5 | 455.8 | 17.8 | 16.0 | - | 1.007 | SUGAR | Q | |||||||
| J052905.51-112607.8 | 82.2729967 | -11.4355102 | 14.99 | 0.04 | 14.3 | 0.05 | 11.3 | 0.14 | ||||||
| PSO J082.2730-11.4355 | 5 | 61 | 20.3 | 0.07 | 19.71 | 0.06 | 19.52 | 0.02 | 19.33 | 0.02 | 19.06 | 0.04 | ||
| M054518.09-261857.3 | 236.9 | 19.3 | 16.3 | - | 0.800 | SALT | Q | |||||||
| J054518.01-261856.3 | 86.3250527 | -26.3156623 | 15.71 | 0.04 | 14.81 | 0.06 | 11.73 | 0.23 | ||||||
| PSO J086.3251-26.3156 | 5 | 53 | 19.69 | 0.06 | 19.52 | 0.04 | 19.6 | 0.03 | 19.51 | 0.06 | 19.47 | 0.08 | ||
| M055007.33+002731.5 | 208.7 | 17.6 | 17.0 | - | 0.279 | SALT | G | |||||||
| J055007.28+002731.6 | 87.5303628 | 0.4587796 | 14.06 | 0.03 | 13.13 | 0.03 | 9.98 | 0.06 | ||||||
| PSO J087.5304+00.4588 | 5 | 64 | 20.91 | 0.03 | 19.88 | 0.03 | 19.33 | 0.01 | 18.67 | 0.03 | 18.51 | 0.04 | ||
| M055205.32-345956.6 | 280 | 17.8 | 15.4 | - | 1.777 | SALT | G | |||||||
| J055205.47-345958.1 | 88.0227953 | -34.9994984 | 17.78 | 0.18 | 16.28 | 0.16 | 12.62 | 0.47 | ||||||
| - | - | - | - | - | - | - | - | - | - | - | - | - | ||
| M060248.09-254602.2∗d | 555.3 | 17.8 | 15.0 | - | 0.602 | SALT | Q | |||||||
| J060248.05-254602.6 | 90.7002434 | -25.7673954 | 15.5 | 0.04 | 14.87 | 0.06 | 11.69 | 0.2 | ||||||
| PSO J090.7002-25.7674 | 5 | 66 | 21.5 | 0.04 | 21.4 | 0.4 | 20.23 | 0.02 | 20.07 | 0.05 | 19.4 | 0.06 | ||
| M060958.94+021727.1 | 201.5 | 17.7 | 17.0 | - | 0.174 | SALT | G | |||||||
| J060958.97+021726.5 | 92.4957371 | 2.2907017 | 13.38 | 0.03 | 12.22 | 0.02 | 8.29 | 0.02 | ||||||
| PSO J092.4957+02.2907 | 5 | 69 | 21.31 | 0.06 | 19.85 | 0.03 | 18.6 | 0.02 | 18.86 | 0.03 | 18.58 | 0.04 | ||
| M061038.80-230145.6 | 360.2 | 16.5 | 16.0 | - | 2.829 | SALT | Q | |||||||
| J061038.78-230145.7 | 92.6615979 | -23.0293781 | 15.33 | 0.04 | 14.36 | 0.05 | 10.74 | 0.1 | ||||||
| PSO J092.6616-23.0294 | 5 | 67 | 18.62 | 0.01 | 18.47 | 0 | 18.35 | 0 | 18.27 | 0.01 | 18.14 | 0.01 | ||
| M061856.02-315835.2 | 346.1 | 16.5 | 15.7 | - | 2.134 | SALT | Q | |||||||
| J061856.00-315835.0 | 94.7333346 | -31.97639 | 15.76 | 0.04 | 14.75 | 0.05 | 11.25 | 0.1 | ||||||
| - | - | - | - | - | - | - | - | - | - | - | - | - | ||
| M063602.28-311312.5 | 262.1 | 16.6 | 14.3 | - | 2.654 | SALT | Q | |||||||
| J063602.35-311311.8 | 99.0098305 | -31.2199453 | 13.88 | 0.03 | 12.77 | 0.03 | 9.39 | 0.03 | ||||||
| - | - | - | - | - | - | - | - | - | - | - | - | - | ||
| M063613.53-310646.3 | 208 | 17.7 | 15.4 | - | 2.757 | SALT | Q | |||||||
| J063613.49-310644.1 | 99.0562279 | -31.1122649 | 16.73 | 0.08 | 15.74 | 0.12 | 12.37 | - | ||||||
| - | - | - | - | - | - | - | - | - | - | - | - | - | ||
| M065254.73-323022.6 | 322.1 | 25.4 | 17.7 | -34.8 | 2.239 | SALT | Q | |||||||
| J065254.55-323020.7 | 103.2273249 | -32.5057682 | 14.86 | 0.03 | 14.08 | 0.04 | 10.9 | 0.1 | ||||||
| - | - | - | - | - | - | - | - | - | - | - | - | - | ||
| M070249.30-330205.0 | 314.6 | 16.9 | 15.8 | - | 2.410 | SALT | Q | |||||||
| J070249.28-330204.2 | 105.7053378 | -33.0345087 | 16.36 | 0.06 | 15.57 | 0.10 | 11.91 | - | ||||||
| - | - | - | - | - | - | - | - | - | - | - | - | - | ||
| M073159.01+143336.3 | 316.5 | 17.9 | 15.8 | - | 2.632 | NOT | Q | |||||||
| J073158.97+143335.8 | 112.9957193 | 14.5599667 | 15.49 | 0.05 | 14.76 | 0.07 | 11.01 | 0.14 | ||||||
| PSO J112.9958+14.5601 | 5 | 58 | 18.54 | 0.02 | 18.43 | 0.01 | 18.28 | 0.01 | 18.26 | 0.03 | 18.14 | 0.01 | ||
| M073714.60-382841.9 | 219.3 | 14.2 | 16.7 | -17 | 2.107 | SALT | Q | |||||||
| J073714.61-382839.3 | 114.3108811 | -38.4776064 | 15.41 | 0.04 | 14.19 | 0.04 | 10.88 | 0.08 | ||||||
| - | - | - | - | - | - | - | - | - | - | - | - | - | ||
| M073748.06-381259.0 | 2436.5 | 18.2 | 18.9 | 35.4 | 0.318 | SALT | G | |||||||
| J073748.12-381257.6 | 114.4505408 | -38.2160133 | 14.25 | 0.03 | 13.14 | 0.03 | 9.9 | 0.05 | ||||||
| - | - | - | - | - | - | - | - | - | - | - | - | - | ||
| M080217.91+080525.4 | 210.5 | 18.3 | 15.9 | - | 0.995 | SALT | Q | |||||||
| J080217.84+080524.7 | 120.5743551 | 8.0902184 | 16.24 | 0.07 | 15.44 | 0.11 | 12.45 | 0.51 | ||||||
| PSO J120.5743+08.0903 | 5 | 63 | 20.99 | 0.12 | 20.86 | 0.05 | 20.73 | 0.05 | 20.48 | 0.04 | 19.96 | 0.12 | ||
| M080356.46+042102.8∗c | 318.1 | 17.0 | 16.4 | - | 1.252 | SALT | Q | |||||||
| J080356.43+042102.6 | 120.9851521 | 4.3507431 | 15.27 | 0.04 | 14.14 | 0.04 | 10.86 | 0.11 | ||||||
| PSO J120.9852+04.3508 | 5 | 76 | 19.22 | 0.02 | 18.94 | 0.02 | 18.87 | 0.01 | 18.88 | 0.02 | 18.9 | 0.03 | ||
| M080804.34+005708.2 | 317 | 17.2 | 16.5 | - | 3.133 | SALT | Q | |||||||
| J080804.34+005707.6 | 122.0181055 | 0.9521212 | 15.31 | 0.04 | 14.38 | 0.05 | 10.58 | 0.1 | ||||||
| PSO J122.0181+00.9521 | 5 | 72 | 18.47 | 0.01 | 18.27 | 0.01 | 18.07 | 0 | 18.12 | 0.01 | 18.04 | 0.03 | ||
| M081727.59-030737.7 | 502.7 | 16.6 | 15.4 | - | 1.785 | SALT | Q | |||||||
| J081727.45-030737.2 | 124.3644078 | -3.1270117 | 14.9 | 0.03 | 14.21 | 0.04 | 10.95 | 0.13 | ||||||
| PSO J124.3645-03.1270 | 5 | 42 | 18.61 | 0.08 | 18.69 | 0.01 | 18.25 | 0.01 | 18.25 | 0.05 | 18.02 | 0.04 | ||
| M081936.62-063047.9∗a | 280 | 18.1 | 16.3 | - | 2.507 | SALT | Q | |||||||
| J081936.63-063048.4 | 124.9026465 | -6.5134706 | 15.56 | 0.04 | 14.66 | 0.06 | 11.11 | 0.15 | ||||||
| PSO J124.9027-06.5134 | 5 | 65 | 19.79 | 0.06 | 19.88 | 0.03 | 19.38 | 0.03 | 19.33 | 0.03 | 19.2 | 0.04 | ||
| M082638.44-032426.4 | 221.9 | 18.3 | 16.9 | - | 0.437 | SALT | G | |||||||
| J082638.42-032427.2 | 126.6601067 | -3.407575 | 15.49 | 0.04 | 14.77 | 0.07 | 11.63 | 0.28 | ||||||
| PSO J126.6601-03.4076 | 0 | 79 | 20.29 | 0.05 | 20.36 | 0.03 | 19.57 | 0.02 | 19.61 | 0.04 | 19.26 | 0.05 | ||
| M083601.35+040636.0 | 435.3 | 18.2 | 15.7 | - | 0.743 | SUGAR | G | |||||||
| J083601.33+040637.4 | 129.005552 | 4.1104025 | 15.52 | 0.05 | 14.91 | 0.07 | 11.86 | - | ||||||
| PSO J129.0057+04.1100 | 5 | 28 | -999 | -999 | 21.52 | 0.07 | 21.31 | 0.08 | 20.47 | 0.1 | 20.4 | 0.18 | ||
| M083608.59-133635.1 | 919.2 | 48 | 18.2 | -63 | 0.160 | SALT | G | |||||||
| J083608.56-133634.3 | 129.0356672 | -13.6095406 | 14.01 | 0.03 | 13.18 | 0.03 | 9.82 | 0.06 | ||||||
| PSO J129.0356-13.6095 | 5 | 78 | 19.56 | 0.03 | 18.65 | 0.03 | 18.23 | 0.02 | 18.04 | 0.04 | 17.81 | 0.03 | ||
| M085826.92-260721.0 | 404.5 | 18.6 | 17.2 | - | 2.036 | SALT | Q | |||||||
| J085826.85-260720.9 | 134.6118804 | -26.12249 | 15.47 | 0.04 | 14.33 | 0.04 | 11.04 | 0.12 | ||||||
| PSO J134.6118-26.1225 | 5 | 67 | 19.27 | 0.02 | 19.09 | 0.02 | 18.72 | 0.01 | 18.44 | 0.02 | 18.51 | 0.02 | ||
| M090337.99-311739.0 | 209.5 | 16.6 | 15.7 | - | 1.670 | SALT | Q | |||||||
| J090337.92-311739.0 | 135.9080123 | -31.2941691 | 16.68 | 0.08 | 15.76 | 0.12 | 12.12 | 0.32 | ||||||
| - | - | - | - | - | - | - | - | - | - | - | - | - | - | |
| M090910.66-163753.8 | 340.1 | 15.7 | 13.9 | - | 2.475 | SUGAR | Q | |||||||
| J090910.56-163756.3 | 137.2940394 | -16.6323287 | 15.87 | 0.06 | 15.2 | 0.09 | 11.84 | - | ||||||
| PSO J137.2937-16.6327 | 6 | 2 | -999 | -999 | -999 | -999 | 21.67 | 0.16 | -999 | -999 | -999 | -999 | ||
| M090911.33-313334.1 | 610.1 | 50 | 16.7 | -65.4 | 0.884 | SALT | G | |||||||
| J090911.50-313335.3 | 137.2979271 | -31.5598218 | 16.98 | 0.1 | 16.27 | 0.19 | 12.63 | - | ||||||
| - | - | - | - | - | - | - | - | - | - | - | - | - | - | |
| M090916.99-050053.2 | 457.2 | 16.7 | 15.4 | - | 0.404 | SUGAR | G | |||||||
| J090917.01-050052.5 | 137.3208807 | -5.0146108 | 15.68 | 0.05 | 15 | 0.08 | 11.75 | 0.26 | ||||||
| PSO J137.3209-05.0147 | 5 | 41 | 22.05 | 0.06 | 20.77 | 0.1 | 20.21 | 0.07 | 19.9 | 0.04 | 19.8 | 0.06 | ||
| M091051.01-052626.8 | 337.9 | 15.8 | 15.5 | 2.8 | 2.395 | SUGAR | Q | |||||||
| J091050.99-052629.1 | 137.7124859 | -5.4414291 | 14.57 | 0.03 | 13.61 | 0.04 | 10.46 | 0.08 | ||||||
| PSO J137.7125-05.4414 | 5 | 83 | 18.24 | 0.01 | 18.03 | 0.02 | 17.86 | 0.01 | 17.73 | 0.01 | 17.48 | 0.02 | ||
| M091253.34-135241.9∗c | 255.7 | 16.5 | 16.3 | - | 1.088 | SALT | Q | |||||||
| J091253.36-135242.1 | 138.2223389 | -13.8783827 | 15.62 | 0.04 | 14.98 | 0.07 | 11.9 | 0.24 | ||||||
| PSO J138.2222-13.8785 | 5 | 38 | 21.29 | 0.07 | 20.83 | 0.09 | 20.62 | 0.13 | 20.56 | 0.1 | 19.99 | 0.09 | ||
| M092902.69-293020.8 | 899.6 | 18.8 | 17.4 | - | 0.749 | SALT | G | |||||||
| J092902.70-293019.9 | 142.2612874 | -29.5055398 | 15.52 | 0.04 | 14.48 | 0.05 | 9.44 | 0.04 | ||||||
| PSO J142.2613-29.5055 | 5 | 27 | 21.67 | 0.08 | 20.75 | 0.05 | 20.78 | 0.07 | 19.03 | 0.01 | 20.17 | 0.07 | ||
| M092956.48+014843.8 | 248.7 | 18.2 | 17.2 | - | 2.331 | SALT | Q | |||||||
| J092956.47+014844.2 | 142.485295 | 1.8123026 | 15.19 | 0.04 | 14.34 | 0.05 | 11.18 | 0.14 | ||||||
| PSO J142.4852+01.8123 | 5 | 59 | 20.2 | 0.05 | 19.9 | 0.03 | 19.23 | 0.03 | 18.9 | 0.02 | 18.64 | 0.02 | ||
| M093919.21-173135.4 | 263.3 | 16.1 | 15.3 | - | 1.831 | SUGAR | Q | |||||||
| J093919.19-173135.6 | 144.8299719 | -17.5265832 | 15.19 | 0.04 | 14.07 | 0.04 | 10.67 | 0.08 | ||||||
| PSO J144.8300-17.5266 | 10 | 48 | 21.63 | 0.1 | 19.88 | 0.14 | 21 | 0.05 | 20.7 | 0.12 | 18.93 | 0.02 | ||
| M094040.47-002800.1 | 359.3 | 17.1 | 16.1 | - | 2.383 | SALT | Q | |||||||
| J094040.47-002801.4 | 145.1686386 | -0.4670779 | 16.51 | 0.09 | 15.88 | 0.16 | 12 | - | ||||||
| PSO J145.1686-00.4670 | 5 | 56 | 19.45 | 0.02 | 20 | 0.07 | 19.89 | 0.05 | 19.54 | 0.05 | 19.26 | 0.08 | ||
| M094146.01-032121.7 | 346.2 | 18.5 | 17.5 | - | 1.848 | SUGAR | Q | |||||||
| J094145.98-032121.7 | 145.4415998 | -3.3560372 | 16.59 | 0.09 | 15.77 | 0.14 | 11.94 | - | ||||||
| PSO J145.4417-03.3561 | 4 | 17 | 21.22 | 0.09 | 21.01 | 0.01 | 20.6 | 0.02 | 20.53 | 0.04 | -999 | -999 | ||
| M095138.34-060138.0 | 378.8 | 18.4 | 16.1 | - | 1.844 | SUGAR | Q | |||||||
| J095138.35-060137.5 | 147.9098297 | -6.0270882 | 16.27 | 0.07 | 15.46 | 0.13 | 11.95 | - | ||||||
| PSO J147.9098-06.0271 | 5 | 51 | 20.38 | 0.02 | 20.18 | 0.06 | 19.6 | 0.02 | 19.75 | 0.03 | 19.44 | 0.09 | ||
| M095231.66-245349.1 | 209.5 | 15.0 | 14.0 | - | 2.626 | SALT | Q | |||||||
| J095231.67-245351.0 | 148.1319654 | -24.8975143 | 15.98 | 0.05 | 15.13 | 0.08 | 12.01 | 0.27 | ||||||
| PSO J148.1319-24.8975 | 5 | 62 | 19.18 | 0.02 | 19.01 | 0.01 | 19.06 | 0.01 | 18.84 | 0.02 | 18.67 | 0.06 | ||
| M095423.67+004350.5∗b | 291.6 | 19.8 | 17.6 | - | 1.712 | SALT | Q | |||||||
| J095423.72+004351.3 | 148.5988716 | 0.7309207 | 15.93 | 0.06 | 14.88 | 0.08 | 11.71 | 0.26 | ||||||
| PSO J148.5989+00.7310 | 5 | 62 | 20.67 | 0.04 | 20 | 0.06 | 19.74 | 0.04 | 19.63 | 0.05 | 19.52 | 0.14 | ||
| M095654.60-131718.1∗c | 216 | 26 | 16.6 | -86.4 | 1.198 | SALT | Q | |||||||
| J095654.65-131718.7 | 149.2277088 | -13.2885524 | 16.19 | 0.05 | 15.24 | 0.08 | 12.04 | 0.48 | ||||||
| PSO J149.2276-13.2884 | 0 | 4 | -999 | -999 | 21.42 | 0.16 | 21.69 | 0.2 | -999 | -999 | -999 | -999 | ||
| M100715.18-124746.7 | 381.1 | 15.7 | 15.4 | - | 2.113 | SALT | Q | |||||||
| J100715.22-124745.9 | 151.8134506 | -12.7961 | 15.38 | 0.04 | 14.24 | 0.05 | 11.01 | 0.12 | ||||||
| PSO J151.8134-12.7961 | 10 | 74 | 18.4 | 0.01 | 18.28 | 0 | 18.18 | 0.01 | 18 | 0.01 | 18.07 | 0.02 | ||
| M100743.51-181732.4 | 205.2 | 49.2 | 19.5 | 84.6 | 0.493 | NOT | G | |||||||
| J100743.58-181731.1 | 151.9316084 | -18.2919748 | 14.96 | 0.03 | 14.22 | 0.05 | 10.16 | 0.06 | ||||||
| PSO J151.9316-18.2919 | 5 | 60 | 21.56 | 0.06 | 20.37 | 0.05 | 19.63 | 0.03 | 19.54 | 0.04 | 19.29 | 0.03 | ||
| M100802.27-095919.3 | 645.3 | 15.7 | 18.6 | -82 | 1.688 | NOT | Q | |||||||
| J100802.30-095919.8 | 152.0095896 | -9.9888589 | 15.7 | 0.05 | 14.55 | 0.06 | 11.24 | 0.19 | ||||||
| PSO J152.0098-09.9888 | 10 | 78 | 19.34 | 0.02 | 19.35 | 0.04 | 19.3 | 0.04 | 19.04 | 0.01 | 19.01 | 0.02 | ||
| M100954.53+160203.8 | 201.9 | 15.9 | 15.2 | - | 1.770 | NOT | Q | |||||||
| J100954.55+160203.4 | 152.4772922 | 16.0342888 | 16.09 | 0.06 | 15.18 | 0.10 | 11.57 | 0.25 | ||||||
| PSO J152.4773+16.0343 | 5 | 83 | 20.88 | 0.02 | 20.74 | 0.02 | 20.55 | 0.02 | 20.36 | 0.03 | 20 | 0.06 | ||
| M101313.10-254654.7 | 248.8 | 16.0 | 14.0 | - | 2.965 | SALT | Q | |||||||
| J101313.09-254654.7 | 153.3045753 | -25.7818673 | 17.14 | 0.12 | 15.98 | 0.15 | 12.12 | - | ||||||
| PSO J153.3046-25.7819 | 5 | 13 | 21.6 | 0.08 | 21.12 | 0.08 | 20.82 | 0.01 | 20.55 | 0.21 | 19.32 | 0.06 | ||
| M101357.73-245933.6 | 255 | 18.7 | 15.6 | - | 1.814 | SALT | Q | |||||||
| J101357.81-245932.9 | 153.4908974 | -24.9924937 | 16.67 | 0.09 | 15.53 | 0.10 | 12.07 | - | ||||||
| PSO J153.4909-24.9925 | 5 | 59 | 20.1 | 0.03 | 20.22 | 0.02 | 19.92 | 0.03 | 19.79 | 0.04 | 19.52 | 0.05 | ||
| M101555.33-082245.7 | 250.5 | 18.6 | 16.4 | - | 1.430 | SALT | Q | |||||||
| J101555.39-082245.5 | 153.9808222 | -8.3793266 | 17.95 | 0.27 | 16.04 | 0.19 | 11.74 | 0.27 | ||||||
| PSO J153.9809-08.3794 | 5 | 28 | 22.19 | 0.14 | 21.55 | 0.06 | 21.46 | 0.05 | 20.84 | 0.05 | -999 | -999 | ||
| M102159.78-011002.4 | 500.6 | 16.1 | 14.0 | - | 1.493 | SALT | Q | |||||||
| J102159.77-011002.5 | 155.4990517 | -1.1673705 | 15.72 | 0.05 | 15.01 | 0.09 | 11.92 | 0.33 | ||||||
| PSO J155.4990-01.1674 | 3 | 44 | 21.6 | 0.07 | 20.97 | 0.08 | 20.49 | 0.04 | 20.13 | 0.04 | 19.54 | 0.09 | ||
| M102441.29-153025.2 | 226.3 | 16.9 | 16.7 | - | 0.792 | SALT | Q | |||||||
| J102441.30-153026.3 | 156.1720931 | -15.5073221 | 15.39 | 0.04 | 14.44 | 0.05 | 11.25 | 0.17 | ||||||
| PSO J156.1721-15.5073 | 5 | 58 | 20.23 | 0.03 | 19.88 | 0.02 | 19.67 | 0.02 | 19.3 | 0.02 | 19.33 | 0.03 | ||
| M102444.61-085206.4 | 463.8 | 39.3 | 19.1 | -29.8 | 0.455 | SUGAR | G | |||||||
| J102444.56-085205.9 | 156.1856868 | -8.8683093 | 16.36 | 0.07 | 15.58 | 0.12 | 12.51 | 0.49 | ||||||
| PSO J156.1857-08.8684 | 5 | 44 | -999 | -999 | 21.28 | 0.04 | 20.57 | 0.04 | 20.44 | 0.02 | 19.65 | 0.16 | ||
| M102548.78-042933.7 | 363.5 | 16.5 | 15.9 | - | 2.292 | SALT | Q | |||||||
| J102548.76-042933.0 | 156.4531736 | -4.4925229 | 16.25 | 0.07 | 15.47 | 0.11 | 12.11 | - | ||||||
| PSO J156.4532-04.4924 | 5 | 75 | 19.57 | 0.01 | 19.75 | 0.03 | 19.66 | 0.02 | 19.45 | 0.02 | 19.31 | 0.04 | ||
| M103051.52-092525.0∗d | 890.9 | 17.5 | 15.5 | - | 0.413 | SALT | G | |||||||
| J103051.50-092523.8 | 157.7146096 | -9.4232841 | 16.16 | 0.06 | 15.32 | 0.09 | 12.03 | - | ||||||
| - | - | - | - | - | - | - | - | - | - | - | - | - | ||
| M103335.61-121032.1 | 2065.1 | 14.3 | 17.3 | -46.2 | 1.328 | NOT | G | |||||||
| J103335.62-121032.0 | 158.3984486 | -12.1755657 | 16.59 | 0.08 | 15.8 | 0.13 | 11.7 | 0.23 | ||||||
| PSO J158.3981-12.1757 | 5 | 47 | 21.1 | 0.03 | 21.01 | 0.03 | 20.97 | 0.03 | 20.74 | 0.04 | -999 | -999 | ||
| M104051.07-144919.4 | 269.6 | 17.4 | 17.0 | - | 1.526 | SALT | Q | |||||||
| J104051.04-144918.9 | 160.2126978 | -14.8219317 | 17.2 | 0.13 | 16.44 | 0.25 | 12.61 | - | ||||||
| PSO J160.2126-14.8219 | 5 | 54 | 21.41 | 0.05 | 20.95 | 0.05 | 20.72 | 0.08 | 20.68 | 0.05 | 20.28 | 0.08 | ||
| M104314.53-232317.5 | 212.1 | 19.7 | 14.7 | - | 2.881 | SALT | Q | |||||||
| J104314.52-232319.3 | 160.8105239 | -23.3886967 | 16.57 | 0.08 | 15.95 | 0.16 | 12.14 | - | ||||||
| PSO J160.8104-23.3886 | 5 | 54 | 19.9 | 0.05 | 19.72 | 0.03 | 19.72 | 0.02 | 19.62 | 0.08 | 19.35 | 0.06 | ||
| M104347.34+164106.9 | 259.1 | 16.4 | 15.7 | - | 0.399 | NOT | G | |||||||
| J104347.32+164107.4 | 160.9471896 | 16.6854078 | 15.82 | 0.05 | 15.19 | 0.12 | 11.74 | - | ||||||
| PSO J160.9472+16.6854 | 5 | 58 | 22.21 | 0.05 | 21.24 | 0.05 | 20.54 | 0.03 | 20.06 | 0.04 | 19.8 | 0.11 | ||
| M105024.43-031808.8 | 243.5 | 18.3 | 16.3 | - | 1.813 | SUGAR | Q | |||||||
| J105024.49-031808.4 | 162.6020829 | -3.302339 | 15.25 | 0.04 | 14.06 | 0.04 | 10.77 | 0.1 | ||||||
| PSO J162.6021-03.3023 | 5 | 59 | 19.07 | 0.01 | 18.85 | 0.01 | 18.54 | 0 | 18.59 | 0.02 | 18.5 | 0.04 | ||
| M105955.36-111818.7 | 314.5 | 16.5 | 14.1 | - | 1.939 | SUGAR | Q | |||||||
| J105955.37-111818.2 | 164.9807386 | -11.3050771 | 16.6 | 0.09 | 15.71 | 0.14 | 12.18 | - | ||||||
| PSO J164.9808-11.3051 | 5 | 62 | 20.43 | 0.05 | 20.61 | 0.06 | 20.2 | 0.02 | 19.83 | 0.03 | 19.6 | 0.12 | ||
| M111820.61-305459.0 | 233.2 | 16.9 | 15.6 | - | 2.352 | SALT | Q | |||||||
| J111820.61-305458.5 | 169.5859042 | -30.9162666 | 14.8 | 0.03 | 13.99 | 0.04 | 10.63 | 0.1 | ||||||
| - | - | - | - | - | - | - | - | - | - | - | - | - | ||
| M111917.36-052707.9 | 1174.4 | 14.7 | 18.6 | 38.7 | 2.651 | SUGAR | Q | |||||||
| J111917.40-052707.5 | 169.8225305 | -5.4521081 | 16.58 | 0.09 | 15.94 | 0.17 | 11.65 | - | ||||||
| PSO J169.8226-05.4520 | 5 | 54 | 20.47 | 0.02 | 20.26 | 0.03 | 20.2 | 0.02 | 19.94 | 0.04 | 19.62 | 0.09 | ||
| M112402.56-150159.1 | 261.9 | 17.0 | 16.4 | - | 2.551 | SUGAR | Q | |||||||
| J112402.53-150158.7 | 171.0105586 | -15.0329758 | 16.65 | 0.09 | 15.77 | 0.15 | 11.87 | 0.3 | ||||||
| PSO J171.0107-15.0330 | 5 | 57 | 19.79 | 0.05 | 19.61 | 0.01 | 19.72 | 0.02 | 19.56 | 0.03 | 19.45 | 0.05 | ||
| M113750.46-153458.7 | 241.1 | 17.9 | 14.0 | - | 1.496 | SALT | Q | |||||||
| J113750.49-153457.8 | 174.4604049 | -15.5827307 | 16.46 | 0.08 | 15.15 | 0.09 | 11.78 | 0.26 | ||||||
| PSO J174.4603-15.5827 | 10 | 78 | 19.88 | 0.05 | 19.69 | 0.02 | 19.55 | 0.03 | 19.48 | 0.03 | 19.63 | 0.05 | ||
| M114226.58-263313.7 | 294.7 | 18.1 | 15.9 | - | 3.237 | SALT | Q | |||||||
| J114226.59-263313.0 | 175.6107945 | -26.5536221 | 15.6 | 0.04 | 14.86 | 0.07 | 11.54 | 0.21 | ||||||
| PSO J175.6107-26.5536 | 10 | 56 | 18.9 | 0.02 | 18.73 | 0.01 | 18.76 | 0.01 | 18.74 | 0.01 | 18.61 | 0.08 | ||
| M114825.45+140449.7 | 322 | 17.8 | 17.1 | - | 0.727 | NOT | G | |||||||
| J114825.54+140451.1 | 177.106422 | 14.0808677 | 16.27 | 0.07 | 15.61 | 0.14 | 11.79 | - | ||||||
| PSO J177.1060+14.0803 | 3 | 15 | -999 | -999 | 21.65 | 0.16 | 21.68 | 0.04 | 20.62 | 0.05 | -999 | -999 | ||
| M115043.70+131736.1 | 254.4 | 17.5 | 16.5 | - | 1.530 | NOT | Q | |||||||
| J115043.60+131735.3 | 177.6817055 | 13.2931528 | 16.31 | 0.07 | 15.24 | 0.10 | 12.02 | 0.36 | ||||||
| PSO J177.6817+13.2931 | 5 | 71 | 19.76 | 0.04 | 19.77 | 0.04 | 19.51 | 0.04 | 19.58 | 0.03 | 19.42 | 0.06 | ||
| M115222.04-270126.3 | 238.2 | 17.7 | 15.4 | - | 2.703 | SALT | Q | |||||||
| J115222.02-270126.1 | 178.0917554 | -27.0239355 | 16.93 | 0.1 | 16.16 | 0.18 | 12.4 | - | ||||||
| PSO J178.0919-27.0238 | 5 | 37 | 21.01 | 0.04 | 20.97 | 0.07 | 20.9 | 0.05 | 20.76 | 0.11 | -999 | -999 | ||
| M115306.72-044254.5 | 684.8 | 19.3 | 17.9 | - | 2.591 | SALT | Q | |||||||
| J115306.66-044255.8 | 178.2777737 | -4.7155199 | 14.96 | 0.04 | 14.04 | 0.04 | 10.41 | 0.08 | ||||||
| PSO J178.2777-04.7155 | 5 | 76 | 18.68 | 0.02 | 18.33 | 0.02 | 18.29 | 0.01 | 18.04 | 0.01 | 17.89 | 0.01 | ||
| M115450.38-281249.7∗c | 444.5 | 18.3 | 17.2 | - | 0.897 | SALT | Q | |||||||
| J115450.43-281251.0 | 178.7101313 | -28.2141796 | 16.47 | 0.08 | 15.54 | 0.11 | 12.08 | 0.41 | ||||||
| PSO J178.7101-28.2141 | 5 | 53 | 20.48 | 0.06 | 20.32 | 0.03 | 19.98 | 0.02 | 19.91 | 0.04 | 19.77 | 0.05 | ||
| M120632.23-071452.6 | 698.8 | 16.9 | 15.6 | - | 2.263 | NOT | Q | |||||||
| J120632.18-071453.1 | 181.634117 | -7.2480922 | 16.03 | 0.06 | 15.41 | 0.13 | 11.68 | 0.3 | ||||||
| PSO J181.6341-07.2481 | 5 | 68 | 19.69 | 0.01 | 19.67 | 0.03 | 19.57 | 0.04 | 19.38 | 0.03 | 19.31 | 0.04 | ||
| M121059.72-162042.7 | 328.3 | 19.2 | 17.0 | - | 1.083 | SALT | Q | |||||||
| J121059.64-162043.4 | 182.7485411 | -16.345399 | 16.83 | 0.11 | 15.99 | 0.17 | 12.43 | 0.51 | ||||||
| PSO J182.7487-16.3454 | 5 | 55 | 21.63 | 0.04 | 21.27 | 0.04 | 20.68 | 0.03 | 20.39 | 0.03 | 19.81 | 0.08 | ||
| M121211.89-373826.9 | 343.4 | 18.1 | 16.4 | - | 1.9243 | SALT | Q | |||||||
| J121211.96-373826.5 | -37.6407047 | 183.0498351 | 15.89 | 0.04 | 15.01 | 0.06 | 11.77 | 0.18 | ||||||
| - | - | - | - | - | - | - | - | - | - | - | - | - | ||
| M121514.42-062803.5 | 360.4 | 18.5 | 13.9 | - | 3.218 | SUGAR | Q | |||||||
| J121514.39-062803.7 | 183.8099607 | -6.4677219 | 15.78 | 0.06 | 15.01 | 0.11 | 11.76 | - | ||||||
| PSO J183.8100-06.4678 | 5 | 50 | 19.88 | 0.02 | 19.74 | 0.03 | 19.68 | 0.04 | 19.5 | 0.06 | 19.26 | 0.04 | ||
| M121836.18-063115.8 | 409.1 | 17.2 | 16.6 | - | 0.658 | SUGAR | Q | |||||||
| J121836.19-063116.9 | 184.6508305 | -6.5213777 | 14.35 | 0.03 | 13.5 | 0.04 | 10.41 | 0.08 | ||||||
| PSO J184.6508-06.5213 | 5 | 63 | 18.84 | 0.03 | 18.84 | 0.02 | 18.71 | 0.02 | 18.64 | 0.03 | 18.85 | 0.04 | ||
| M121905.45-180911.2 | 300.3 | 17.5 | 15.6 | - | 0.189 | NOT | G | |||||||
| J121905.43-180910.9 | 184.7726392 | -18.1530363 | 14.8 | 0.03 | 14.15 | 0.04 | 11.26 | 0.16 | ||||||
| PSO J184.7726-18.1531 | 5 | 76 | 20.16 | 0.02 | 19.19 | 0.02 | 18.73 | 0.01 | 18.44 | 0.02 | 18.32 | 0.02 | ||
| M122123.49-123724.1 | 343.7 | 14.5 | 15.7 | 85.1 | 1.882 | NOT | Q | |||||||
| J122123.57-123723.0 | 185.3482462 | -12.6230677 | 15.67 | 0.05 | 14.79 | 0.07 | 11.77 | 0.25 | ||||||
| PSO J185.3482-12.6230 | 5 | 59 | 19.77 | 0.02 | 19.47 | 0.04 | 19.01 | 0.01 | 18.9 | 0.01 | 18.81 | 0.03 | ||
| M123150.30-123637.5 | 276 | 16.3 | 15.6 | - | 2.106 | SUGAR | Q | |||||||
| J123150.26-123636.8 | 187.9594437 | -12.6102438 | 15 | 0.04 | 13.86 | 0.04 | 10.42 | 0.1 | ||||||
| PSO J187.9594-12.6103 | 5 | 66 | 19.07 | 0.02 | 18.83 | 0.01 | 18.58 | 0.01 | 18.33 | 0.01 | 18.18 | 0.02 | ||
| M123410.08-332638.5 | 297.9 | 19.9 | 16.1 | - | 2.820 | SALT | Q | |||||||
| J123409.97-332638.7 | 188.5415468 | -33.4441047 | 17.59 | 0.15 | 16.75 | 0.29 | 12.83 | - | ||||||
| - | - | - | - | - | - | - | - | - | - | - | - | - | ||
| M124448.99-044610.2 | 384.9 | 16.8 | 13.9 | - | 3.104 | SALT | Q | |||||||
| J124449.01-044608.8 | 191.2042373 | -4.7691286 | 16.25 | 0.07 | 15.58 | 0.12 | 11.92 | 0.31 | ||||||
| PSO J191.2043-04.7692 | 5 | 55 | 20.84 | 0.02 | 20.58 | 0.02 | 20.46 | 0.03 | 20.43 | 0.04 | 19.9 | 0.1 | ||
| M125215.28-310351.2 | 331.6 | 17.9 | 16.0 | - | 1.943 | SALT | Q | |||||||
| J125215.17-310351.2 | 193.0632173 | -31.0642344 | 16.47 | 0.07 | 15.44 | 0.09 | 12.14 | 0.26 | ||||||
| - | - | - | - | - | - | - | - | - | - | - | - | - | ||
| M125442.98-383356.4 | 219.2 | 18.8 | 17.6 | - | 2.776 | SALT | Q | |||||||
| J125443.00-383357.3 | 193.6791669 | -38.5659343 | 17.07 | 0.1 | 16.07 | 0.15 | 12.52 | 0.42 | ||||||
| - | - | - | - | - | - | - | - | - | - | - | - | - | ||
| M125611.49-214411.7 | 260.7 | 15.2 | 15.2 | - | 2.178 | SALT | Q | |||||||
| J125611.41-214410.9 | 194.0475791 | -21.7363772 | 14.55 | 0.03 | 13.77 | 0.04 | 10.8 | 0.09 | ||||||
| PSO J194.0476-21.7363 | 5 | 73 | 18.8 | 0.01 | 18.32 | 0.01 | 17.96 | 0.01 | 17.69 | 0.01 | 17.68 | 0.02 | ||
| M130457.29-015457.7 | 325.8 | 17.0 | 15.6 | - | 2.100 | SALT | Q | |||||||
| J130457.38-015458.6 | 196.2391148 | -1.9162803 | 16.68 | 0.1 | 15.76 | 0.17 | 12.49 | 0.45 | ||||||
| PSO J196.2389-01.9163 | 5 | 46 | 20.6 | 0.02 | 20.67 | 0.02 | 20.54 | 0.05 | 20.07 | 0.03 | 20.13 | 0.04 | ||
| M130958.32+073217.5 | 205 | 16.8 | 15.2 | - | 0.487 | SALT | G | |||||||
| J130958.33+073217.3 | 197.4930738 | 7.5381498 | 16.2 | 0.06 | 15.21 | 0.09 | 11.38 | 0.18 | ||||||
| PSO J197.4931+07.5382 | 5 | 16 | -999 | -999 | 21.63 | 0.15 | 21.41 | 0.07 | 21.08 | 0.1 | 20.26 | -999 | ||
| M131139.29-221641.2∗d | 4093 | 17.7 | 16.6 | - | 0.885 | SALT | Q | |||||||
| J131139.34-221642.1 | 197.913957 | -22.2783632 | 15.63 | 0.04 | 14.97 | 0.07 | 11.94 | 0.27 | ||||||
| PSO J197.9139-22.2782 | 5 | 39 | 21.86 | 0.17 | 21.56 | 0.09 | 20.73 | 0.03 | 20.33 | 0.04 | 19.53 | 0.06 | ||
| M131207.86-202652.4∗f | 778.1 | 19.6 | 16.5 | - | 0.977 | SALT | G | |||||||
| J131207.85-202652.8 | 198.032746 | -20.448026 | 16.51 | 0.08 | 15.76 | 0.13 | 12.64 | 0.42 | ||||||
| PSO J198.0328-20.4480 | 3 | 4 | -999 | -999 | -999 | -999 | 21.58 | 0.19 | 20.88 | 0.34 | -999 | -999 | ||
| M131301.41-272258.6 | 239.3 | 14.9 | 16.3 | 41.8 | 1.567 | SALT | Q | |||||||
| J131301.42-272258.7 | 198.2559293 | -27.3829913 | 15.54 | 0.05 | 14.47 | 0.05 | 11.16 | 0.13 | ||||||
| PSO J198.2559-27.3830 | 5 | 38 | 21.45 | 0.05 | 21.03 | 0.12 | 20.77 | 0.08 | 20.23 | 0.04 | 19.79 | 0.06 | ||
| M131517.56-274504.0 | 468.4 | 40.1 | 18.0 | 17 | 1.912 | SALT | G | |||||||
| J131517.61-274505.1 | 198.823416 | -27.7514337 | 16.86 | 0.09 | 15.96 | 0.15 | 12.12 | 0.28 | ||||||
| - | - | - | - | - | - | - | - | - | - | - | - | - | - | |
| M131736.55-134532.8 | 244.5 | 19.3 | 16.3 | - | 1.407 | SALT | Q | |||||||
| J131736.56-134532.6 | 199.4023338 | -13.7590663 | 15.64 | 0.04 | 14.47 | 0.05 | 11.1 | 0.12 | ||||||
| PSO J199.4022-13.7591 | 5 | 52 | 20.55 | 0.06 | 20.22 | 0.02 | 20.21 | 0.03 | 20.1 | 0.05 | 19.81 | 0.1 | ||
| M131856.01-144155.0 | 283 | 20.1 | 17.8 | 51.3 | 0.632 | NOT | Q | |||||||
| J131856.07-144154.4 | 199.7336621 | -14.6984528 | 15.14 | 0.03 | 14.08 | 0.04 | 10.67 | 0.09 | ||||||
| PSO J199.7336-14.6985 | 5 | 68 | 19.73 | 0.07 | 19.63 | 0.02 | 19.28 | 0.02 | 19.51 | 0.04 | 19.43 | 0.04 | ||
| M132333.24-223934.5 | 276.1 | 19.7 | 16.1 | - | 1.478 | SALT | Q | |||||||
| J132333.24-223934.0 | 200.8885365 | -22.6594475 | 16.18 | 0.06 | 15.2 | 0.08 | 11.91 | 0.23 | ||||||
| PSO J200.8885-22.6595 | 5 | 63 | 20.73 | 0.06 | 20.24 | 0.05 | 20.01 | 0.03 | 20.11 | 0.04 | 19.82 | 0.07 | ||
| M132657.20-280831.4 | 404.5 | 18.9 | 17.2 | - | 2.238 | SALT | Q | |||||||
| J132657.18-280832.6 | 201.738268 | -28.1424123 | 16.35 | 0.06 | 15.53 | 0.11 | 12.45 | 0.52 | ||||||
| PSO J201.7379-28.1420 | 5 | 51 | 20.54 | 0.03 | 20.67 | 0.14 | 20.11 | 0.06 | 20.03 | 0.09 | 19.94 | 0.11 | ||
| M133520.56-391144.6 | 306.2 | 17.1 | 15.5 | - | 2.055 | SALT | Q | |||||||
| J133520.57-391146.0 | 203.835731 | -39.1961354 | 15.98 | 0.04 | 15.14 | 0.07 | 11.85 | 0.21 | ||||||
| - | - | - | - | - | - | - | - | - | - | - | - | - | ||
| M134309.26-083457.5 | 241.5 | 19.3 | 16.5 | - | 1.076 | SUGAR | Q | |||||||
| J134309.30-083456.6 | 205.7887762 | -8.5824088 | 15.93 | 0.05 | 15.09 | 0.08 | 11.88 | 0.24 | ||||||
| PSO J205.7887-08.5825 | 5 | 64 | 20.07 | 0.03 | 19.73 | 0.04 | 19.44 | 0.02 | 19.61 | 0.05 | 19.29 | 0.05 | ||
| M135131.98-101932.9 | 726.1 | 18.9 | 17.4 | - | 2.999 | SUGAR | Q | |||||||
| J135131.98-101932.1 | 207.8832846 | -10.3256104 | 15.02 | 0.03 | 14.12 | 0.04 | 10.74 | 0.09 | ||||||
| PSO J207.8833-10.3256 | 5 | 89 | 18.15 | 0.01 | 17.93 | 0.01 | 17.86 | 0.01 | 17.86 | 0.01 | 17.7 | 0.01 | ||
| M135547.99-370955.5∗c | 248.8 | 18.0 | 17.0 | - | 1.323 | SALT | Q | |||||||
| J135547.99-370956.3 | 208.9499945 | -37.1656536 | 16.4 | 0.06 | 15.4 | 0.09 | 11.88 | 0.21 | ||||||
| - | - | - | - | - | - | - | - | - | - | - | - | - | ||
| M141327.20-342235.1 | 274.7 | 17.1 | 14.9 | - | 2.812 | SALT | Q | |||||||
| J141327.16-342235.6 | 213.3631998 | -34.3765588 | 15.42 | 0.04 | 14.35 | 0.05 | 10.81 | 0.09 | ||||||
| - | - | - | - | - | - | - | - | - | - | - | - | - | ||
| M141338.15-071625.3 | 232.7 | 17.2 | 16.7 | -88.6 | 0.416 | SALT | G | |||||||
| J141338.23-071624.5 | 213.4093225 | -7.2734885 | 17.16 | 0.12 | 16.29 | 0.21 | 12.37 | 0.38 | ||||||
| PSO J213.4090-07.2735 | 5 | 32 | 22.15 | 0.01 | 21.48 | 0.11 | 20.68 | 0.05 | 20.93 | 0.05 | 20.29 | 0.23 | ||
| M142155.55-310427.9 | 732.6 | 18.0 | 17.7 | - | 1.568 | SALT | Q | |||||||
| J142155.57-310425.1 | 215.48157 | -31.07366 | 16.96 | 0.12 | 16.06 | 0.20 | 12.3 | - | ||||||
| - | - | - | - | - | - | - | - | - | - | - | - | - | ||
| M142213.87-091018.4 | 398.7 | 18.8 | 16.8 | - | 0.876 | SALT | G | |||||||
| J142213.88-091018.2 | 215.5578602 | -9.1717354 | 15.82 | 0.05 | 15.14 | 0.09 | 11.09 | 0.13 | ||||||
| PSO J215.5579-09.1717 | 4 | 11 | -999 | -999 | -999 | -999 | 21.38 | 0.18 | 21.03 | 0.06 | 20.6 | 0.13 | ||
| M143709.04-294718.5 | 273.8 | 18.6 | 17.3 | - | 2.331 | SALT | Q | |||||||
| J143708.95-294718.7 | 219.2873327 | -29.7885418 | 16.23 | 0.08 | 15.36 | 0.14 | 12.17 | 0.32 | ||||||
| PSO J219.2874-29.7885 | 5 | 21 | 19.6 | 0.05 | 19.54 | 0.03 | 19.37 | 0.03 | 19.15 | 0.01 | 19.15 | 0.05 | ||
| M144032.09+053120.7 | 214.9 | 18.6 | 18.1 | - | 0.754 | SALT | Q | |||||||
| J144032.02+053122.4 | 220.1334503 | 5.5229058 | 15.39 | 0.04 | 14.52 | 0.05 | 11.44 | 0.16 | ||||||
| PSO J220.1335+05.5229 | 5 | 69 | 20.33 | 0.04 | 20.31 | 0.04 | 20.17 | 0.03 | 19.75 | 0.03 | 19.8 | 0.05 | ||
| M144851.10-112215.6 | 455.5 | 13.9 | 13.9 | - | 2.630 | SALT | Q | |||||||
| J144851.15-112215.6 | 222.2131474 | -11.3710267 | 14.95 | 0.04 | 14.18 | 0.05 | 10.87 | 0.1 | ||||||
| PSO J222.2132-11.3710 | 5 | 72 | 18.21 | 0.02 | 18.07 | 0.02 | 18.03 | 0.02 | 17.9 | 0.01 | 17.77 | 0.01 | ||
| M145212.06-255639.8∗b | 229.9 | 16.2 | 15.8 | - | 1.693 | SALT | Q | |||||||
| J145212.09-255639.5 | 223.050385 | -25.9443099 | 15.88 | 0.05 | 14.75 | 0.07 | 11.3 | 0.14 | ||||||
| PSO J223.0503-25.9444 | 5 | 64 | 20.11 | 0.01 | 19.82 | 0.01 | 19.45 | 0.01 | 19.49 | 0.02 | 19.4 | 0.07 | ||
| M145342.95-132738.2 | 254.5 | 19.6 | 17.3 | - | 2.370 | SALT | Q | |||||||
| J145342.94-132735.8 | 223.4289562 | -13.4599571 | 14.6 | 0.03 | 13.51 | 0.04 | 10.13 | 0.05 | ||||||
| PSO J223.4290-13.4600 | 5 | 59 | 18.4 | 0.01 | 17.98 | 0.02 | 17.86 | 0.01 | 17.67 | 0.01 | 17.47 | 0.01 | ||
| M145502.84-170014.2∗a | 294.7 | 17.1 | 15.8 | - | 2.291 | SALT | Q | |||||||
| J145502.77-170012.5 | 223.7615501 | -17.0034926 | 16.41 | 0.08 | 15.7 | 0.18 | 11.85 | 0.28 | ||||||
| PSO J223.7617-17.0039 | 5 | 33 | 21.21 | 0.07 | 21.04 | 0.06 | 20.82 | 0.04 | 20.61 | 0.03 | 20.07 | 0.15 | ||
| M145536.16-095709.2 | 438.2 | 18.8 | 17.1 | - | 1.992 | SALT | G | |||||||
| J145536.14-095707.4 | 223.9005923 | -9.9520677 | 17.3 | 0.15 | 15.87 | 0.15 | 11.31 | 0.12 | ||||||
| - | - | - | - | - | - | - | - | - | - | - | - | - | ||
| M145625.83+045645.2 | 287.9 | 18.7 | 17.8 | - | 2.134 | SUGAR | Q | |||||||
| J145625.81+045644.5 | 224.1075561 | 4.9457114 | 16.21 | 0.06 | 15.5 | 0.10 | 12.62 | 0.42 | ||||||
| PSO J224.1075+04.9458 | 10 | 59 | 20.3 | 0.03 | 20.01 | 0.01 | 19.73 | 0.01 | 19.38 | 0.02 | 19.36 | 0.03 | ||
| M145908.92-164542.3 | 378.9 | 16.9 | 15.4 | - | 2.006 | SALT | Q | |||||||
| J145908.90-164541.9 | 224.7870882 | -16.7616588 | 16.4 | 0.09 | 15.4 | 0.16 | 11.88 | - | ||||||
| PSO J224.7871-16.7621 | 10 | 29 | 21.26 | 0.05 | 21.25 | 0.11 | 20.8 | 0.04 | 20.55 | 0.05 | -999 | -999 | ||
| M150425.30+081858.6 | 210.8 | 14.4 | 14.0 | - | 2.035 | SALT | Q | |||||||
| J150425.26+081858.7 | 226.1052909 | 8.3163078 | 16.33 | 0.06 | 15.24 | 0.08 | 11.71 | 0.18 | ||||||
| PSO J226.1054+08.3163 | 10 | 64 | 20.89 | 0.02 | 20.75 | 0.07 | 20.47 | 0.01 | 20.2 | 0.05 | 20.04 | 0.07 | ||
| M150712.88-313729.6 | 295.5 | 17.7 | 15.4 | - | 1.920 | SALT | Q | |||||||
| J150712.97-313731.8 | 226.8040709 | -31.6255152 | 15.88 | 0.06 | 14.75 | 0.07 | 11.47 | 0.25 | ||||||
| - | - | - | - | - | - | - | - | - | - | - | - | - | ||
| M151129.01-072255.3 | 326.3 | 18.6 | 15.2 | - | 2.582 | SALT | Q | |||||||
| J151128.97-072256.1 | 227.8707292 | -7.3822515 | 15.62 | 0.04 | 14.98 | 0.09 | 11.85 | 0.22 | ||||||
| PSO J227.8707-07.3823 | 5 | 76 | 18.95 | 0.02 | 18.79 | 0.01 | 18.89 | 0.01 | 18.59 | 0.01 | 18.46 | 0.02 | ||
| M151204.81-132833.0∗b | 295 | 17.1 | 16.1 | - | 1.737 | SALT | Q | |||||||
| J151204.73-132833.0 | 228.0197468 | -13.4758439 | 16.35 | 0.08 | 15.45 | 0.11 | 12.26 | 0.35 | ||||||
| PSO J228.0198-13.4758 | 5 | 58 | 20.59 | 0.04 | 20.57 | 0.03 | 20.12 | 0.02 | 20.2 | 0.03 | 20.02 | 0.06 | ||
| M151304.72-252439.7 | 217.6 | 26.4 | 16.0 | -86.2 | 3.132 | SALT | G | |||||||
| J151304.76-252439.7 | 228.2698707 | -25.4110515 | 17.31 | 0.16 | 16.61 | 0.33 | 11.79 | 0.27 | ||||||
| - | - | - | - | - | - | - | - | - | - | - | - | - | - | |
| M151944.77-115144.6∗a | 441 | 15.8 | 15.2 | - | 2.014 | SALT | Q | |||||||
| J151944.76-115144.8 | 229.9365081 | -11.862463 | 16.54 | 0.09 | 15.36 | 0.12 | 11.99 | 0.36 | ||||||
| PSO J229.9366-11.8624 | 5 | 61 | 20.99 | 0.05 | 20.93 | 0.12 | 20.29 | 0.03 | 20.19 | 0.05 | 20.1 | 0.09 | ||
| M154015.23-145341.5 | 203.3 | 17.9 | 16.4 | - | 2.098 | SALT | Q | |||||||
| J154015.24-145341.9 | 235.0635366 | -14.8949753 | 16.41 | 0.09 | 15.48 | 0.14 | 11.58 | - | ||||||
| PSO J235.0634-14.8952 | 5 | 62 | 20.68 | 0.02 | 20.42 | 0.03 | 19.98 | 0.03 | 19.98 | 0.02 | 19.71 | 0.06 | ||
| M154414.23-231200.8∗c | 296.4 | 16.3 | 16.0 | - | 1.026 | SALT | Q | |||||||
| J154414.17-231200.7 | 236.0590426 | -23.2002035 | 16.52 | 0.11 | 15.85 | 0.21 | 11.62 | 0.24 | ||||||
| PSO J236.0591-23.2004 | 10 | 50 | 21.12 | 0.08 | 20.53 | 0.07 | 20.31 | 0.04 | 20.18 | 0.07 | 19.86 | 0.05 | ||
| M155212.77-073246.5∗c | 222.3 | 17.3 | 16.6 | - | 1.015 | SALT | Q | |||||||
| J155212.76-073246.5 | 238.0532006 | -7.5462598 | 17.16 | 0.14 | 16.52 | - | 12.11 | - | ||||||
| PSO J238.0532-07.5462 | 5 | 59 | 20.48 | 0.02 | 20.25 | 0.03 | 20.35 | 0.02 | 19.92 | 0.01 | 19.67 | 0.04 | ||
| M155709.44+055216.1∗d | 231.7 | 18.6 | 16.8 | - | 0.668 | SALT | G | |||||||
| J155709.42+055215.4 | 239.2892897 | 5.870947 | 16.34 | 0.07 | 15.51 | 0.10 | 11.27 | 0.15 | ||||||
| PSO J239.2893+05.8709 | 5 | 51 | -999 | -999 | 21.53 | 0.07 | 20.99 | 0.04 | 20.49 | 0.04 | -999 | -999 | ||
| M155825.35-215511.5 | 206.9 | 19.5 | 15.6 | - | 2.760 | SALT | Q | |||||||
| J155825.36-215511.1 | 239.6056955 | -21.9197627 | 14.6 | 0.03 | 13.52 | 0.04 | 10.17 | 0.08 | ||||||
| PSO J239.6057-21.9198 | 5 | 53 | 20.4 | 0.01 | 19.95 | 0.03 | 19.43 | 0.02 | 18.97 | 0.02 | 18.55 | 0.03 | ||
| M160903.37-145457.6∗d | 213.6 | 17.2 | 14.0 | - | 0.931 | SALT | G | |||||||
| J160903.34-145458.2 | 242.2639473 | -14.9161735 | 15.98 | 0.06 | 15.19 | 0.10 | 12.13 | - | ||||||
| PSO J242.2641-14.9162 | 5 | 4 | -999 | -999 | -999 | -999 | 21.65 | 0.11 | -999 | -999 | -999 | -999 | ||
| M161454.47-154550.7 | 473.8 | 16.9 | 14.7 | - | 0.920 | SALT | Q | |||||||
| J161454.39-154549.1 | 243.7266435 | -15.7636422 | 15.19 | 0.04 | 14.27 | 0.05 | 11.17 | 0.17 | ||||||
| PSO J243.7267-15.7637 | 5 | 75 | 20.6 | 0.02 | 19.74 | 0.12 | 19.6 | 0.04 | 20.1 | 0.03 | 19.44 | 0.07 | ||
| M161907.44-093953.1 | 340.3 | 16.5 | 15.6 | - | 2.891 | SALT | Q | |||||||
| J161907.44-093952.5 | 244.7810354 | -9.6646096 | 15.87 | 0.05 | 14.8 | 0.07 | 11.29 | 0.2 | ||||||
| PSO J244.7810-09.6647 | 5 | 62 | 19.97 | 0.02 | 19.5 | 0.02 | 19.17 | 0.01 | 19.06 | 0.04 | 18.87 | 0.02 | ||
| M162047.94+003653.2 | 317.8 | 16.7 | 15.7 | - | 2.438 | SALT | Q | |||||||
| J162047.96+003653.1 | 245.1998398 | 0.6147621 | 14.77 | 0.03 | 14.05 | 0.04 | 11.13 | 0.16 | ||||||
| PSO J245.1998+00.6148 | 10 | 71 | 18.92 | 0.01 | 18.7 | 0.01 | 18.61 | 0.03 | 18.28 | 0.01 | 18.12 | 0.02 | ||
| M164950.51+062653.3 | 389.2 | 18.0 | 16.8 | - | 2.144 | SUGAR | Q | |||||||
| J164950.54+062652.8 | 252.4606031 | 6.4480267 | 14.75 | 0.04 | 13.64 | 0.03 | 10.4 | 0.07 | ||||||
| PSO J252.4604+06.4482 | 5 | 77 | 18.87 | 0.02 | 18.73 | 0.02 | 18.54 | 0.03 | 18.44 | 0.01 | 18.43 | 0.02 | ||
| M165038.03-124854.5 | 275.5 | 18.5 | 15.5 | - | 2.527 | SUGAR | Q | |||||||
| J165038.01-124853.2 | 252.6584023 | -12.8147998 | 16.23 | 0.07 | 15.07 | 0.09 | 11.27 | 0.17 | ||||||
| PSO J252.6585-12.8149 | 5 | 68 | 21.06 | 0.05 | 20.58 | 0.04 | 20.37 | 0.05 | 20.08 | 0.04 | 19.77 | 0.05 | ||
| M165357.67-010214.2 | 317.4 | 17.9 | 15.5 | - | 1.088 | SUGAR | Q | |||||||
| J165357.67-010213.4 | 253.4903148 | -1.0370705 | 15.71 | 0.05 | 14.8 | 0.06 | 11.67 | - | ||||||
| PSO J253.4904-01.0371 | 5 | 73 | 21.04 | 0.03 | 20.48 | 0.04 | 20.09 | 0.02 | 19.85 | 0.02 | 19.4 | 0.06 | ||
| M165435.38+001719.5 | 255.3 | 17.9 | 15.3 | - | 2.363 | SALT | Q | |||||||
| J165435.38+001719.2 | 253.6474532 | 0.2886674 | 16.92 | 0.11 | 15.92 | 0.16 | 12.49 | 0.48 | ||||||
| PSO J253.6474+00.2888 | 5 | 71 | 20.08 | 0.04 | 20.01 | 0.03 | 19.84 | 0.03 | 19.67 | 0.04 | 19.39 | 0.04 | ||
| M170333.50+064539.7 | 236.6 | 17.9 | 16.7 | - | 0.399 | SALT | G | |||||||
| J170333.53+064539.3 | 255.8897404 | 6.7609306 | 15.24 | 0.04 | 14.07 | 0.04 | 10.66 | 0.1 | ||||||
| PSO J255.8898+06.7609 | 5 | 55 | 22.02 | 0.21 | 21.18 | 0.03 | 20.35 | 0.04 | 20.07 | 0.05 | 19.57 | 0.05 | ||
| M171627.09-061356.5 | 229.9 | 17.6 | 20.0 | -48.4 | 1.840 | NOT | Q | |||||||
| J171627.07-061356.3 | 259.1128304 | -6.2323088 | 14.03 | 0.03 | 12.82 | 0.03 | 9.49 | 0.05 | ||||||
| PSO J259.1128-06.2323 | 5 | 67 | 19.95 | 0.01 | 19.07 | 0.03 | 18.41 | 0.01 | 18.13 | 0.01 | 17.89 | 0.02 | ||
| M172105.79+162649.1 | 507.9 | 17.8 | 16.5 | - | 1.814 | NOT | Q | |||||||
| J172105.77+162649.4 | 260.2740504 | 16.4470577 | 16.11 | 0.05 | 15.31 | 0.08 | 11.8 | 0.19 | ||||||
| PSO J260.2741+16.4470 | 5 | 85 | 19.95 | 0.03 | 19.97 | 0.01 | 19.58 | 0.02 | 19.51 | 0.02 | 19.47 | 0.05 | ||
| M172214.09+044316.8 | 765.5 | 19.9 | 16.8 | 64.3 | 0.603 | SALT | G | |||||||
| J172214.07+044317.0 | 260.5586294 | 4.7213966 | 15.01 | 0.04 | 14.29 | 0.05 | 11.1 | 0.14 | ||||||
| PSO J260.5586+04.7214 | 4 | 35 | -999 | -999 | 21.62 | 0.09 | 20.6 | 0.03 | 20.33 | 0.08 | 20.13 | 0 | ||
| M172507.45+062242.1 | 213.4 | 18.5 | 16.2 | - | 1.355 | SUGAR | Q | |||||||
| J172507.43+062240.9 | 261.280972 | 6.3780555 | 15.4 | 0.04 | 14.49 | 0.05 | 11.36 | 0.17 | ||||||
| PSO J261.2812+06.3781 | 10 | 73 | 19.45 | 0.02 | 19.05 | 0.02 | 18.8 | 0.03 | 18.76 | 0.01 | 18.77 | 0.04 | ||
| M190923.40-392311.7 | 204.9 | 18.9 | 16.2 | - | 2.513 | SALT | Q | |||||||
| J190923.31-392312.1 | 287.3471522 | -39.3867043 | 16.62 | 0.1 | 15.54 | 0.14 | 11.57 | 0.25 | ||||||
| - | - | - | - | - | - | - | - | - | - | - | - | - | ||
| M192956.85-351619.6 | 276.4 | 19.0 | 19.0 | - | 0.333 | SALT | G | |||||||
| J192956.83-351619.7 | 292.4867973 | -35.2721648 | 14.25 | 0.03 | 13.52 | 0.04 | 10.24 | 0.09 | ||||||
| - | - | - | - | - | - | - | - | - | - | - | - | - | ||
| M193147.88-360659.1 | 779.6 | 17.6 | 16.9 | - | 0.449 | SALT | G | |||||||
| J193147.94-360658.1 | 292.9497658 | -36.1161433 | 14.73 | 0.04 | 13.85 | 0.04 | 9.84 | 0.05 | ||||||
| - | - | - | - | - | - | - | - | - | - | - | - | - | ||
| M194110.28-300720.9 | 315 | 19.5 | 15.1 | - | 2.059 | SALT | Q | |||||||
| J194110.25-300720.5 | 295.2927432 | -30.1223853 | 13.65 | 0.03 | 12.88 | 0.03 | 9.94 | 0.06 | ||||||
| - | - | - | - | - | - | - | - | - | - | - | - | - | ||
| M195243.90-193623.7 | 596.3 | 19.3 | 18.2 | - | 1.946 | SALT | Q | |||||||
| J195243.87-193622.1 | 298.1828116 | -19.6061565 | 16.06 | 0.08 | 14.85 | 0.10 | 11.24 | 0.18 | ||||||
| PSO J298.1828-19.6064 | 10 | 67 | 20.65 | 0.03 | 20.48 | 0.02 | 20.16 | 0.02 | 19.87 | 0.06 | 19.55 | 0 | ||
| M195629.92-054246.9 | 351.3 | 18.0 | 16.8 | - | 1.103 | SALT | Q | |||||||
| J195630.01-054247.4 | 299.1250677 | -5.7131809 | 14.79 | 0.04 | 13.84 | 0.04 | 10.52 | 0.09 | ||||||
| PSO J299.1250-05.7130 | 5 | 66 | 18.91 | 0.01 | 18.47 | 0.01 | 18.31 | 0.01 | 18.37 | 0.02 | 18.24 | 0.01 | ||
| M200008.58-192138.3∗c | 896.7 | 16.3 | 16.1 | - | 1.187 | SALT | Q | |||||||
| J200008.56-192138.3 | 300.0356945 | -19.3606496 | 16.17 | 0.07 | 15.04 | 0.10 | 11.59 | - | ||||||
| PSO J300.0357-19.3604 | 5 | 80 | 20.2 | 0.03 | 19.74 | 0.03 | 19.54 | 0.02 | 19.58 | 0.03 | 19.39 | 0.11 | ||
| M200209.37-145531.8 | 620.3 | 17.0 | 15.6 | - | 2.192 | SALT | Q | |||||||
| J200209.37-145532.4 | 300.539052 | -14.9256698 | 16.41 | 0.08 | 15.46 | 0.12 | 12.34 | 0.45 | ||||||
| PSO J300.5390-14.9255 | 5 | 67 | 20.52 | 0.03 | 20.26 | 0.01 | 19.88 | 0.01 | 19.56 | 0.02 | 19.7 | 0.06 | ||
| M201708.96-293354.7 | 327.2 | 17.1 | 15.8 | - | 2.617 | SALT | Q | |||||||
| J201708.95-293355.2 | 304.2873084 | -29.5653586 | 15.91 | 0.06 | 14.89 | 0.08 | 11.42 | 0.21 | ||||||
| PSO J304.2873-29.5653 | 5 | 67 | 19.79 | 0.02 | 19.37 | 0.01 | 19.51 | 0.02 | 19.03 | 0.01 | 18.89 | 0.04 | ||
| M201952.74-394808.3∗c | 234.6 | 19.2 | 17.2 | - | 1.194 | SALT | Q | |||||||
| J201952.68-394809.1 | 304.9695021 | -39.8025426 | 16.17 | 0.06 | 15.32 | 0.10 | 12.15 | 0.32 | ||||||
| - | - | - | - | - | - | - | - | - | - | - | - | - | ||
| M203425.65-052332.2 | 419.7 | 14.9 | 18.0 | 58.5 | 2.070 | NOT | Q | |||||||
| J203425.62-052331.8 | 308.6067642 | -5.3921681 | 15.58 | 0.05 | 14.61 | 0.06 | 11.18 | 0.16 | ||||||
| PSO J308.6067-05.3922 | 5 | 66 | 18.67 | 0.01 | 18.64 | 0.02 | 18.41 | 0.01 | 18.23 | 0.01 | 18.28 | 0.02 | ||
| M204608.17-391840.7 | 250 | 17.0 | 16.6 | - | 2.619 | SALT | Q | |||||||
| J204607.98-391841.9 | 311.5332541 | -39.3116438 | 16.63 | 0.08 | 15.74 | 0.14 | 12.53 | - | ||||||
| - | - | - | - | - | - | - | - | - | - | - | - | - | ||
| M204737.66-184141.6 | 241.7 | 17.2 | 16.1 | - | 2.994 | SALT | Q | |||||||
| J204737.67-184141.2 | 311.9069909 | -18.6947958 | 15.26 | 0.04 | 14.37 | 0.06 | 10.73 | 0.11 | ||||||
| PSO J311.9069-18.6948 | 10 | 97 | 18.51 | 0.01 | 18.4 | 0.01 | 18.33 | 0.01 | 18.26 | 0.01 | 18.12 | 0.03 | ||
| M205245.03-223410.6 | 330.9 | 18.1 | 15.9 | - | 2.072 | SALT | Q | |||||||
| J205244.97-223410.3 | 313.1873933 | -22.569539 | 15.11 | 0.04 | 14.08 | 0.04 | 10.82 | 0.12 | ||||||
| PSO J313.1874-22.5695 | 5 | 96 | 18.36 | 0.01 | 18.17 | 0.01 | 18.07 | 0.01 | 17.87 | 0.01 | 17.93 | 0.01 | ||
| M205456.08-093240.8 | 313.6 | 18.1 | 15.5 | - | 1.373 | SUGAR | Q | |||||||
| J205456.07-093241.0 | 313.733661 | -9.5447295 | 16.42 | 0.08 | 15.44 | 0.13 | 11.74 | 0.38 | ||||||
| PSO J313.7336-09.5447 | 5 | 61 | 20.76 | 0.08 | 20.06 | 0.04 | 20.1 | 0.03 | 19.94 | 0.02 | 20.02 | 0.08 | ||
| M205548.51-190545.6∗c | 227.3 | 18.6 | 16.0 | - | 0.809 | SALT | Q | |||||||
| J205548.49-190546.1 | 313.9520661 | -19.096164 | 16.41 | 0.09 | 15.38 | 0.12 | 12.2 | 0.46 | ||||||
| PSO J313.9521-19.0961 | 10 | 73 | 21.15 | 0.07 | 21.1 | 0.09 | 20.63 | 0.02 | 20.63 | 0.03 | 20.45 | 0.19 | ||
| M205842.96-173649.9 | 332.5 | 17.6 | 17.0 | - | 0.754 | SALT | G | |||||||
| J205842.93-173650.6 | 314.6789027 | -17.614082 | 15.63 | 0.05 | 14.8 | 0.08 | 11.6 | - | ||||||
| PSO J314.6789-17.6141 | 5 | 46 | 22.43 | 0.19 | 21.69 | 0.06 | 21.07 | 0.03 | 20.21 | 0.03 | 20.16 | 0.14 | ||
| M205959.61-144043.1 | 1018.1 | 19.3 | 16.7 | - | 0.689 | SUGAR | G | |||||||
| J205959.57-144042.0 | 314.9982203 | -14.6783358 | 14.63 | 0.03 | 13.63 | 0.04 | 10.45 | 0.11 | ||||||
| PSO J314.9982-14.6783 | 10 | 68 | 21.28 | 0.05 | 20.54 | 0.05 | 20.05 | 0.02 | 19.41 | 0.05 | 19.5 | 0.04 | ||
| M210143.29-174759.2 | 959.5 | 16.5 | 16.2 | - | 2.803 | SALT | Q | |||||||
| J210143.32-174759.2 | 315.4305276 | -17.7997963 | 17.31 | 0.15 | 16.48 | 0.29 | 12.35 | 0.48 | ||||||
| PSO J315.4303-17.7997 | 5 | 68 | 21.2 | 0.03 | 20.84 | 0.05 | 20.98 | 0.02 | 20.74 | 0.08 | -999 | -999 | ||
| M211311.86-393933.7 | 554.2 | 18.4 | 16.0 | - | 0.843 | SALT | Q | |||||||
| J211311.86-393934.6 | 318.2994201 | -39.6596198 | 15.12 | 0.04 | 14.13 | 0.04 | 10.89 | 0.11 | ||||||
| - | - | - | - | - | - | - | - | - | - | - | - | - | ||
| M211949.40-343938.6 | 287.2 | 17.7 | 17.1 | - | 0.452 | SALT | G | |||||||
| J211949.37-343939.1 | 319.9557426 | -34.6608848 | 15.43 | 0.04 | 14.76 | 0.06 | 11.78 | - | ||||||
| - | - | - | - | - | - | - | - | - | - | - | - | - | ||
| M212042.48+132724.2 | 401.5 | 18.1 | 16.5 | - | 1.110 | NOT | Q | |||||||
| J212042.48+132727.1 | 320.177014 | 13.4575549 | 14.68 | 0.03 | 13.91 | 0.04 | 10.56 | 0.07 | ||||||
| PSO J320.1771+13.4580 | 5 | 66 | 21.16 | 0.02 | 20.11 | 0.01 | 19.52 | 0.02 | 19.12 | 0.03 | 18.91 | 0.05 | ||
| M212758.87-385856.3 | 355.8 | 16.9 | 15.8 | - | 2.663 | SALT | Q | |||||||
| J212758.91-385855.9 | 321.9954748 | -38.9821988 | 16.81 | 0.1 | 16.01 | 0.17 | 11.58 | 0.21 | ||||||
| - | - | - | - | - | - | - | - | - | - | - | - | - | ||
| M212821.83-150453.2 | 245.5 | 16.2 | 14.7 | - | 2.547 | SALT | Q | |||||||
| J212821.89-150453.1 | 322.0912098 | -15.0814335 | 15.84 | 0.06 | 14.97 | 0.08 | 11.91 | 0.39 | ||||||
| PSO J322.0912-15.0813 | 5 | 86 | 19.32 | 0.01 | 19.16 | 0.02 | 19.19 | 0.01 | 19.01 | 0.01 | 18.84 | 0.02 | ||
| M213135.55-270159.0∗b | 205.9 | 18.5 | 15.9 | - | 1.921 | SALT | Q | |||||||
| J213135.55-270159.1 | 322.8981403 | -27.0331064 | 15.85 | 0.05 | 14.71 | 0.07 | 11.4 | 0.2 | ||||||
| PSO J322.8981-27.0331 | 5 | 86 | 19.02 | 0.01 | 18.93 | 0.02 | 18.78 | 0.01 | 18.72 | 0.03 | 18.82 | 0.03 | ||
| M213937.03+171826.9 | 219.4 | 20.3 | 17.5 | -63 | 1.700 | NOT | Q | |||||||
| J213937.14+171825.9 | 324.90478 | 17.3072104 | 15.43 | 0.04 | 14.23 | 0.05 | 10.88 | 0.09 | ||||||
| PSO J324.9048+17.3072 | 5 | 79 | 19.16 | 0.01 | 18.9 | 0.02 | 18.58 | 0.01 | 18.51 | 0.02 | 18.47 | 0.02 | ||
| M214120.76-351516.9 | 371.3 | 18.7 | 16.0 | - | 2.599 | SALT | Q | |||||||
| J214120.77-351517.1 | 325.3365774 | -35.2547519 | 17.21 | 0.12 | 16.09 | 0.17 | 12.74 | 0.5 | ||||||
| - | - | - | - | - | - | - | - | - | - | - | - | - | ||
| M215445.08-382632.5 | 759.8 | 18.5 | 15.0 | - | 2.797 | SALT | Q | |||||||
| J215445.04-382632.5 | 328.6876684 | -38.4423862 | 13.5 | 0.03 | 12.64 | 0.03 | 9.46 | 0.04 | ||||||
| - | - | - | - | - | - | - | - | - | - | - | - | - | - | |
| M215800.88+092546.4 | 437.7 | 15.5 | 14.4 | - | 0.447 | SUGAR | G | |||||||
| J215800.86+092546.0 | 329.5036223 | 9.4294464 | 15.19 | 0.04 | 14.33 | 0.05 | 9.91 | 0.06 | ||||||
| PSO J329.5037+09.4294 | 5 | 68 | 21.27 | 0.05 | 20.16 | 0.03 | 19.77 | 0.03 | 19.72 | 0.03 | 19.27 | 0.02 | ||
| M220127.50+031215.6 | 300.5 | 18.4 | 15.7 | - | 2.181 | SUGAR | Q | |||||||
| J220127.47+031215.6 | 330.3644887 | 3.2043567 | 16.31 | 0.07 | 15.61 | 0.12 | 11.78 | - | ||||||
| PSO J330.3646+03.2042 | 8 | 48 | 20.46 | 0.2 | 21.04 | 0.08 | 20.95 | 0.05 | 20.47 | 0.18 | -999 | -999 | ||
| M221843.50-122912.9∗c | 230.4 | 16.7 | 15.6 | - | 1.156 | SALT | Q | |||||||
| J221843.45-122913.6 | 334.681072 | -12.4871191 | 16.99 | 0.13 | 15.99 | 0.20 | 11.74 | - | ||||||
| PSO J334.6810-12.4870 | 5 | 76 | 20.99 | 0.04 | 20.59 | 0.04 | 20.17 | 0.03 | 20.18 | 0.04 | 19.82 | 0.19 | ||
| M222004.97+130712.1 | 812 | 21.8 | 17.2 | -5.7 | 0.760 | NOT | Q | |||||||
| J222005.10+130710.9 | 335.0212696 | 13.1197105 | 14.94 | 0.04 | 14.19 | 0.05 | 11.11 | 0.17 | ||||||
| PSO J335.0212+13.1197 | 5 | 74 | 20.59 | 0.02 | 20.31 | 0.03 | 20.11 | 0.01 | 19.55 | 0.03 | 19.75 | 0.12 | ||
| M222332.81-310117.3 | 231.7 | 16.1 | 15.4 | - | 3.206 | SALT | Q | |||||||
| J222332.79-310117.7 | 335.8866347 | -31.0216 | 16.15 | 0.05 | 15.18 | 0.08 | 11.91 | 0.31 | ||||||
| - | - | - | - | - | - | - | - | - | - | - | - | - | ||
| M222420.03+130450.2 | 294.5 | 17.3 | 16.8 | - | 0.685 | NOT | Q | |||||||
| J222420.06+130450.7 | 336.0836105 | 13.0807776 | 16.15 | 0.06 | 15.13 | 0.10 | 11.67 | - | ||||||
| PSO J336.0835+13.0807 | 5 | 60 | 21.1 | 0.04 | 20.64 | 0.04 | 20.23 | 0.05 | 20.02 | 0.07 | 19.74 | 0.07 | ||
| M223050.19+034836.8 | 242.8 | 17.8 | 16.7 | - | 1.330 | SUGAR | Q | |||||||
| J223050.19+034835.8 | 337.7091503 | 3.8099591 | 16.53 | 0.08 | 15.92 | 0.15 | 12.15 | - | ||||||
| PSO J337.7092+03.8101 | 5 | 20 | 22.39 | 0.26 | 21.88 | 0.04 | 21.63 | 0.03 | 21.04 | 0.07 | -999 | -999 | ||
| M223816.27-124036.4 | 213.6 | 18.4 | 16.2 | - | 2.623 | SALT | Q | |||||||
| J223816.28-124036.6 | 339.5678681 | -12.6768403 | 16.31 | 0.07 | 15.47 | 0.12 | 11.83 | 0.32 | ||||||
| PSO J339.5676-12.6768 | 5 | 86 | 21.21 | 0.06 | 20.56 | 0.02 | 20.53 | 0.03 | 20.12 | 0.02 | 19.7 | 0.11 | ||
| M223826.48-134422.6 | 241.2 | 14.7 | 16.6 | -50.1 | 0.257 | NOT | G | |||||||
| J223826.55-134421.5 | 339.6106451 | -13.7393129 | 14.78 | 0.03 | 13.97 | 0.04 | 10.78 | 0.12 | ||||||
| PSO J339.6104-13.7396 | 5 | 73 | 20.94 | 0.06 | 19.81 | 0.03 | 19.46 | 0.02 | 19.24 | 0.04 | 18.88 | 0.1 | ||
| M223831.50-173119.1 | 348.8 | 19.3 | 16.0 | - | 1.831 | SALT | Q | |||||||
| J223831.46-173117.7 | 339.6311027 | -17.5215972 | 15.77 | 0.06 | 14.9 | 0.08 | 11.66 | 0.25 | ||||||
| PSO J339.6310-17.5215 | 5 | 64 | 18.88 | 0.01 | 18.79 | 0.01 | 18.57 | 0.02 | 18.5 | 0.02 | 18.5 | 0.04 | ||
| M224018.74+022030.0∗c | 211 | 17.0 | 15.8 | - | 0.694 | SALT | Q | |||||||
| J224018.90+022028.5 | 340.0787841 | 2.3412684 | 15.63 | 0.05 | 14.98 | 0.09 | 11.16 | 0.21 | ||||||
| PSO J340.0781+02.3415 | 5 | 75 | 19.7 | 0.05 | 19.41 | 0.02 | 19.34 | 0.02 | 19.08 | 0.04 | 19.17 | 0.05 | ||
| M224111.48-244239.0 | 211.4 | 16.7 | 15.3 | - | 2.242 | SALT | Q | |||||||
| J224111.50-244238.3 | 340.2979416 | -24.7106643 | 15.54 | 0.05 | 14.44 | 0.06 | 11.03 | 0.14 | ||||||
| PSO J340.2980-24.7107 | 5 | 89 | 18.8 | 0.04 | 18.47 | 0.01 | 18.58 | 0.01 | 18.44 | 0.01 | 18.41 | 0.02 | ||
| M224354.81+181445.9 | 1004.4 | 17.9 | 16.5 | - | 0.760 | NOT | G | |||||||
| J224354.81+181444.6 | 340.9784026 | 18.2457301 | 15.94 | 0.05 | 14.48 | 0.05 | 10.34 | 0.08 | ||||||
| PSO J340.9785+18.2457 | 5 | 53 | 21.07 | 0.02 | 20.29 | 0.01 | 20.08 | 0.02 | 18.93 | 0.03 | 20.04 | 0.03 | ||
| M224705.52+121151.4 | 223.7 | 16.9 | 16.7 | - | 2.185 | NOT | Q | |||||||
| J224705.55+121151.8 | 341.7731632 | 12.1977348 | 17.27 | 0.14 | 16.66 | - | 12.25 | - | ||||||
| PSO J341.7731+12.1976 | 5 | 35 | 21.43 | 0.05 | 21.22 | 0.06 | 21.03 | 0.01 | 20.55 | 0.09 | 20.7 | 0.17 | ||
| M224950.57-263459.6 | 228.8 | 16.3 | 15.8 | - | 2.174 | SALT | Q | |||||||
| J224950.57-263459.5 | 342.4607113 | -26.5832163 | 16.23 | 0.07 | 15.26 | 0.09 | 12.06 | 0.38 | ||||||
| PSO J342.4607-26.5832 | 5 | 61 | 20.23 | 0.02 | 20.04 | 0.05 | 19.98 | 0.03 | 19.58 | 0.02 | 19.42 | 0.07 | ||
| M225137.19-331056.9 | 515.3 | 14 | 16.9 | -47.5 | 0.624 | SALT | Q | |||||||
| J225137.20-331058.0 | 342.9050396 | -33.1827883 | 15.15 | 0.04 | 14.46 | 0.05 | 10.93 | 0.11 | ||||||
| - | - | - | - | - | - | - | - | - | - | - | - | - | ||
| M225236.48-030551.4 | 240.1 | 16.5 | 14.8 | - | 1.633 | SALT | Q | |||||||
| J225236.46-030550.4 | 343.1519288 | -3.0973526 | 16.18 | 0.07 | 14.91 | 0.09 | 11.22 | - | ||||||
| PSO J343.1519-03.0973 | 5 | 75 | 19.7 | 0.03 | 19.66 | 0.08 | 19.31 | 0.04 | 19.25 | 0.03 | 19.1 | 0.09 | ||
| M230036.41+194002.9 | 210.4 | 14.9 | 16.1 | -29.6 | 2.160 | NOT | Q | |||||||
| J230036.35+194001.3 | 345.1514973 | 19.6670443 | 15.94 | 0.06 | 15.22 | 0.09 | 12.19 | 0.4 | ||||||
| PSO J345.1515+19.6671 | 5 | 64 | 19.63 | 0.02 | 19.58 | 0.01 | 19.36 | 0.02 | 19.12 | 0.02 | 19.05 | 0.02 | ||
| M230040.87+033710.3 | 509 | 17.3 | 15.3 | - | 1.861 | SUGAR | Q | |||||||
| J230040.89+033710.8 | 345.1703754 | 3.6196709 | 15.54 | 0.05 | 14.45 | 0.06 | 10.89 | 0.13 | ||||||
| PSO J345.1704+03.6197 | 5 | 67 | 19.5 | 0.03 | 19.48 | 0.02 | 19.31 | 0.01 | 19.31 | 0.01 | 19.08 | 0.05 | ||
| M230805.25-114945.7 | 256.8 | 18.2 | 16.3 | - | 1.940 | NOT | Q | |||||||
| J230805.22-114945.2 | 347.0217611 | -11.8292281 | 16.66 | 0.1 | 15.9 | 0.22 | 12.07 | - | ||||||
| PSO J347.0218-11.8292 | 5 | 58 | 20.37 | 0.02 | 20.29 | 0.03 | 20.18 | 0.02 | 19.98 | 0.03 | 19.79 | 0.1 | ||
| M231002.89+111403.6 | 248.1 | 16.8 | 16.3 | - | 1.550 | NOT | Q | |||||||
| J231002.90+111404.6 | 347.512118 | 11.2346199 | 16.55 | 0.08 | 15.39 | 0.11 | 12.12 | - | ||||||
| PSO J347.5121+11.2346 | 5 | 70 | 19.69 | 0.01 | 19.77 | 0.03 | 19.51 | 0.02 | 19.38 | 0.03 | 19.46 | 0.04 | ||
| M231634.61+042940.2 | 214 | 19.0 | 16.6 | - | 2.180 | SUGAR | Q | |||||||
| J231634.61+042939.8 | 349.1442147 | 4.4943985 | 15.72 | 0.05 | 14.46 | 0.06 | 11.15 | 0.16 | ||||||
| PSO J349.1442+04.4944 | 5 | 78 | 19.35 | 0.01 | 19.2 | 0.03 | 18.89 | 0.04 | 18.62 | 0.01 | 18.65 | 0.03 | ||
| M233231.61-142318.8 | 234.1 | 25.5 | 16 | -46.8 | 0.524 | NOT | Q | |||||||
| J233231.76-142320.7 | 353.132351 | -14.3890852 | 14.79 | 0.03 | 14.1 | 0.05 | 11.06 | 0.16 | ||||||
| PSO J353.1324-14.3891 | 10 | 47 | 20.97 | 0.05 | 20.28 | 0.04 | 19.64 | 0.02 | 19.53 | 0.07 | 19.32 | 0.02 | ||
| M233808.04-121851.4 | 450.9 | 14.9 | 16.5 | 6.4 | 1.185 | NOT | Q | |||||||
| J233808.06-121850.5 | 354.5336244 | -12.3140449 | 16.01 | 0.06 | 15.04 | 0.08 | 11.81 | 0.24 | ||||||
| PSO J354.5336-12.3141 | 5 | 57 | 19.95 | 0.02 | 19.45 | 0.04 | 19.44 | 0.01 | 19.37 | 0.02 | 19.26 | 0.05 | ||
| M234159.52-400856.2 | 460.7 | 15.2 | 13.9 | - | 0.562 | SALT | Q | |||||||
| J234159.50-400854.4 | 355.4979212 | -40.1484663 | 14.8 | 0.03 | 14.02 | 0.04 | 10.93 | 0.1 | ||||||
| - | - | - | - | - | - | - | - | - | - | - | - | - | ||
| M234207.38-092346.5 | 451.2 | 19.5 | 16.6 | - | 1.723 | SALT | Q | |||||||
| J234207.43-092346.4 | 355.5309878 | -9.3962396 | 15.69 | 0.05 | 14.46 | 0.06 | 10.99 | 0.14 | ||||||
| PSO J355.5310-09.3962 | 5 | 40 | 21.6 | 0.07 | 21.48 | 0.09 | 20.7 | 0.03 | 20.45 | 0.03 | 19.99 | 0.03 | ||
| M234910.12-043803.2 | 206.1 | 16.4 | 16.2 | - | 2.240 | SALT | Q | |||||||
| J234910.16-043803.2 | 357.2923581 | -4.6342274 | 15.77 | 0.05 | 14.99 | 0.09 | 11.61 | 0.29 | ||||||
| PSO J357.2924-04.6343 | 5 | 72 | 18.68 | 0.01 | 18.76 | 0.01 | 18.6 | 0.01 | 18.43 | 0.01 | 18.37 | 0.02 | ||
| M235722.47-073134.3 | 235.5 | 16.9 | 15.9 | - | 2.764 | SALT | Q | |||||||
| J235722.56-073134.1 | 359.3440369 | -7.5261639 | 16.24 | 0.07 | 15.62 | 0.17 | 12.28 | 0.47 | ||||||
| PSO J359.3438-07.5261 | 5 | 79 | 19.97 | 0.03 | 19.58 | 0.01 | 19.38 | 0.01 | 19.41 | 0.02 | 19.21 | 0.03 | ||
| No emission lines (26) | ||||||||||||||
| M001053.65-215703.9 | 387.8 | 18.9 | 16.3 | - | - | SALT | ||||||||
| J001053.64-215704.2 | 2.7235144 | -21.9511886 | 14.8 | 0.03 | 13.79 | 0.04 | 10.57 | 0.08 | ||||||
| PSO J002.7235-21.9512 | 5 | 43 | 21.07 | 0.05 | 20.38 | 0.06 | 20.11 | 0.06 | 20.01 | 0.16 | 19.72 | 0.07 | ||
| M002232.46+060804.6 | 339.7 | 17.7 | 15.5 | - | - | NOT | ||||||||
| J002232.44+060804.2 | 5.6351816 | 6.1345179 | 13.23 | 0.03 | 12.21 | 0.02 | 9.03 | 0.03 | ||||||
| PSO J005.6352+06.1345 | 5 | 83 | 18.45 | 0.04 | 18.52 | 0.02 | 18.54 | 0.06 | 18.1 | 0.03 | 17.9 | 0.07 | ||
| M002945.04-174043.6 | 394.3 | 19.5 | 16.3 | - | - | SALT | ||||||||
| J002945.09-174042.4 | 7.4378894 | -17.6784528 | 15.65 | 0.05 | 14.57 | 0.06 | 11.25 | 0.18 | ||||||
| PSO J007.4379-17.6786 | 5 | 58 | 19.17 | 0.01 | 19.15 | 0.02 | 18.91 | 0.01 | 18.87 | 0.01 | 18.77 | 0.03 | ||
| M005147.15+174710.3 | 1367.5 | 17.9 | 16.1 | - | - | NOT | ||||||||
| J005147.15+174710.4 | 12.9464982 | 17.786248 | 15.59 | 0.04 | 14.65 | 0.06 | 11.42 | 0.19 | ||||||
| PSO J012.9465+17.7863 | 5 | 49 | 21.17 | 0.02 | 20.3 | 0.01 | 19.69 | 0.02 | 19.55 | 0.04 | 19.19 | 0.02 | ||
| M010549.69+184507.1 | 339.5 | 16.6 | 15.2 | - | - | NOT | ||||||||
| J010549.66+184506.6 | 16.4569295 | 18.7518446 | 15.61 | 0.04 | 14.81 | 0.06 | 11.66 | 0.20 | ||||||
| PSO J016.4569+18.7521 | 5 | 69 | 20.21 | 0.02 | 19.7 | 0.02 | 19.56 | 0.01 | 19.67 | 0.04 | 19.44 | 0.06 | ||
| M055341.91-084003.3 | 273.8 | - | - | SALT | ||||||||||
| J055341.91-084002.4 | 88.4246476 | -8.6673536 | 15.78 | 0.05 | 14.75 | 0.07 | 11.55 | 0.18 | ||||||
| PSO J088.4246-08.6672 | 20 | 0 | 23.21 | 0.16 | 22.04 | 0.08 | 21.15 | 0.03 | 21.19 | 0.08 | 20.63 | 0.11 | ||
| M082444.81-102943.6 | 345.4 | 16.0 | 15.5 | - | - | SUGAR | ||||||||
| J082444.78-102943.4 | 126.1866017 | -10.4954068 | 15.42 | 0.04 | 14.70 | 0.06 | 11.28 | 0.16 | ||||||
| PSO J126.1867-10.4951 | 5 | 82 | 18.72 | 0.01 | 18.36 | 0.01 | 18.23 | 0.01 | 18.18 | 0.01 | 18.18 | 0.01 | ||
| M085838.19+093745.2 | 421.5 | 17.7 | 17.3 | - | - | SALT | ||||||||
| J085838.21+093745.8 | 134.6592162 | 9.6293919 | 15.94 | 0.06 | 14.86 | 0.07 | 11.6 | 0.21 | ||||||
| PSO J134.6591+09.6292 | 5 | 59 | 20.79 | 0.04 | 20.29 | 0.03 | 19.79 | 0.02 | 19.6 | 0.03 | 19.27 | 0.02 | ||
| M110125.00-212429.4 | 215.3 | - | - | SALT | ||||||||||
| J110125.01-212429.6 | 165.3542383 | -21.4082386 | 16.21 | 0.06 | 15.52 | 0.116 | 11.95 | - | ||||||
| PSO J165.3542-21.4083 | 31 | 7 | - 21.61 | 0.05 | 21.41 | 0.04 | 20.98 | 0.04 | 20.48 | 0.05 | 20.94 | 0.16 | ||
| M111457.57-051721.4 | 325.7 | 17.3 | 14.3 | - | - | SALT | ||||||||
| J111457.53-051721.8 | 168.7397484 | -5.2893949 | 17.81 | 0.23 | 16.06 | 0.20 | 11.96 | 0.31 | ||||||
| - | - | - | - | - | - | - | - | - | - | - | - | - | ||
| M112712.45-073512.7 | 459.5 | 14.6 | 17.6 | 57.9 | - | SALT | ||||||||
| J112712.40-073512.2 | 171.8016899 | -7.5867435 | 14.8 | 0.03 | 14.03 | 0.04 | 10.96 | 0.12 | ||||||
| PSO J171.8018-07.5867 | 10 | 40 | 21.35 | 0.09 | 20.97 | 0.11 | 20.76 | 0.09 | 20.2 | 0.11 | 19.81 | 0.15 | ||
| M120746.68-133201.0 | 203.2 | 17.7 | 17.1 | - | - | SALT | ||||||||
| J120746.69-133200.3 | 181.9445650 | -13.5334438 | 17.34 | 0.16 | 16.42 | 0.26 | 12.08 | - | ||||||
| PSO J181.9446-13.5335 | 5 | 37 | 21.14 | 0.07 | 20.6 | 0.1 | 20.48 | 0.07 | 20.21 | 0.05 | 19.95 | 0.12 | ||
| M121157.77-192607.5 | 479.8 | 14.0 | 17.2 | 63.2 | - | SALT | ||||||||
| J121157.73-192607.7 | 182.9905819 | -19.4354923 | 15.89 | 0.05 | 15.1 | 0.08 | 11.89 | 0.33 | ||||||
| PSO J182.9906-19.4355 | 5 | 39 | -999 | -999 | 21.47 | 0.05 | 20.67 | 0.03 | 20.27 | 0.05 | -999 | -999 | ||
| M124553.81-161645.2 | 516.2 | 17.2 | 16.7 | - | - | SALT | ||||||||
| J124553.74-161645.7 | 191.4739578 | -16.2793658 | 15.13 | 0.04 | 13.99 | 0.04 | 10.56 | 0.09 | ||||||
| PSO J191.4739-16.2794 | 5 | 66 | 20.66 | 0.05 | 20.2 | 0.05 | 20.03 | 0.06 | 19.58 | 0.03 | 19.28 | 0.08 | ||
| M130508.50-285042.0 | 328.4 | 17.0 | 15.8 | - | - | SALT | ||||||||
| J130508.44-285041.8 | 196.2851755 | -28.8449497 | 16.05 | 0.05 | 15.05 | 0.07 | 11.81 | 0.21 | ||||||
| PSO J196.2853-28.8450 | 5 | 7 | 22.15 | 0.07 | 21.69 | 0.18 | -999 | -999 | 21.05 | 0.07 | -999 | -999 | ||
| M131403.21+084209.5 | 267.1 | 16.6 | 16.3 | - | - | SALT | ||||||||
| J131403.18+084209.2 | 198.5132651 | 8.7025622 | 15.72 | 0.04 | 14.73 | 0.06 | 11.62 | 0.18 | ||||||
| PSO J198.5133+08.7025 | 5 | 36 | 21.55 | 0.06 | 21.21 | 0.05 | 20.35 | 0.18 | 20.49 | 0.06 | 19.87 | 0.16 | ||
| M135547.91-094756.5 | 322.7 | 19.0 | 15.9 | - | - | SALT | ||||||||
| J135547.87-094754.7 | 208.9494924 | -9.7985281 | 17.72 | 0.21 | 16.35 | 0.25 | 12.33 | - | ||||||
| PSO J208.9496-09.7987 | 5 | 38 | 21.73 | 0.05 | 21.4 | 0.03 | 21.06 | 0.06 | 20.83 | 0.09 | 20.04 | 0.16 | ||
| M162422.33-301252.0 | 282.6 | 15.5 | 14.1 | - | - | SALT | ||||||||
| J162422.36-301251.8 | 246.0931921 | -30.2143945 | 15.56 | 0.05 | 14.59 | 0.06 | 11.48 | 0.18 | ||||||
| - | - | - | - | - | - | - | - | - | - | - | - | - | ||
| M200429.50-101433.1 | 286.4 | 18.5 | 15.3 | - | - | SALT | ||||||||
| J200429.41-101432.1 | 301.1225449 | -10.2422589 | 15.55 | 0.05 | 14.59 | 0.06 | 11.3 | 0.19 | ||||||
| PSO J301.1225-10.2423 | 5 | 44 | 21.55 | 0.04 | 21.64 | 0.1 | 21.03 | 0.06 | 20.71 | 0.11 | 20.2 | 0.14 | ||
| M214230.92-244440.1 | 290.5 | 17.8 | 17.0 | - | - | SALT | ||||||||
| J214230.94-244438.7 | 325.6289573 | -24.7440982 | 14.75 | 0.03 | 13.84 | 0.04 | 10.71 | 0.11 | ||||||
| PSO J325.6290-24.7441 | 5 | 79 | 21.02 | 0.06 | 20.36 | 0.04 | 19.29 | 0.02 | 19.28 | 0.11 | 19.31 | 0.09 | ||
| M215720.05-360411.1 | 256.4 | 18.8 | 17.1 | - | - | SALT | ||||||||
| J215719.97-360412.8 | 329.3332138 | -36.0702417 | 16.43 | 0.07 | 15.51 | 0.11 | 12.2 | 0.54 | ||||||
| - | - | - | - | - | - | - | - | - | - | - | - | - | ||
| M222359.11+121338.9 | 246.4 | 16.1 | 15.2 | - | - | NOT | ||||||||
| J222359.07+121339.1 | 335.9961626 | 12.2275338 | 15.05 | 0.04 | 13.99 | 0.04 | 10.76 | 0.15 | ||||||
| PSO J335.9962+12.2275 | 5 | 47 | 21.48 | 0.17 | 21.14 | 0.04 | 20.61 | 0.03 | 20.2 | 0.07 | 19.88 | 0.1 | ||
| M223240.99-144226.7 | 396.0 | 17.2 | 16.7 | - | - | SALT | ||||||||
| J223240.91-144227.4 | 338.1704879 | -14.7076348 | 16.25 | 0.08 | 15.46 | 0.12 | 11.88 | - | ||||||
| PSO J338.1706-14.7075 | 5 | 51 | 20.43 | 0.02 | 20.51 | 0.03 | 19.91 | 0.03 | 19.99 | 0.03 | 19.82 | 0.03 | ||
| M224500.21-343030.0 | 396.6 | 17.8 | 16.9 | - | - | SALT | ||||||||
| J224500.08-343031.6 | 341.2503530 | -34.5087858 | 15.0 | 0.03 | 14.33 | 0.05 | 10.89 | 0.10 | ||||||
| - | - | - | - | - | - | - | - | - | - | - | - | - | ||
| M233004.06-052447.7 | 303.5 | 17.5 | 17.0 | - | - | SALT | ||||||||
| J233004.05-052447.4 | 352.516875 | -5.4131766 | 16.32 | 0.07 | 15.39 | 0.11 | 11.83 | - | ||||||
| PSO J352.5168-05.4132 | 67 | 10 | 21.41 | 0.03 | 20.91 | 0.02 | 20.56 | 0.02 | 20.17 | 0.03 | 20.19 | 0.08 | ||
| - | - | - | - | - | - | - | - | - | - | - | - | - | ||
| M233405.71-022517.8 | 219.1 | 19.3 | 17.1 | - | - | SALT | ||||||||
| J233405.72-022518.2 | 353.5238400 | -2.4217257 | 16.48 | 0.08 | 15.48 | 0.12 | 11.92 | - | ||||||
| PSO J353.5239-02.4215 | 5 | 26 | 21.83 | 0.02 | 21.62 | 0.13 | 21.07 | 0.05 | 21.08 | 0.04 | -999 | -999 | ||
| Dark fields (27) | ||||||||||||||
| M010253.16-120541.3 | 370.1 | 14.4 | 25.1 | - | SALT | |||||||||
| J010253.22-120541.2 | 15.7217535 | -12.0948007 | 16.76 | 0.10 | 16.04 | 0.20 | 11.99 | - | ||||||
| PSO J015.7218-12.0948 | 1 | 0 | 22.99 | 0.17 | 23.25 | 0.16 | 22.82 | 0.13 | 23.54 | 0.61 | 22.51 | 0.55 | ||
| M012156.62-265747.8 | 244 | - | - | SALT | ||||||||||
| J012156.60-265747.7 | 20.485842 | -26.9632715 | 16.75 | 0.09 | 15.68 | 0.12 | 11.89 | - | ||||||
| - | - | - | - | - | - | - | - | - | - | - | - | - | ||
| M051700.70+071225.2 | 203.4 | - | - | SALT | ||||||||||
| J051700.70+071225.3 | 79.2529287 | 7.2070517 | 16.44 | 0.08 | 15.33 | 0.10 | 11.6 | - | ||||||
| PSO J079.2529+07.2070 | 3 | 0 | 23.54 | 0.31 | 22.31 | 0.09 | 21.99 | 0.08 | 21.53 | 0.12 | 21.29 | 0.20 | ||
| M064255.16-325917.6 | 240.6 | - | - | SALT | ||||||||||
| J064255.14-325918.2 | 100.7297545 | -32.9883921 | 16.17 | 0.05 | 14.86 | 0.05 | 11.19 | 0.11 | ||||||
| - | - | - | - | - | - | - | - | - | - | - | - | - | ||
| M084548.34-111800.1 | 264.4 | - | - | SUGAR | ||||||||||
| J084548.25-111801.7 | 131.4510672 | -11.300489 | 16.18 | 0.06 | 15.29 | 0.09 | 12.03 | 0.30 | ||||||
| PSO J131.4512-11.3001 | 0 | 0 | 23.88 | 0.85 | 23.26 | 0.30 | 23.2 | 0.15 | 21.88 | 0.18 | 23.05 | 1.68 | ||
| M095414.75+125222.6 | 355.7 | - | - | NOT | ||||||||||
| J095414.78+125222.5 | 148.5616137 | 12.8729286 | 16.95 | 0.13 | 15.74 | 0.143 | 11.79 | - | ||||||
| - | - | - | - | - | - | - | - | - | - | - | - | - | ||
| M095903.16-023604.5 | 269.1 | - | - | SALT | ||||||||||
| J095903.12-023604.5 | 149.7630038 | -2.6012773 | 16.75 | 0.10 | 15.61 | 0.129 | 12.12 | - | ||||||
| PSO J149.7632-02.6013 | 6 | 0 | 23.76 | 0.23 | 22.80 | 0.13 | 21.98 | 0.07 | 21.76 | 0.08 | 22.15 | 0.49 | ||
| M101448.67-294433.7 | 229 | - | - | SALT | ||||||||||
| J101448.55-294433.5 | 153.7023142 | -29.7426467 | 16.19 | 0.06 | 15.41 | 0.09 | 12.35 | - | ||||||
| - | - | - | - | - | - | - | - | - | - | - | - | - | ||
| M101730.54-384643.7 | 336.5 | - | - | SALT | ||||||||||
| J101730.47-384643.8 | 154.3769644 | -38.7788586 | 16.41 | 0.07 | 15.57 | 0.11 | 11.92 | 0.25 | ||||||
| - | - | - | - | - | - | - | - | - | - | - | - | - | ||
| M101838.68-222502.4 | 288.1 | - | - | SALT | ||||||||||
| J101838.61-222501.9 | 154.6608814 | -22.4172125 | 16.29 | 0.06 | 15.43 | 0.10 | 11.91 | - | ||||||
| - | - | - | - | - | - | - | - | - | - | - | - | - | ||
| M104015.57+062747.0 | 600.4 | - | - | SALT | ||||||||||
| J104015.61+062745.9 | 160.0650746 | 6.4627552 | 17.32 | 0.17 | 16.42 | 0.273 | 11.96 | - | ||||||
| - | - | - | - | - | - | - | - | - | - | - | - | - | ||
| M110552.25-015628.1 | 477.5 | 26.6 | -76.3 | - | SALT | |||||||||
| J110552.18-015627.1 | 166.4674275 | -1.9408789 | 15.49 | 0.04 | 14.45 | 0.05 | 10.73 | 0.101 | ||||||
| PSO J166.4675-01.9408 | 11 | 1 | 22.29 | 0.07 | 22.10 | 0.07 | 21.61 | 0.08 | 21.35 | 0.08 | 21.42 | 0.26 | ||
| M114450.43-145502.7 | 444 | 14.4 | 57.1 | - | SALT | |||||||||
| J114450.42-145501.9 | 176.2100931 | -14.9171983 | 16.05 | 0.06 | 15.45 | 0.137 | 12.27 | - | ||||||
| PSO J176.2101-14.9172 | 3 | 0 | 23.45 | 0.25 | 23.01 | 0.12 | 22.09 | 0.07 | 21.44 | 0.11 | 20.94 | 0.14 | ||
| M115855.48-170524.7 | 359.5 | 48.1 | 75.2 | - | SALT | |||||||||
| J115855.44-170523.7 | 179.7310087 | -17.0899371 | 16.41 | 0.07 | 15.40 | 0.12 | 12.10 | 0.42 | ||||||
| PSO J179.7312-17.0901 | 2 | 1 | 22.74 | 0.15 | 22.47 | 0.11 | 23.14 | 0.32 | 22.39 | 0.24 | 22.18 | 0.31 | ||
| M121128.51-351003.4 | 280.1 | - | - | SALT | ||||||||||
| J121128.44-351002.5 | 182.8685401 | -35.1673751 | 14.9 | 0.03 | 14.17 | 0.041 | 11.25 | 0.14 | ||||||
| - | - | - | - | - | - | - | - | - | - | - | - | - | ||
| M125203.09-040638.5 | 392.6 | - | - | SALT | ||||||||||
| J125203.15-040638.4 | 193.01315 | -4.1106828 | 16.69 | 0.09 | 16.02 | 0.19 | 12.45 | - | ||||||
| - | - | - | - | - | - | - | - | - | - | - | - | - | ||
| M131615.50-242824.1 | 234.7 | - | - | SALT | ||||||||||
| J131615.51-242822.8 | 199.0646338 | -24.4730071 | 16.56 | 0.07 | 15.90 | 0.14 | 12.50 | 0.36 | ||||||
| PSO J199.0646-24.4733 | 0 | 0 | 22.77 | 0.13 | 22.61 | 0.13 | 22.51 | 0.13 | 22.79 | 0.32 | 21.48 | 0.23 | ||
| M133621.59-105243.4 | 397.3 | 14.7 | 50.5 | - | SALT | |||||||||
| J133621.66-105243.7 | 204.090252 | -10.8788322 | 17.43 | 0.16 | 16.43 | 0.23 | 12.44 | - | ||||||
| - | - | - | - | - | - | - | - | - | - | - | - | - | ||
| M135150.53-243921.3 | 225.5 | - | - | SALT | ||||||||||
| J135150.35-243920.1 | 207.9598266 | -24.6555845 | 16.05 | 0.06 | 15.3 | 0.10 | 12.27 | - | ||||||
| PSO J207.9601-24.6557 | 1 | 0 | 25.19 | 1.32 | 23.24 | 0.26 | 22.39 | 0.18 | 21.28 | 0.08 | 20.97 | 0.16 | ||
| M140807.52+095348.1 | 261.9 | - | - | SALT | ||||||||||
| J140807.50+095347.6 | 212.031289 | 9.8965777 | 16.27 | 0.06 | 15.43 | 0.10 | 12.41 | 0.36 | ||||||
| PSO J212.0314+09.8964 | 1 | 0 | 25.18 | 1.30 | 25.19 | 1.11 | 23.60 | 0.28 | 21.99 | 0.14 | 21.60 | 0.27 | ||
| M152601.27+071525.5 | 288.2 | - | - | SALT | ||||||||||
| J152601.29+071525.2 | 231.5053995 | 7.2570161 | 17.42 | 0.14 | 16.46 | 0.23 | 12.35 | 0.31 | ||||||
| PSO J231.5054+07.2570 | 0 | 0 | 25.64 | 1.55 | 23.43 | 0.29 | 23.34 | 0.19 | 23.46 | 0.41 | 25.87 | 9.37 | ||
| M154044.18-145528.3 | 313.1 | - | - | SALT | ||||||||||
| J154044.17-145529.7 | 235.1840445 | -14.9249201 | 16.94 | 0.13 | 16.12 | 0.24 | 11.72 | - | ||||||
| - | - | - | - | - | - | - | - | - | - | - | - | - | ||
| M164548.19-121024.8 | 386.1 | - | - | SALT | ||||||||||
| J164548.18-121025.3 | 251.4507554 | -12.1736957 | 16.46 | 0.09 | 15.59 | 0.13 | 12.03 | - | ||||||
| PSO J251.4509-12.1734 | 2 | 0 | 25.70 | 1.61 | 23.29 | 0.24 | 22.17 | 0.07 | 21.19 | 0.07 | 20.90 | 0.14 | ||
| M195302.23-203633.0 | 516.4 | - | - | SALT | ||||||||||
| J195302.24-203631.7 | 298.2593374 | -20.6088241 | 16.68 | 0.10 | 15.61 | 0.17 | 12.29 | - | ||||||
| - | - | - | - | - | - | - | - | - | - | - | - | - | ||
| M204439.43-182852.2 | 219.5 | - | - | SALT | ||||||||||
| J204439.40-182851.4 | 311.1641793 | -18.4809453 | 16.42 | 0.08 | 15.38 | 0.107 | 12.12 | - | ||||||
| PSO J311.1644-18.4812 | 4 | 0 | -999.0 | -999.0 | 22.63 | 0.10 | 22.18 | 0.05 | 21.87 | 0.13 | -999.0 | -999.0 | ||
| M211410.44-105558.3 | 280.3 | - | - | SALT | ||||||||||
| J211410.40-105557.6 | 318.5433725 | -10.93268 | 16.51 | 0.09 | 15.76 | 0.16 | 12.21 | - | ||||||
| PSO J318.5431-10.9326 | 0 | 0 | -999.0 | 0.65 | 24.06 | 0.67 | 23.64 | 0.26 | 22.24 | 0.18 | 23.02 | 1.10 | ||
| M225813.47-095817.2 | 225.7 | - | - | SUGAR | ||||||||||
| J225813.45-095816.7 | 344.5560625 | -9.9713208 | 17.37 | 0.17 | 16.52 | 0.34 | 12.19 | - | ||||||
| - | - | - | - | - | - | - | - | - | - | - | - | - | ||
Note. —
Column 1: NVSS ID based on Right Ascension and Declination (J2000); M stands for MALS SALT-NOT survey. Column 2: 20 cm flux density from NVSS. Columns 3 - 5: deconvolved radio sources size from NVSS (major and minor axes in arcseconds, and position angle in degrees).
Column 6: spectroscopic redshift based on SALT-NOT spectra. Column 7: telescope used for spectroscopy. SUGAR = observed with both SALT and NOT. Column 8: AGN-type (G or Q corresponding to narrow or broad line AGN).
Columns 9 - 17 : WISE ID and , and magnitudes (mag) with errors.
Column 18 - 30: PS1 ID, number of stack detections, number of single epoch detections in all filters, and g, r, i, z and y magnitudes with errors from PS1-mean for sources with redshifts and ELLs, and PS1-stack for DFs.
List of targets excluded from the NOT sample presented in Table 1 of Krogager et al. (2018): M024944.50+123706.3, M051938.34+174641.2, M163906.46+114409.2, M162303.03+123958.4, M060012.92-071037.9, M162539.34-041616.3 and M172423.07+032632.5 (see also Section 2.2).
Appendix B Notes on individual targets
Here we briefly summarize the properties of interesting individual targets relevant to discussions in Sections 5.2 to 5.5.
B.1 AGN at
-
1.
M0314-0909 (= 0.312) and M1024-0852 (= 0.455): The associated radio emission has projected linear sizes of kpc.
-
2.
M01330256 (= 0.259) and M1703+0645 (=0.399): These show double peaked emission lines. For the former, the AGN host also shows signs of interaction with a nearby galaxy.
-
3.
J0609+0217 (= 0.174) and M12191809 (= 0.189): The host galaxies are part of an interacting group of galaxies.
B.2 AGN at
-
1.
M09093133 (= 0.884): The radio emission associated with this NLAGN has an extent of 330 kpc. The optical spectrum is shown in Fig. 5).
-
2.
M2220+1307 (= 0.760): The projected linear size of radio emission associated with this BLAGN is 180 kpc.
-
3.
M1440+0531, M2058-1736 and M2059-1440: These have distorted radio morphologies suggesting interaction with the ambient medium.
B.3 AGN at
-
1.
M05523459 (= 1.776): This NLAGN has clear detections of He ii, C iii], C ii] and Ne iv (see Fig. 5). The FWHM measured based on the C iii] emission line is 835 km s-1. At 3 GHz, the associated radio emission is resolved into two lobes separated by ″(71 kpc).
-
2.
M10331210 (= 1.328): Krogager et al. (2018) identified this as a NLAGN based on the presence of narrow [O ii] line and the absence of broad emission lines like Mg ii and C iii]. In this case too the radio emission is resolved into a double lobed morphology with a separation of ″(28 kpc).
-
3.
M09561317 (= 1.198): The associated radio emission has an extent of ″(194 kpc), which is the largest in our sample among the AGN at .
B.4 AGN at
-
1.
M0516+0732 (= 2.594): The radio emission associated with this NLAGN is compact with a deconvolved size of ″, i.e., kpc. It also shows strong continuum emission in the optical spectrum. The C iv emission profile may be affected by the associated absorption. We measure the to C iv emission line ratio, fLyα/f = 2.400.10. This is similar to the ratios observed in high- radio galaxies.
-
2.
M13152745 (= 1.911): The radio emission associated with this NLAGN exhibits a double-lobed morphology with an extent of ″(280 kpc). We detect emission lines of C iv, He ii, C iii], C ii] and Ne iv. The optical continuum emission is very weak. While we do not clearly detect the AGN in PS1 images, it is clearly seen in the WISE image. The deconvolved velocity width of the C iv emission line is 375 km s-1. The ratio /f is found to be 1.880.34. This is typical of ratios observed in high- radio galaxies (see for example figure 6 of Shukla et al., 2021a, and references therein) but more than what is seen in typical quasars.
-
3.
M14550957 (= 1.995): The double-lobed radio emission associated with this NLAGN has an extent of ″(i.e., 69 kpc). The optical and IR characteristics are also very similar to M13152745. The C iv, He ii, C iii], C ii] and Ne iv emission lines are clearly detected. The deconvolved velocity width of the C iv emission line is 430 km s-1. We estimate /f = 0.690.14, which is again typical of the ratios observed in high- radio galaxies.
-
4.
M1513-2524 (= 3.132): This NLAGN is associated with a double-lobed radio emission with an extent of (184 kpc). It exhibits extended , C iv and He ii emission. The detailed analysis of this object is presented by Shukla et al. (2021a).
References
- Acero et al. (2015) Acero, F., Ackermann, M., Ajello, M., et al. 2015, ApJS, 218, 23, doi: 10.1088/0067-0049/218/2/23
- Assef et al. (2018) Assef, R. J., Stern, D., Noirot, G., et al. 2018, ApJS, 234, 23, doi: 10.3847/1538-4365/aaa00a
- Assef et al. (2010) Assef, R. J., Kochanek, C. S., Brodwin, M., et al. 2010, ApJ, 713, 970, doi: 10.1088/0004-637X/713/2/970
- Balashev & Noterdaeme (2018) Balashev, S. A., & Noterdaeme, P. 2018, MNRAS, 478, L7, doi: 10.1093/mnrasl/sly067
- Ballet et al. (2020) Ballet, J., Burnett, T. H., Digel, S. W., & Lott, B. 2020, arXiv e-prints, arXiv:2005.11208. https://arxiv.org/abs/2005.11208
- Barrows et al. (2021) Barrows, R. S., Comerford, J. M., Stern, D., & Assef, R. J. 2021, arXiv e-prints, arXiv:2107.02815. https://arxiv.org/abs/2107.02815
- Becker et al. (2000) Becker, R. H., White, R. L., Gregg, M. D., et al. 2000, ApJ, 538, 72, doi: 10.1086/309099
- Becker et al. (1995) Becker, R. H., White, R. L., & Helfand, D. J. 1995, ApJ, 450, 559, doi: 10.1086/176166
- Boettcher et al. (2021) Boettcher, E., Chen, H.-W., Zahedy, F. S., et al. 2021, ApJ, 913, 18, doi: 10.3847/1538-4357/abf0a0
- Burgh et al. (2003) Burgh, E. B., Nordsieck, K. H., Kobulnicky, H. A., et al. 2003, in Society of Photo-Optical Instrumentation Engineers (SPIE) Conference Series, Vol. 4841, Proc. SPIE, ed. M. Iye & A. F. M. Moorwood, 1463–1471
- Chambers et al. (2016) Chambers, K. C., Magnier, E. A., Metcalfe, N., et al. 2016, arXiv e-prints, arXiv:1612.05560. https://arxiv.org/abs/1612.05560
- Chang et al. (2017) Chang, Y. L., Arsioli, B., Giommi, P., & Padovani, P. 2017, A&A, 598, A17, doi: 10.1051/0004-6361/201629487
- Coatman et al. (2016) Coatman, L., Hewett, P. C., Banerji, M., & Richards, G. T. 2016, MNRAS, 461, 647, doi: 10.1093/mnras/stw1360
- Combes et al. (2021) Combes, F., Gupta, N., Muller, S., et al. 2021, arXiv e-prints, arXiv:2101.00188. https://arxiv.org/abs/2101.00188
- Condon et al. (1998) Condon, J. J., Cotton, W. D., Greisen, E. W., et al. 1998, AJ, 115, 1693, doi: 10.1086/300337
- Crawford et al. (2010) Crawford, S. M., Still, M., Schellart, P., et al. 2010, in Proc. SPIE, Vol. 7737, Observatory Operations: Strategies, Processes, and Systems III, 773725
- Cutri & et al. (2014) Cutri, R. M., & et al. 2014, VizieR Online Data Catalog, II/328
- D’Abrusco et al. (2019) D’Abrusco, R., Álvarez Crespo, N., Massaro, F., et al. 2019, ApJS, 242, 4, doi: 10.3847/1538-4365/ab16f4
- Denney et al. (2010) Denney, K. D., Peterson, B. M., Pogge, R. W., et al. 2010, ApJ, 721, 715, doi: 10.1088/0004-637X/721/1/715
- Ellison et al. (2001) Ellison, S. L., Yan, L., Hook, I. M., et al. 2001, A&A, 379, 393, doi: 10.1051/0004-6361:20011281
- Ellison et al. (2008) Ellison, S. L., York, B. A., Pettini, M., & Kanekar, N. 2008, MNRAS, 388, 1349, doi: 10.1111/j.1365-2966.2008.13482.x
- Fabian (2012) Fabian, A. C. 2012, ARA&A, 50, 455, doi: 10.1146/annurev-astro-081811-125521
- Frank & Péroux (2010) Frank, S., & Péroux, C. 2010, MNRAS, 406, 2235, doi: 10.1111/j.1365-2966.2010.16848.x
- Ghisellini et al. (2014) Ghisellini, G., Celotti, A., Tavecchio, F., Haardt, F., & Sbarrato, T. 2014, MNRAS, 438, 2694, doi: 10.1093/mnras/stt2394
- Gupta et al. (2005) Gupta, N., Srianand, R., & Saikia, D. J. 2005, MNRAS, 361, 451, doi: 10.1111/j.1365-2966.2005.09169.x
- Gupta et al. (2017) Gupta, N., Srianand, R., Baan, W., et al. 2017, ArXiv e-prints. https://arxiv.org/abs/1708.07371
- Gupta et al. (2021a) Gupta, N., Jagannathan, P., Srianand, R., et al. 2021a, ApJ, 907, 11, doi: 10.3847/1538-4357/abcb85
- Gupta et al. (2021b) Gupta, N., Srianand, R., Shukla, G., et al. 2021b, arXiv e-prints, arXiv:2103.09437. https://arxiv.org/abs/2103.09437
- Heckman & Best (2014) Heckman, T. M., & Best, P. N. 2014, ARA&A, 52, 589, doi: 10.1146/annurev-astro-081913-035722
- Hickox & Alexander (2018) Hickox, R. C., & Alexander, D. M. 2018, ARA&A, 56, 625, doi: 10.1146/annurev-astro-081817-051803
- Jauncey et al. (1991) Jauncey, D. L., Reynolds, J. E., Tzioumis, A. K., et al. 1991, Nature, 352, 132, doi: 10.1038/352132a0
- Jonas & MeerKAT Team (2016) Jonas, J., & MeerKAT Team. 2016, in Proceedings of MeerKAT Science: On the Pathway to the SKA. 25-27 May, 2016 Stellenbosch, South Africa (MeerKAT2016), 1
- Kapahi et al. (1998) Kapahi, V. K., Athreya, R. M., van Breugel, W., McCarthy, P. J., & Subrahmanya, C. R. 1998, ApJS, 118, 275, doi: 10.1086/313144
- Kaspi et al. (2000) Kaspi, S., Smith, P. S., Netzer, H., et al. 2000, ApJ, 533, 631, doi: 10.1086/308704
- Kobulnicky et al. (2003) Kobulnicky, H. A., Nordsieck, K. H., Burgh, E. B., et al. 2003, in Society of Photo-Optical Instrumentation Engineers (SPIE) Conference Series, Vol. 4841, Proc. SPIE, ed. M. Iye & A. F. M. Moorwood, 1634–1644
- Krogager et al. (2019) Krogager, J.-K., Fynbo, J. P. U., Møller, P., et al. 2019, MNRAS, 486, 4377, doi: 10.1093/mnras/stz1120
- Krogager et al. (2018) Krogager, J. K., Gupta, N., Noterdaeme, P., et al. 2018, ApJS, 235, 10, doi: 10.3847/1538-4365/aaab51
- Lacy et al. (2004) Lacy, M., Storrie-Lombardi, L. J., Sajina, A., et al. 2004, ApJS, 154, 166, doi: 10.1086/422816
- Lacy et al. (2020) Lacy, M., Baum, S. A., Chandler, C. J., et al. 2020, PASP, 132, 035001, doi: 10.1088/1538-3873/ab63eb
- Laor (2000) Laor, A. 2000, ApJ, 543, L111, doi: 10.1086/317280
- Ledoux et al. (2003) Ledoux, C., Petitjean, P., & Srianand, R. 2003, MNRAS, 346, 209, doi: 10.1046/j.1365-2966.2003.07082.x
- Liu et al. (2010) Liu, X., Shen, Y., Strauss, M. A., & Greene, J. E. 2010, ApJ, 708, 427, doi: 10.1088/0004-637X/708/1/427
- Lu et al. (2007) Lu, Y., Wang, T., Zhou, H., & Wu, J. 2007, AJ, 133, 1615, doi: 10.1086/512034
- Masci et al. (2019) Masci, F. J., Laher, R. R., Rusholme, B., et al. 2019, PASP, 131, 018003, doi: 10.1088/1538-3873/aae8ac
- Massaro et al. (2009) Massaro, E., Giommi, P., Leto, C., et al. 2009, A&A, 495, 691, doi: 10.1051/0004-6361:200810161
- Mateos et al. (2012) Mateos, S., Alonso-Herrero, A., Carrera, F. J., et al. 2012, MNRAS, 426, 3271, doi: 10.1111/j.1365-2966.2012.21843.x
- Mathur & Nair (1997) Mathur, S., & Nair, S. 1997, ApJ, 484, 140, doi: 10.1086/304327
- Mauch et al. (2003) Mauch, T., Murphy, T., Buttery, H. J., et al. 2003, MNRAS, 342, 1117, doi: 10.1046/j.1365-8711.2003.06605.x
- McConnell et al. (2020) McConnell, D., Hale, C. L., Lenc, E., et al. 2020, PASA, 37, e048, doi: 10.1017/pasa.2020.41
- Mullaney et al. (2013) Mullaney, J. R., Alexander, D. M., Fine, S., et al. 2013, MNRAS, 433, 622, doi: 10.1093/mnras/stt751
- Murphy & Liske (2004) Murphy, M. T., & Liske, J. 2004, MNRAS, 354, L31, doi: 10.1111/j.1365-2966.2004.08374.x
- Muzahid et al. (2015) Muzahid, S., Srianand, R., & Charlton, J. 2015, MNRAS, 448, 2840, doi: 10.1093/mnras/stv133
- Nandra et al. (1997) Nandra, K., George, I. M., Mushotzky, R. F., Turner, T. J., & Yaqoob, T. 1997, ApJ, 476, 70, doi: 10.1086/303600
- Netzer et al. (2007) Netzer, H., Lutz, D., Schweitzer, M., et al. 2007, ApJ, 666, 806, doi: 10.1086/520716
- Noterdaeme et al. (2008) Noterdaeme, P., Ledoux, C., Petitjean, P., & Srianand, R. 2008, A&A, 481, 327, doi: 10.1051/0004-6361:20078780
- Noterdaeme et al. (2009) Noterdaeme, P., Petitjean, P., Ledoux, C., & Srianand, R. 2009, A&A, 505, 1087, doi: 10.1051/0004-6361/200912768
- Noterdaeme et al. (2015) Noterdaeme, P., Srianand, R., Rahmani, H., et al. 2015, A&A, 577, A24, doi: 10.1051/0004-6361/201425376
- Onken et al. (2004) Onken, C. A., Ferrarese, L., Merritt, D., et al. 2004, ApJ, 615, 645, doi: 10.1086/424655
- Padovani et al. (2017) Padovani, P., Alexander, D. M., Assef, R. J., et al. 2017, A&A Rev., 25, 2, doi: 10.1007/s00159-017-0102-9
- Parks et al. (2018) Parks, D., Prochaska, J. X., Dong, S., & Cai, Z. 2018, MNRAS, 476, 1151, doi: 10.1093/mnras/sty196
- Pei et al. (1991) Pei, Y. C., Fall, S. M., & Bechtold, J. 1991, ApJ, 378, 6, doi: 10.1086/170401
- Petitjean et al. (2000) Petitjean, P., Srianand, R., & Ledoux, C. 2000, A&A, 364, L26
- Planck Collaboration et al. (2020) Planck Collaboration, Aghanim, N., Akrami, Y., et al. 2020, A&A, 641, A6, doi: 10.1051/0004-6361/201833910
- Pontzen & Pettini (2009) Pontzen, A., & Pettini, M. 2009, MNRAS, 393, 557, doi: 10.1111/j.1365-2966.2008.14193.x
- Pramesh Rao & Subrahmanyan (1988) Pramesh Rao, A., & Subrahmanyan, R. 1988, MNRAS, 231, 229, doi: 10.1093/mnras/231.2.229
- Rector & Stocke (2001a) Rector, T. A., & Stocke, J. T. 2001a, AJ, 122, 565, doi: 10.1086/321179
- Rector & Stocke (2001b) —. 2001b, AJ, 122, 565, doi: 10.1086/321179
- Richards et al. (2002) Richards, G. T., Fan, X., Newberg, H. J., et al. 2002, AJ, 123, 2945, doi: 10.1086/340187
- Richards et al. (2006) Richards, G. T., Lacy, M., Storrie-Lombardi, L. J., et al. 2006, ApJS, 166, 470, doi: 10.1086/506525
- Sanders & Mirabel (1996) Sanders, D. B., & Mirabel, I. F. 1996, ARA&A, 34, 749, doi: 10.1146/annurev.astro.34.1.749
- Satyapal et al. (2017) Satyapal, S., Secrest, N. J., Ricci, C., et al. 2017, ApJ, 848, 126, doi: 10.3847/1538-4357/aa88ca
- Shankar et al. (2008) Shankar, F., Dai, X., & Sivakoff, G. R. 2008, ApJ, 687, 859, doi: 10.1086/591488
- Shen et al. (2011) Shen, Y., Richards, G. T., Strauss, M. A., et al. 2011, ApJS, 194, 45, doi: 10.1088/0067-0049/194/2/45
- Shukla et al. (2021a) Shukla, G., Srianand, R., Gupta, N., et al. 2021a, MNRAS, 501, 5362, doi: 10.1093/mnras/staa3977
- Shukla et al. (2021b) —. 2021b, arXiv e-prints, arXiv:2109.00576. https://arxiv.org/abs/2109.00576
- Sikora & Begelman (2013) Sikora, M., & Begelman, M. C. 2013, ApJ, 764, L24, doi: 10.1088/2041-8205/764/2/L24
- Sikora et al. (2007) Sikora, M., Stawarz, Ł., & Lasota, J.-P. 2007, ApJ, 658, 815, doi: 10.1086/511972
- Srianand et al. (2012) Srianand, R., Gupta, N., Petitjean, P., et al. 2012, MNRAS, 421, 651, doi: 10.1111/j.1365-2966.2011.20342.x
- Srianand & Kembhavi (1997) Srianand, R., & Kembhavi, A. 1997, ApJ, 478, 70, doi: 10.1086/303764
- Stern et al. (2005) Stern, D., Eisenhardt, P., Gorjian, V., et al. 2005, ApJ, 631, 163, doi: 10.1086/432523
- Stern et al. (2012) Stern, D., Assef, R. J., Benford, D. J., et al. 2012, ApJ, 753, 30, doi: 10.1088/0004-637X/753/1/30
- Stickel et al. (1991) Stickel, M., Padovani, P., Urry, C. M., Fried, J. W., & Kuehr, H. 1991, ApJ, 374, 431, doi: 10.1086/170133
- Taylor et al. (2009) Taylor, A. R., Stil, J. M., & Sunstrum, C. 2009, ApJ, 702, 1230, doi: 10.1088/0004-637X/702/2/1230
- Urry & Padovani (1995) Urry, C. M., & Padovani, P. 1995, PASP, 107, 803, doi: 10.1086/133630
- Vaughan et al. (2003) Vaughan, S., Edelson, R., Warwick, R. S., & Uttley, P. 2003, MNRAS, 345, 1271, doi: 10.1046/j.1365-2966.2003.07042.x
- Vestergaard & Peterson (2006) Vestergaard, M., & Peterson, B. M. 2006, ApJ, 641, 689, doi: 10.1086/500572
- Waters et al. (2020) Waters, C. Z., Magnier, E. A., Price, P. A., et al. 2020, ApJS, 251, 4, doi: 10.3847/1538-4365/abb82b
- Wiklind & Combes (1996) Wiklind, T., & Combes, F. 1996, Nature, 379, 139, doi: 10.1038/379139a0
- Wolfe et al. (2005) Wolfe, A. M., Gawiser, E., & Prochaska, J. X. 2005, ARA&A, 43, 861
- Wolfe & Prochaska (2000) Wolfe, A. M., & Prochaska, J. X. 2000, ApJ, 545, 591, doi: 10.1086/317860
- Wright et al. (2010) Wright, E. L., Eisenhardt, P. R. M., Mainzer, A. K., et al. 2010, AJ, 140, 1868, doi: 10.1088/0004-6256/140/6/1868
- Zahedy et al. (2020) Zahedy, F. S., Chen, H.-W., Boettcher, E., et al. 2020, ApJ, 904, L10, doi: 10.3847/2041-8213/abc48d