Structural characteristics in network control of molecular multiplex networks
Abstract
Numerous real-world systems can be naturally modeled as multilayer networks, enabling an efficient way to characterize those complex systems. Much evidence in the context of system biology indicated that the collections between different molecular networks can dramatically impact the global network functions. Here, we focus on the molecular multiplex networks coupled by the transcriptional regulatory network (TRN) and protein-protein interaction (PPI) network, exploring the controllability and energy requiring in these types of molecular multiplex networks. We find that the driver nodes tend to avoid essential or pathogen-related genes. Yet, imposing the external inputs to these essential or pathogen-related genes can remarkably reduce the energy cost, implying their crucial role in network control. Moreover, we find that lower minimal driver nodes as well as energy requiring are associated with disassortative coupling between TRN and PPI networks. Our findings in several species provide comprehensive understanding of genes’ roles in biology and network control.
I Introduction
Networks are prevalent in exploring the phenomenons and principles of our daily lives, e.g., traffic [1, 2], financial [3, 4], biological [5, 6, 7, 8] and social systems [9, 10]. As the ultimate goal to explore these systems is to drive them into desired states, numerous advances have been achieved against network control [11, 12, 13]. Controllability as the first step of controlling, quantifies if the system can be driven from any initial state to any desired state within finite time with finite external inputs. Liu et al. [11] creatively combined the structural controllability theory with complex networks and proposed a method to determine the minimal number of inputs (driver nodes) to fully control the directed networks. Exact controllability is another framework to analyze the controllability of complex networks with arbitrary structures and link weights [14]. Meanwhile, the minimal inputs [15, 16], optimal control strategy [17, 18], and structural characteristics of network in controlling have been explored [19, 20, 21, 22]. Though the network is completely controllable in theory, it could be difficult to control it in practice due to the huge energy requiring. Consequently, much effort has been expended on various mechanisms in determining the energy cost of network control [23, 24, 25, 26, 27, 28, 29, 30, 31].
Functioning of many systems usually requires the coupling between different types of networks [32, 33, 34, 35, 36]. Such as traffic systems are constituted by road network, railway network, subway network and so on [37]. Communication systems include different on-line and offline social networks [38, 39]. Biological networks also function as the consequences of complex interactions between different molecular networks [40, 41, 42, 43]. For instance, proteins in the protein-protein interaction network (PPI) are translated from genes in the transcriptional regulatory network (TRN) [40].
Recently, Mahajan et al. [40] explored the interactions between TRN and PPI networks of different species and revealed the impact of multiplex architectures in network robustness. They found that the functionally essential genes and proteins are situated in important parts of the multiplex networks. Here, we examine the association between genes’ functional characteristics and their roles in the network control. We show that imposing external inputs to these essential or pathogen-related genes can efficiently reduce the control energy, despite the minimal driver nodes set tends to avoid them. Moreover, we find that negative correlation between TRN and PPI layer can simultaneously decrease the number of driver nodes and energy requiring.
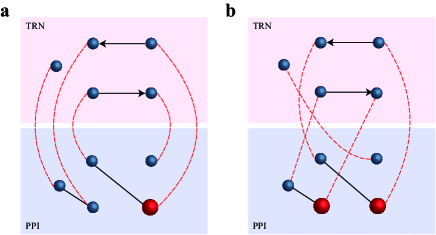
II Model
Here, transcriptional regulatory networks (TRN) represent the interactions among transcription factors and their target genes. Edges in the TRN encode direct interactions between a transcription factor and its target genes. In protein-protein interaction networks (PPI), each node represents a protein and undirected link denotes the physical or binding interactions. Coupling links between layers represent the interaction between the genes in TRN and the proteins in PPI, in which the proteins translated from genes could also regulate other genes. The coupling between TRN and PPI layers is one-to-one correspondence, i.e., a gene in TRN is collected to a corresponding protein in PPI layer [40]. The Schematic diagram of the multiplex networks is shown in Figure 1. We employ the datasets in Ref. [40], which are collected from 7 species: H. pylori [44, 45], M. tuberculosis [46, 47], E. coli [48, 49, 50], C. elegans [50, 51, 52], A. thaliana [50, 51, 53], M. musculus [50, 51, 54], and H. sapiens [50, 51, 54]. Since TRN and PPI networks have different coverage of the genome and proteome, only the genes and proteins presented in both layers are considered in our analysis.
Formally, the dynamics of each node in TRN-PPI multiplex networks is described by
| (1) |
where is the state of nodes at time . and are the size of TRN and PPI networks, respectively. captures the nonlinear dynamics of each node, and is the external inputs imposed on the multiplex networks. For simplicity, assuming the system is at a fixed point , where , and , . Equation 1 can be linearized as
| (2) |
where is the global adjacency matrix of the network and captures the interactions between nodes. Whereas, () describes the connections between nodes within TRN (PPI) networks and () captures the intra-connections between TRN and PPI networks. represents how the external inputs are imposed on nodes.
Note that if the linear system 2 is locally controllable along a trajectory in state space, then the corresponding nonlinear system 1 is also controllable along the same trajectory. In addition, the linear control predictions are consistent with control of nonlinear dynamics [5]. Hereafter, to apply the controllability and control energy framework, we focus on the linear system 2.
III Methods
III.1 Minimal driver nodes and control energy
A system is controllable if it can be driven from any initial state to any desired state with finite external inputs within finite time. The nodes imposed on external inputs are driver nodes, and the minimal number of driver nodes measures the controllability of a network, defined as , and . According to exact controllability framework [14], can be calculated as
| (3) |
where represent the eigenvalues of adjacency matrix, and is the geometric multiplicity. Moreover, the minimal driver nodes set can be identified in to satisfy the equation
| (4) |
where refers to the eigenvalue according to the maximum geometric multiplicity . It was noted that the rank of matrix is determined by the number of linearly independent rows. By performing the elementary column transformation on the matrix , we can obtain the linearly dependent rows. Therefore, the external inputs described by should be imposed on the rows to eliminate all linear correlations to make the matrix full-ranked, and the corresponding minimal driver nodes set can be identified [14].
On the basis of optimal control theory [55], the energy required to control the system is . If the initial state at , the minimal control energy is
| (5) |
where is the Gramian matrix. As the control energy decays to a nonzero stationary value with increasing time , the control energy discussed here is , and the Gramian matrix is . We set the elements as , where to ensure the stability of the whole system.
III.2 Degree-degree correlation
Associativity between TRN and PPI layers is measured by the Pearson’s correlation coefficient [56]
| (6) | ||||
where is the out-degree of node in the TRN network, is the degree of node in the PPI network and is the number of nodes in each layer.
III.3 Simulated annealing
To finely tune the degree-degree correlation coefficient of multiplex networks, we adopt the simulated annealing algorithm [57]:
1. Randomly shuffle gene labels in the TRN network, while keep protein labels in the PPI network unchanged. Then calculate the absolute difference between the shuffled and desired degree-degree correlations as , where is the present correlation between nodes with degree in TRN and nodes with degree in the PPI. is the desired correlation. Save the present gene labeling in the TRN network.
2. Randomly select a subset of size (we use ) from the genes in the TRN network, and shuffle their labels randomly. Save this modified labeling of the TRN as a new sampling. Then define the new difference as , where is degree-degree correlation of the present network after randomly shuffling genes labels, and is the desired correlation.
3. Calculate the difference . If , accept the labeling proposed in step 2 as the current labeling for TRN. Otherwise, accept the labeling proposed in step 2 with probability , where is temperature, is the iteration number and is rate parameter. The parameters are set as , .
4. If is smaller than the defined value (here we set the defined value as ) then stop, else repeat from the step 2.
IV Results
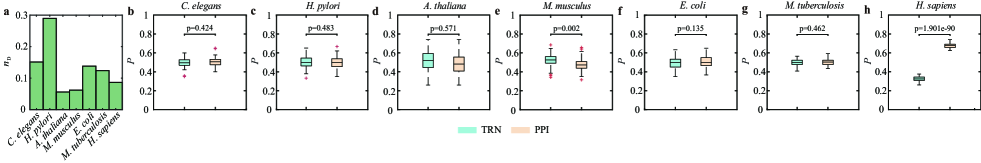
To reflect the controllability of these TRN-PPI multilayer molecular networks, we firstly examine the minimal driver nodes to achieve fully control of the network in each species (Figure 2(a)). The characteristics of networks for each species is shown in Table 1. We find that overall those networks display lower , indicating that we need to independently control about nodes to fully control them. With the smallest average degree, H. pylori yields the highest . This is consistent with previous finding that sparse network is more difficult to control. Then, we examine the distribution of driver nodes between two layers, implying that these driver nodes do not have any particular preference between two layers for most of species (Figure 2(b)-(h)). However, we find that the fraction of driver nodes associated with PPI layer is significantly larger than that of TRN layer for H. sapiens (p-value0.001). To understand such difference, we calculate the average degree of TRN and PPI layer, respectively (Table 1), showing that the difference of average degree between two layers is most obviously in H. sapiens species. The density difference between two layers leads to the uneven distribution of driver nodes in TRN and PPI networks.
| Species | |||||
|---|---|---|---|---|---|
| C. elegans | 628 | 821 | 285 | 2.62 | 1.82 |
| H. pylori | 228 | 156 | 76 | 1.37 | 1.33 |
| A. thaliana | 482 | 385 | 398 | 1.60 | 3.30 |
| M. musculus | 920 | 1,269 | 518 | 2.76 | 2.25 |
| E. coli | 434 | 147 | 154 | 0.68 | 1.42 |
| M. tuberculosis | 1,542 | 958 | 946 | 1.24 | 2.45 |
| H. sapiens | 3,172 | 4,838 | 4,280 | 3.05 | 5.40 |
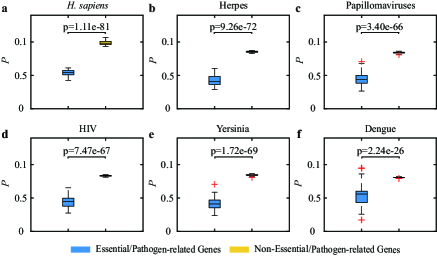
The essential and pathogen-related genes are critical for survival and healthy status of an organism, thus conveying particular topological characteristics in the corresponding multiplex networks [40]. Hence, we examine whether those essential or pathogen-related genes are associated with prominent role in the network control. To achieve this, we adopt the gene categories in Ref. [40], where essential genes for human species are collected from the Online GEne Essentiality (OGEE) database [58, 59], and five human pathogens from a publicly available database HPIDB 3.0 [60, 61]. Then, we compare the fractions of essential or pathogen-related genes and non-essential or nonpathogen-related genes are selected as the driver nodes, respectively. Figure 3 indicates that proportion of essential or pathogen-related genes selected as driver nodes is significantly lower than that of non-essential or nonpathogen-related genes (p-value0.001), regardless of species. The fundamental role of these essential or pathogen-related genes is usually reflected as the higher degree in TRN layer. Yet, most of the driver nodes tend to be the lower degree ones in control [11].
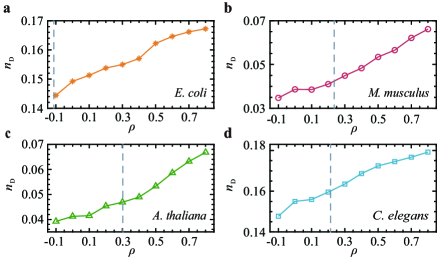
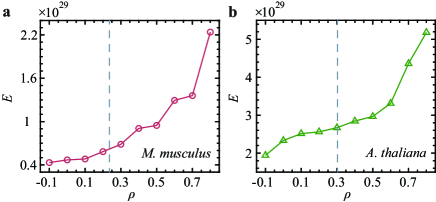
We further explore the impact of interlayer correlation on the controllability of networks. Note that the interactions between TRN and PPI networks have already been established by their biological relationships. The purpose of our analysis is to reveal whether the underlying coupling pattern in reality can be partially explained in a network control manner. Therefore, we finely tune the correlation between TRN and PPI layer through simulated annealing algorithm, finding that more driver nodes will be required as the network is transited from disassortative to assortative (see Figure 4). We note that the real interlayer correlation for the four species are mostly positive. We also assess how degree correlation determines the energy requiring in network control. We again finely tune the interlayer correlation by rewiring the links. To eliminate the impact of different driver nodes sets, all nodes are independently controlled. We find that control energy in terms of degree correlation displays the similar trajectory as we observed in (in Figure 4), i.e., multiplex networks with disassortative coupling between layers are easier to control than that of assortative coupling (see Figure 5).
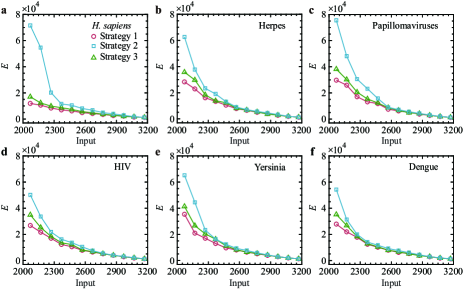
Finally, we examine whether those essential genes can provide critical role in the energy requiring for TRN-PPI multiplex network control. Subsequently, we propose three driver nodes selection strategies with given : (1) All essential or pathogen-related genes, saying are selected as driver nodes, then the remaining driver nodes are selected randomly. (2) driver nodes are selected based on descending order of nodes degree. (3) All driver nodes are select at random. Interestingly, we find that the control energies of these three strategies exhibit quite consistent implication that controlling those essential or pathogen-related genes yields the lowest energy requiring. These results imply the critical role of essential or pathogen-related genes in the network control, despite the driver nodes tend to avoid them.
V conclusion
Interactions between networks are ubiquitous in molecular networks. Here, we focus on multiplex networks coupled with transcriptional regulatory network (TRN) and protein-protein interaction (PPI) network, to explore the minimal driver nodes and the energy requiring for fully control. The results indicate there is no obvious preference for driver nodes distribution in two layers, and the driver nodes are more likely to avoid the essential or pathogen-related genes. Besides, the TRN-PPI networks with positive degree-degree correlation of interlayer need more driver nodes and more energy to achieve fully control. By comparing different strategies of selecting driver nodes, we find the TRN-PPI networks requiring the lowest energy to reach the desired state by driving essential or pathogen-related genes. Our work bridge the gap between structural characteristics of molecular multiplex networks and the network control. It will be helpful for understanding the essential genes’ function in biology and network control.
Acknowledgements.
This work was supported by the National Natural Science Foundation of China (No.61763013), The Natural Science Foundation of Jiangxi Province (No.20202BABL212008), and the Jiangxi Provincial Postdoctoral Preferred Project of China (No.2017KY37).References
- Albert and Barabási [2002] R. Albert and A.-L. Barabási, Statistical mechanics of complex networks, Reviews of Modern Physics 74, 47 (2002).
- Newman [2003] M. E. Newman, The structure and function of complex networks, SIAM Review 45, 167 (2003).
- Mantegna and Stanley [1999] R. N. Mantegna and H. E. Stanley, Introduction to econophysics: correlations and complexity in finance (Cambridge University Press, 1999).
- Jiang et al. [2019] Z.-Q. Jiang, W.-J. Xie, W.-X. Zhou, and D. Sornette, Multifractal analysis of financial markets: a review, Reports on Progress in Physics 82, 125901 (2019).
- Yan et al. [2017] G. Yan, P. E. Vértes, E. K. Towlson, Y. L. Chew, D. S. Walker, W. R. Schafer, and A.-L. Barabási, Network control principles predict neuron function in the caenorhabditis elegans connectome, Nature 550, 519 (2017).
- Power et al. [2011] J. D. Power, A. L. Cohen, S. M. Nelson, G. S. Wig, K. A. Barnes, J. A. Church, A. C. Vogel, T. O. Laumann, F. M. Miezin, B. L. Schlaggar, et al., Functional network organization of the human brain, Neuron 72, 665 (2011).
- Jeong et al. [2001] H. Jeong, S. P. Mason, A.-L. Barabási, and Z. N. Oltvai, Lethality and centrality in protein networks, Nature 411, 41 (2001).
- Lee et al. [2002] T. I. Lee, N. J. Rinaldi, F. Robert, D. T. Odom, Z. Bar-Joseph, G. K. Gerber, N. M. Hannett, C. T. Harbison, C. M. Thompson, I. Simon, et al., Transcriptional regulatory networks in saccharomyces cerevisiae, Science 298, 799 (2002).
- Deng et al. [2018] C. Deng, C. Ye, L. Wang, Z. Rong, and X. Wang, Peer pressure and incentive mechanisms in social networks, EPL (Europhysics Letters) 121, 18003 (2018).
- Wang et al. [2013] X. Wang, H. Zhang, S. Nie, and B. Wang, Evolution of public cooperation with weighted and conditional strategies, Physica A: Statistical Mechanics and its Applications 392, 4668 (2013).
- Liu et al. [2011] Y.-Y. Liu, J.-J. Slotine, and A.-L. Barabási, Controllability of complex networks, Nature 473, 167 (2011).
- Liu and Barabási [2016] Y.-Y. Liu and A.-L. Barabási, Control principles of complex systems, Reviews of Modern Physics 88, 035006 (2016).
- Li and Liu [2019] A. Li and Y.-Y. Liu, Controlling network dynamics, Advances in Complex Systems 22, 1950021 (2019).
- Yuan et al. [2013] Z. Yuan, C. Zhao, Z. Di, W.-X. Wang, and Y.-C. Lai, Exact controllability of complex networks, Nature Communications 4, 1 (2013).
- Pósfai et al. [2013] M. Pósfai, Y.-Y. Liu, J.-J. Slotine, and A.-L. Barabási, Effect of correlations on network controllability, Scientific Reports 3, 1 (2013).
- Xiang et al. [2019] L. Xiang, F. Chen, W. Ren, and G. Chen, Advances in network controllability, IEEE Circuits and Systems Magazine 19, 8 (2019).
- Gao et al. [2014] J. Gao, Y.-Y. Liu, R. M. D’souza, and A.-L. Barabási, Target control of complex networks, Nature Communications 5, 1 (2014).
- Xiao et al. [2014] Y.-D. Xiao, S.-Y. Lao, L.-L. Hou, and L. Bai, Edge orientation for optimizing controllability of complex networks, Physical Review E 90, 042804 (2014).
- Nepusz and Vicsek [2012] T. Nepusz and T. Vicsek, Controlling edge dynamics in complex networks, Nature Physics 8, 568 (2012).
- Jia et al. [2013] T. Jia, Y.-Y. Liu, E. Csóka, M. Pósfai, J.-J. Slotine, and A.-L. Barabási, Emergence of bimodality in controlling complex networks, Nature Communications 4, 1 (2013).
- Zhao et al. [2015] C. Zhao, W.-X. Wang, Y.-Y. Liu, and J.-J. Slotine, Intrinsic dynamics induce global symmetry in network controllability, Scientific Reports 5, 1 (2015).
- Wang et al. [2015] X.-W. Wang, S. Nie, W.-X. Wang, and B.-H. Wang, Controlling complex networks with conformity behavior, EPL (Europhysics Letters) 111, 68004 (2015).
- Yan et al. [2012] G. Yan, J. Ren, Y.-C. Lai, C.-H. Lai, and B. Li, Controlling complex networks: How much energy is needed?, Physical Review Letters 108, 218703 (2012).
- Sun and Motter [2013] J. Sun and A. E. Motter, Controllability transition and nonlocality in network control, Physical Review Letters 110, 208701 (2013).
- Yan et al. [2015] G. Yan, G. Tsekenis, B. Barzel, J.-J. Slotine, Y.-Y. Liu, and A.-L. Barabási, Spectrum of controlling and observing complex networks, Nature Physics 11, 779 (2015).
- Nie et al. [2016] S. Nie, X.-W. Wang, B.-H. Wang, and L.-L. Jiang, Effect of correlations on controllability transition in network control, Scientific Reports 6, 1 (2016).
- Chen et al. [2016a] Y.-Z. Chen, L.-Z. Wang, W.-X. Wang, and Y.-C. Lai, Energy scaling and reduction in controlling complex networks, Royal Society Open Science 3, 160064 (2016a).
- Lindmark and Altafini [2018] G. Lindmark and C. Altafini, Minimum energy control for complex networks, Scientific Reports 8, 1 (2018).
- Wang et al. [2017] L.-Z. Wang, Y.-Z. Chen, W.-X. Wang, and Y.-C. Lai, Physical controllability of complex networks, Scientific Reports 7, 1 (2017).
- Nie et al. [2018] S. Nie, H. E. Stanley, S.-M. Chen, B.-H. Wang, and X.-W. Wang, Control energy of complex networks towards distinct mixture states, Scientific Reports 8, 1 (2018).
- Pasqualetti et al. [2014] F. Pasqualetti, S. Zampieri, and F. Bullo, Controllability metrics, limitations and algorithms for complex networks, IEEE Transactions on Control of Network Systems 1, 40 (2014).
- Yuan et al. [2014] Z. Yuan, C. Zhao, W.-X. Wang, Z. Di, and Y.-C. Lai, Exact controllability of multiplex networks, New Journal of Physics 16, 103036 (2014).
- Nie et al. [2015] S. Nie, X. Wang, and B. Wang, Effect of degree correlation on exact controllability of multiplex networks, Physica A: Statistical Mechanics and its Applications 436, 98 (2015).
- Lee et al. [2015] K.-M. Lee, B. Min, and K.-I. Goh, Towards real-world complexity: an introduction to multiplex networks, The European Physical Journal B 88, 1 (2015).
- Battiston et al. [2014] F. Battiston, V. Nicosia, and V. Latora, Structural measures for multiplex networks, Physical Review E 89, 032804 (2014).
- Zhu et al. [2019] P. Zhu, X. Wang, S. Li, Y. Guo, and Z. Wang, Investigation of epidemic spreading process on multiplex networks by incorporating fatal properties, Applied Mathematics and Computation 359, 512 (2019).
- Solé-Ribalta et al. [2016] A. Solé-Ribalta, S. Gómez, and A. Arenas, Congestion induced by the structure of multiplex networks, Physical Review Letters 116, 108701 (2016).
- Mucha et al. [2010] P. J. Mucha, T. Richardson, K. Macon, M. A. Porter, and J.-P. Onnela, Community structure in time-dependent, multiscale, and multiplex networks, Science 328, 876 (2010).
- Cozzo et al. [2013] E. Cozzo, R. A. Banos, S. Meloni, and Y. Moreno, Contact-based social contagion in multiplex networks, Physical Review E 88, 050801 (2013).
- Mahajan and Dar [2021] T. Mahajan and R. D. Dar, Internetwork connectivity of molecular networks across species of life, Scientific Reports 11, 1 (2021).
- Maniatis and Reed [2002] T. Maniatis and R. Reed, An extensive network of coupling among gene expression machines, Nature 416, 499 (2002).
- Barabasi and Oltvai [2004] A.-L. Barabasi and Z. N. Oltvai, Network biology: understanding the cell’s functional organization, Nature Reviews Genetics 5, 101 (2004).
- Yeger-Lotem et al. [2004] E. Yeger-Lotem, S. Sattath, N. Kashtan, S. Itzkovitz, R. Milo, R. Y. Pinter, U. Alon, and H. Margalit, Network motifs in integrated cellular networks of transcription–regulation and protein–protein interaction, Proceedings of the National Academy of Sciences 101, 5934 (2004).
- Danielli et al. [2010] A. Danielli, G. Amore, and V. Scarlato, Built shallow to maintain homeostasis and persistent infection: insight into the transcriptional regulatory network of the gastric human pathogen helicobacter pylori, PLoS Pathog 6, e1000938 (2010).
- Häuser et al. [2014] R. Häuser, A. Ceol, S. V. Rajagopala, R. Mosca, G. Siszler, N. Wermke, P. Sikorski, F. Schwarz, M. Schick, S. Wuchty, et al., A second-generation protein–protein interaction network of helicobacter pylori, Molecular & Cellular Proteomics 13, 1318 (2014).
- Sanz et al. [2011] J. Sanz, J. Navarro, A. Arbués, C. Martín, P. C. Marijuán, and Y. Moreno, The transcriptional regulatory network of mycobacterium tuberculosis, PloS One 6, e22178 (2011).
- Wang et al. [2010] Y. Wang, T. Cui, C. Zhang, M. Yang, Y. Huang, W. Li, L. Zhang, C. Gao, Y. He, Y. Li, et al., Global protein- protein interaction network in the human pathogen mycobacterium tuberculosis h37rv, Journal of Proteome Research 9, 6665 (2010).
- Salgado et al. [2018] H. Salgado, I. Martínez-Flores, V. H. Bustamante, K. Alquicira-Hernández, J. S. García-Sotelo, D. García-Alonso, and J. Collado-Vides, Using RegulonDB, the escherichia coli k-12 gene regulatory transcriptional network database, Current Protocols in Bioinformatics 61, 1 (2018).
- Rajagopala et al. [2014] S. V. Rajagopala, P. Sikorski, A. Kumar, R. Mosca, J. Vlasblom, R. Arnold, J. Franca-Koh, S. B. Pakala, S. Phanse, A. Ceol, et al., The binary protein-protein interaction landscape of escherichia coli, Nature Biotechnology 32, 285 (2014).
- Das and Yu [2012] J. Das and H. Yu, Hint: High-quality protein interactomes and their applications in understanding human disease, BMC Systems Biology 6, 1 (2012).
- Chatr-Aryamontri et al. [2017] A. Chatr-Aryamontri, R. Oughtred, L. Boucher, J. Rust, C. Chang, N. K. Kolas, L. O’Donnell, S. Oster, C. Theesfeld, A. Sellam, et al., The BioGRID interaction database: 2017 update, Nucleic Acids Research 45, D369 (2017).
- Fuxman Bass et al. [2016] J. I. Fuxman Bass, C. Pons, L. Kozlowski, J. S. Reece-Hoyes, S. Shrestha, A. D. Holdorf, A. Mori, C. L. Myers, and A. J. Walhout, A gene-centered c. elegans protein–dna interaction network provides a framework for functional predictions, Molecular Systems Biology 12, 884 (2016).
- Jin et al. [2015] J. Jin, K. He, X. Tang, Z. Li, L. Lv, Y. Zhao, J. Luo, and G. Gao, An arabidopsis transcriptional regulatory map reveals distinct functional and evolutionary features of novel transcription factors, Molecular Biology and Evolution 32, 1767 (2015).
- Han et al. [2018] H. Han, J.-W. Cho, S. Lee, A. Yun, H. Kim, D. Bae, S. Yang, C. Y. Kim, M. Lee, E. Kim, et al., TRRUST v2: an expanded reference database of human and mouse transcriptional regulatory interactions, Nucleic Acids Research 46, D380 (2018).
- Rugh [1996] W. J. Rugh, Linear system theory (Prentice-Hall, Inc., 1996).
- Foster et al. [2010] J. G. Foster, D. V. Foster, P. Grassberger, and M. Paczuski, Edge direction and the structure of networks, Proceedings of the National Academy of Sciences 107, 10815 (2010).
- Kirkpatrick et al. [1983] S. Kirkpatrick, C. D. Gelatt, and M. P. Vecchi, Optimization by simulated annealing, Science 220, 671 (1983).
- Chen et al. [2016b] W.-H. Chen, G. Lu, X. Chen, X.-M. Zhao, and P. Bork, OGEE v2: an update of the online gene essentiality database with special focus on differentially essential genes in human cancer cell lines, Nucleic Acids Research , gkw1013 (2016b).
- Chen et al. [2012] W.-H. Chen, P. Minguez, M. J. Lercher, and P. Bork, OGEE: an online gene essentiality database, Nucleic Acids Research 40, D901 (2012).
- Kumar and Nanduri [2010] R. Kumar and B. Nanduri, HPIDB-a unified resource for host-pathogen interactions, in BMC Bioinformatics, Vol. 11 (Springer, 2010) pp. 1–6.
- Ammari et al. [2016] M. G. Ammari, C. R. Gresham, F. M. McCarthy, and B. Nanduri, HPIDB 2.0: a curated database for host–pathogen interactions, Database 2016 (2016).