Clogging a Porous Medium
Abstract
Flows through porous media can carry suspended and dissolved materials. These sediments may deposit inside the pore-space and alter its geometry. In turn, the changing pore structure modifies the preferential flow paths, resulting in a strong coupling between structural modifications and transport characteristics. Here, we compare two different models that lead to channel obstruction as a result of subsequent deposition. The first model randomly obstructs pore-throats across the porous medium, while in the second model the pore-throat with the highest flow rate is always obstructed first. By subsequently closing pores, we find that the breakdown of the permeability follows a power-law scaling, whose exponent depends on the obstruction model. The pressure jumps that occur during the obstruction process also follow a power-law distribution with the same universal scaling exponent as the avalanche size distribution of invasion percolation, independent of the model. This result suggests that the clogging processes and invasion percolation may belong to the same universality class.
I Introduction
The clogging of porous media by deposition of dissolved or suspended materials is a serious problem in many practically relevant applications [1, 2, 3]. For instances, particle deposition considerably reduces the permeability of porous filters and catalysts [4, 5] and has also a major impact on the flow rate reduction in drainage layers [6]. Deposition and calcification of minerals in porous rocks is also important in other fields of geoscience [7, 8, 9, 10, 11, 12] and carbon-sequestration [13, 14, 15, 16]. Due to its practical importance, the problem of clogging has extensively been studied experimentally and theoretically since the early 1980s [17, 18, 19, 20]. A major challenge in understanding the clogging process is the dynamic rearrangement of flow paths as a result of the changing pore geometry. This interplay between geometry and flow controls macroscopic properties such as the pressure drop required to maintain a certain flow rate or the bulk permeability across the pore space.
In most natural situations clogging occurs as a gradual process, where pores subsequently narrow and finally completely close the flow path. In order to simplify the modeling of this process, we make a quasi static approximation, where the pores are obstructed instantaneously and the fluid adjusts its flow path to the new conditions. Consequently, our model consists of two alternating steps: First, an obstruction process where a pore is closed based on an obstruction criterion, and second a flow calculation every time a new obstruction is inserted.
In analogy to filtration experiments small particles or solutes can be transported and trapped in any region of the porous medium, while the transport of larger particles mainly occurs mainly in high flow regions, and thus pores with higher flow rates [9]. Base on these observations, we analyze two different models to mimic the obstruction process in a porous medium. Our first model randomly obstructs pore-throats across the porous medium, while in the second model the pore-throat with the highest flow rate is always obstructed first.
Although the two models show distinct differences in the initial clogging stage, our results indicate that the final clogging transition just before the porous medium is completely closed follows universal scaling relations similar to those found for invasion percolation.
II Model and Simulations
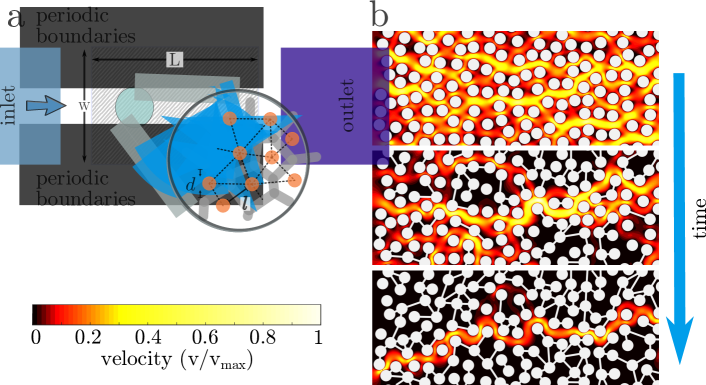
Natural porous media are typically disordered. Therefore, the porous medium used for our analysis consists of circular obstacles with non-dimensional diameter . These obstacles have been randomly placed in a rectangular domain of width and length measured in units of obstacle diameters, Fig.1. To avoid overlap, the minimal distance between two obstacles’ centers is set to , corresponding to a minimal throat width of . As the obstacles do not overlap, the porosity is controlled by the number of obstacles forming the pore zone: , Fig. 1(a).
Fluid is injected in positive -direction from the left to the right and flow boundary conditions are applied at the inlet and zero pressure gradient at the outlet, respectively (see Fig. 1(a)). Periodic boundary conditions at the top and bottom of the square domain allow to reduce finite size effects. For simplicity we only consider an incompressible Newtonian fluid at low Reynolds numbers. The Reynolds number of our system is defined by where is the fluid’s viscosity and its density.
On the pore scale, the steady state velocity and pressure fields are described by the incompressible Navier-Stokes equations
| (1) | |||||
| (2) |
which can be solved numerically using a control volume finite difference scheme [21]. To avoid recreating the numerical mesh every time a pore is obstructed, we included the shortest connection between two neighboring obstacles as a “internal edge”, often called “baffle” into the meshing routine. These internal edges are defined by the Delaunay triangulation network of the obstacles’ centers, Fig. 1(a). This trick highly facilitates process of the opening and closing of throats by simply changing the boundary conditions of the corresponding (internal) edge from “interior” (no effect on the flow) to “wall” (no-slip solid boundary on both sides of the edge). After re-calculating the pressure and velocity field, we determine the fluxes through the different pore throats [22]. The width of a pore throat is defined by the length of the Delaunay edge between two neighboring obstacles minus two obstacle radii, Fig. 1(b) and the direction of is chosen perpendicular to the Delaunay edge. Consequently the flux through each throat can readily be calculated using
| (3) |
were is the local velocity field calculated as the average over the local velocity vector along the corresponding edge of a pore throat. Using the local fluxes, we then apply our clogging rules by either randomly closing a Delaunay edge of the obstacle triangulation or by selecting the edge with the highest flux. The boundary condition of the corresponding edge in the numerical mesh are changed from “interior” to “wall”, which closes the throat with an impermeable membrane. After closing the throat we recalculate the pressure and velocity field. This process is then repeated interactively until all flow paths connecting the inlet with the outlet are closed. During this process we record local flow variables like fluxes through the pore throats as well as the macroscopic quantities such as the pressure drop or permeability across the whole pore zone.
III Results and discussion
Figure 1(b) shows three different snapshot of a typical simulation in which more and more pores are closed randomly (top to bottom). The increased channelization caused by the successive closing of pores is clearly visible, until only one single connected channel is left, as we can see in Fig. 1(b) (bottom).
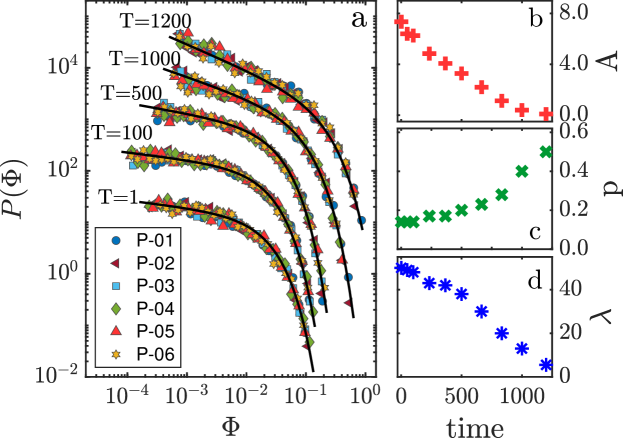
In order to quantify the effect of preferencial channeling of the flow during the clogging process, we calculate the flux through each throat and determine their distribution . Here are the normalized fluxes and is the total flux through the porous medium. Fig. 2 shows for the random throat model at different times during the clogging process. For our analysis we use six different realizations of the pore geometry with the same porosity each represented by a different marker in Fig. 2(a).
During the clogging process, a systematic change of can be observed. Initially, the distribution has the shape of a stretched exponential as reported by Araújo et. al. [22]. However, with progressive closing of pores a power-law component becomes more and more apparent. Using a fit of the form
| (4) |
we can quantify this transition by looking at the evolution of the control parameters , and as shown in Fig. 2 (b-d).
For the first few hundred steps, the exponent that controls the power-law regime, remains almost constant and then grows monotonically. Conversely the parameter , approaches zero leading to a more and more power-law shape distribution. Consequently, close to the complete obstruction the flow is very heterogeneously distributed in the porous medium with few active channels and many stagnant zones of low or no flow, see Fig. 1.
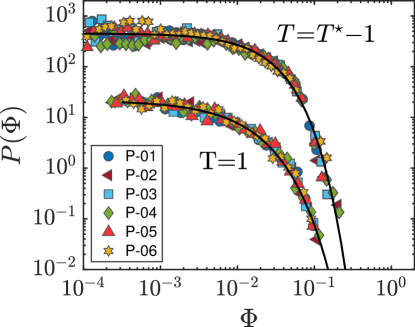
Surprisingly, a similar behavior cannot be observed in the case, where the pore-throats are obstructed according to the fluxes through the throats. In this case, does not change over time and preserves the original stretched exponential form during the whole clogging process as can be seen in Fig. 3.
We now draw our attention to the question how macroscopic quantities, such as the total permeability of the porous medium, are affected by the successive closing of pores.
For low Reynolds numbers the flow rate through the pore zone is a linear function of the applied pressure drop,
| (5) |
where the proportionality constant is called permeability [23, 24].
Figure 4 shows the evolution of the normalized permeability as a function of time for our two models, calculated for six different realizations of the pore space (P-01 to P-06). The random model is plotted in panel (a), while the max-flux model is shown in panel (b); the parameter , which is the initial permeability of the pore zone before starting the obstruction process, was used to normalize the different realizations. For both obstruction models two different regimes can be observed. Initially, the normalized permeability remains almost constant until reaching a point where it starts to decay rapidly.
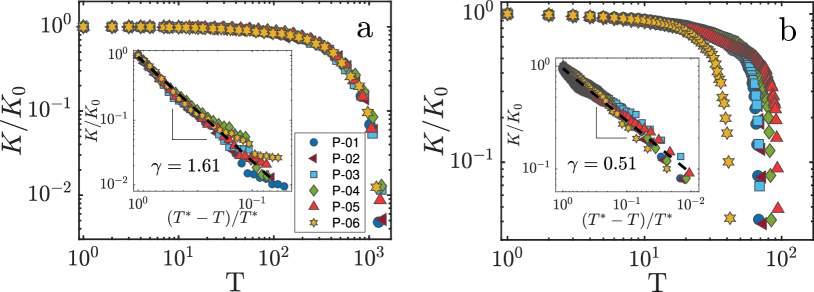
The exact time of the crossover depends on the details of the pore geometry and the obstruction process and occurs roughly one order of magnitude earlier in the max-flux case than in the random case. Note, in the max-flux case the obstruction sequence is already pre-determined by the pore geometry, while in the random case multiple different sequences are possible starting from the same initial configuration. After the crossover, the normalized permeabilities decay fast until the porous medium is completely blocked at (clogging time). While the main figure 4 shows the evolution of the permeability from the beginning of the obstruction process, the insets show the critical behavior when approaches the critical time . By centering and normalizing time with , we can compare the critical behavior of the two models around , even though the maximum flow model clogs the porous medium much faster. The critical breakdown of the permeability follows a power-law of the form
| (6) |
where the exponents which controls the power-law tail is for the random model Fig. 4(a) and for the max-flux model Fig. 4(b). This attests that in the maximum flux model the drop in permeability is more accentuated.
As we keep the flow rate constant during the obstruction process, the pressure drop between the entrance and outlet of the pore zone is not constant and increases over the course of the clogging process. The increase of the pressure drop does not happen continuously, but in bursts because some pores have a higher impact on the overall permeability than others [25, 26] and thus lead to a larger jump in the pressure drop across the pore zone.
Figure 5(a) shows an example of how the pressure drop across the pore zone changes over time for one sample of the random obstruction process (green) and another sample of the max flux case (orange). At the beginning of the clogging process the pressure bursts tend to be smaller and increase in magnitude towards the clogging transition. While the evolution of the pressure drop is very sensitive to the obstruction process and initial configuration, the statistics of the bursts is independent of those details.
In order to quantify the pressure bursts during the clogging process, we first calculate the size of the pressure jumps (Fig. 5(a)) for both obstruction model and then determine their respective distributions.
Figure 5(b) and (c) show the pressure jump distributions for the random and the max flux case, respectively, where the tails of both distributions follow a universal power-law with similar exponents. More precisely we find for the maximum flux model and for random obstruction model. In the case of random obstructions we also see a initial regime where the exponent is much smaller. This can be explained as follows: During the initial stage of the obstruction the possibility of closing an “important” channel is quite low. However with successive closing of pores this probability increases until at some point the random model behaves comparable to the max flux model with a similar critical exponent. It did not escape our attention, that the critical behavior of the pressure jumps follows a scaling law which is very similar to the avalanche size distribution of invasion percolation model (IP), namely [27, 28]. This behavior has also been confirmed experimentally [29].
Similar to invasion percolation, the underlying dynamics of the clogging is governed by extrema processes in a heterogeneous substrate — invading the capillary with the lowest pore pressure in IP or closing the channel with the highest flux in our max-flux model. In the case of random closing this process emerges only towards the end, when most pores are closed and even random closing has a high chance to select a pore with a extremal flux. This can be observed in Fig. 5(a) (green line), where towards the end of the clogging process, the largest jumps are followed by periods of minimal changes.
IV Conclusion
Our numerical study of the clogging process in a porous media has revealed that the subsequent closing of pores displays many characteristics of self organized criticality [30], including universal scaling laws. For the two different models of our analysis, we found that the permeability breaks down following a power law scaling. Specifically, we find scaling exponent of for the random obstruction model and when the pores with the highest flux is obstructed first, respectively. This result may provide new insights in the filtration as well in the drainage processes. Although the scaling exponents for how the permeability approaches the finite time singularity at are different for the two models, the distributions of the pressure jumps which occurs along with the successive closing of pores express a universal scaling similar to the one observed in the avalanche distribution of invasion percolation. The similarity in the exponents, together with the analogy of extremal selection, suggests that invasion percolation and the clogging of a porous medium may belong to the same universality class which can help to improve the understanding of the interplay between disordered pore substrate and the flowing fluid.
Acknowledgements.
The authors would like to thank the Brazilian agencies CNPq, CAPES and FUNCAP and the National Institute of Science and Technology for Complex Systems (INCT-SC) in Brazil and PetrobrPás (“Física do Petróleo em Meios Porosos”, Project Number: F0185) for financial support.References
- Baveye et al. [1998] P. Baveye, P. Vandevivere, B. L. Hoyle, P. C. DeLeo, and D. Sanchez de Lozada. Environmental impact and mechanisms of the biological clogging of saturated soils and aquifer materials. Crit. Rev. Environ. Sci. Technol., 28(2):123–191, 1998.
- Alem et al. [2015] A. Alem, N.-D. Ahfir, A. Elkawafi, and H. Wang. Hydraulic operating conditions and particle concentration effects on physical clogging of a porous medium. ”Transport Porous Med.”, 106(2):303–321, 2015.
- Herzig et al. [1970] J. P. Herzig, D. M. Leclerc, and P. Le Goff. Flow of suspensions through porous media—application to deep filtration. ”Ind. Eng. Chem. Res.”, 62(5):8–35, 1970.
- Ochi and Vernoux [1999] J. Ochi and J.-F. Vernoux. A two-dimensional network model to simulate permeability decrease under hydrodynamic effect of particle release and capture. ”Transport Porous Med.”, 37(3):303–325, 1999.
- Reddi et al. [2000] L. N. Reddi, X. Ming, M. G. Hajra, and I. M. Lee. Permeability reduction of soil filters due to physical clogging. ”J. Geotech. Geoenvion.”, 126(3):236–246, 2000.
- Sansalone et al. [2012] J. Sansalone, X. Kuang, G. Ying, and V. Ranieri. Filtration and clogging of permeable pavement loaded by urban drainage. ”Water Res.”, 46(20):6763–6774, 2012.
- Mays and Hunt [2005] D. C. Mays and J. R. Hunt. Hydrodynamic aspects of particle clogging in porous media. Environ. Sci. Technol., 39(2):577–584, 2005.
- Noiriel et al. [2004] C. Noiriel, P. Gouze, and D. Bernard. Investigation of porosity and permeability effects from microstructure changes during limestone dissolution. Geophys. Res. Lett., 31(24), 2004.
- McDowell-Boyer et al. [1986] L. M. McDowell-Boyer, J. R. Hunt, and N. Sitar. Particle transport through porous media. Water Resour. Res., 22(13):1901–1921, 1986.
- Shelton et al. [2016] J. L. Shelton, J. C. McIntosh, A. G. Hunt, T. L. Beebe, A. D. Parker, P. D. Warwick, M. Drake I. I., Ronald, and J. E. McCray. Determining CO2 storage potential during miscible CO2 enhanced oil recovery: noble gas and stable isotope tracers. Int. J. Greenh. Gas Control., 51:239–253, 2016.
- Upadhyay et al. [2015] V. K. Upadhyay, P. Szymczak, and A. J. C. Ladd. Initial conditions or emergence: What determines dissolution patterns in rough fractures? J. Geophys. Res. Solid Earth, 120(9):6102–6121, 2015.
- Osselin et al. [2016] F. Osselin, P. Kondratiuk, A. Budek, O. Cybulski, P. Garstecki, and P. Szymczak. Microfluidic observation of the onset of reactive-infitration instability in an analog fracture. Geophysical Research Letters, 43(13):6907–6915, 2016.
- Steefel et al. [2015] C. I. Steefel, C. A. J. Appelo, B. Arora, D. Jacques, T. Kalbacher, O. Kolditz, P. C. Lagneau, V.and Lichtner, K. U. Mayer, J. C. L. Meeussen, H. Shao, J. Simunek, N. Spycher, Yabusaki S. B., and G. T. Yeh. Reactive transport codes for subsurface environmental simulation. Comput. Geosci., 19(3):445–478, 2015.
- Cohen and Rothman [2015] Y. Cohen and D. H. Rothman. Mechanisms for mechanical trapping of geologically sequestered carbon dioxide. Proc. R. Soc. Lond. A, 471(2175):20140853, 2015.
- Stack [2015] A. G. Stack. Precipitation in pores: A geochemical frontier. Rev. Mineral. Geochem., 80(1):165–190, 2015.
- Soulaine et al. [2018] C. Soulaine, S. Roman, A. Kovscek, and H. A. Tchelepi. Pore-scale modelling of multiphase reactive flow: application to mineral dissolution with production of. J. Fluid Mech., 855:616–645, 2018.
- Tien [2013] C. Tien. Granular filtration of aerosols and hydrosols: Butterworths series in chemical engineering. Butterworth-Heinemann, 2013.
- Lee and Koplik [2001] J. Lee and J. Koplik. Network model for deep bed filtration. Phys. Fluids, 13(5):1076–1086, 2001.
- Vigneswaran and Chang [1989] S. Vigneswaran and J. S. Chang. Experimental testing of mathematical models describing the entire cycle of filtration. Water Res., 23(11):1413–1421, 1989.
- Salles and Adler [1993] J. F. Salles, J .and Thovert and P. M. Adler. Deposition in porous media and clogging. Chem. Eng. Sci., 48(16):2839–2858, 1993.
- Fluent [2015] ANSYS INC. Fluent. Ansys Fluent, 2015.
- Araújo et al. [2006] A. D. Araújo, W. B. Bastos, J. S. Andrade Jr, and H. J. Herrmann. Distribution of local fluxes in diluted porous media. Phys. Rev. E, 74(1):010401, 2006.
- Dullien [2012] F. A. L. Dullien. Porous media: fluid transport and pore structure. Academic press, 2012.
- Bear [1972] J. Bear. Dynamics of fluids in porous media. dover, new york. ISBN, 10(0486656756):C50, 1972.
- Jäger et al. [2017a] R. Jäger, M. Mendoza, and H. J. Herrmann. Mechanism behind erosive bursts in porous media. Phys. Rev. Lett., 119(12):124501, 2017a.
- Jäger et al. [2017b] R. Jäger, M. Mendoza, and H. J. Herrmann. Channelization in porous media driven by erosion and deposition. Phys. Rev. E, 95(1):013110, 2017b.
- Roux and Guyon [1989] S. Roux and E. Guyon. Temporal development of invasion percolation. Journal of Physics A: Mathematical and General, 22(17):3693, 1989.
- Araújo et al. [2004] A. D. Araújo, J. S. Andrade Jr, and H. J. Herrmann. Multiple invaded consolidating materials. Phys. Rev. E, 70(6):066150, 2004.
- Crandall et al. [2009] D. Crandall, G. Ahmadi, M. Ferer, and D. H. Smith. Distribution and occurrence of localized-bursts in two-phase flow through porous media. Physica A, 388(5):574–584, 2009.
- Bak [2013] P. Bak. How nature works: the science of self-organized criticality. Springer Science & Business Media, 2013.