Seismic Noise Background in the Baksan Neutrino Observatory
Abstract
In this paper we report a study of the seismic noise measured in the underground Baksan Neutrino Observatory in the framework of the site qualification for third generation Gravitational Wave detectors like the Einstein Telescope [1] and Cosmic Explorer [2]. The main spectral feature below 1 is the oceanic microseism, while for greater frequencies the measured horizontal and vertical accelerations approaches the Peterson low noise model. Using two synchronized seismometers we also studied the coherence in the microseismic band () between three underground stations located at , and from the tunnel entrance. Finally, on the base of our measurements we evaluate the Newtonian noise contribution from the seismic noise background of body waves.
pacs:
91.30.Ye, 04.80.Nn, 91.30.Fn1 Introduction
Gravitational waves predicted in the context of the Einstein theory of Relativity causes space to be stretched in one direction while simultaneously being squeezed in the perpendicular direction. The space-time strain, or change in length divided by length, induced by these waves can be up to ten thousand times smaller than the diameter of a proton.
The relative change in length is so low, , (corresponding to a displacement sensitivity of m over a distance of km) that a gravitational wave (GW) detector must be extremely sensitive to the strain change and shielded from several sources of noise as e.g. the ground motion, wind effect, lightning strikes, and in general seismic noise that can mimic or hide a gravitational wave signal.
The environmental noise is attenuated by enclosing the sensitive detector in ultra high vacuum chambers and adopting active and passive techniques. Both types of isolation increase the frequency bandwidth of the detector but, because of the huge gap between the residual r.m.s. motion of the ground ( m) and the displacement sensitivity of the detector, non-linear effects can limit significantly the performances and the design of the active control loops is a challenge. In addition, the seismic noise in the microseismic band (from 0.1 to hundreds of mHz) can couple to the residual tilt of suspended elements in the GW detector, disturbing the control loops of these elements. Moreover, the seismic random motion of the ground around the gravitational test masses results in a stochastic gravitational force acting directly on them, and subsequently produces an additional noise at the detector output. The latter is the so-called Newtonian Noise (NN) and poses a limit to the detector sensitivity in the frequency range below Hz. It is a direct gravitational coupling between the interferometer test masses and the surrounding medium in which compressional seismic waves propagates, generating mass density fluctuations. It is evident that this source of noise cannot be shielded or mechanically filtered. Therefore, finding a suitable quiet seismic environment is the first step in reducing these effects.
As part of the design study of a new generation of GW detectors, as the Einstein Telescope[1], we studied the seismic noise characteristics of various sites [17]. In particular, we explored underground locations that yield significant reduction in seismic power spectral density (PSD) in comparison with the sites hosting on surface the current GW interferometric detectors, like LIGO and Virgo. These PSD measurements are usually compared with the Peterson new high (NHNM) and low (NLNM) noise models [3], to give an empirical reference to the minimum or maximum seismic noise background that we can expect in a ground-based site on Earth.
In this paper we report the results of our measurement campaigns performed in the Baksan Neutrino laboratory. Two series of data have been collected with different instruments at distance of few years. In the following sections, after a presentation of the Baksan laboratory and the geological structure of this geographic area, we summarize the results obtained in 2013 and in 2018. Then we conclude with a Newtonian noise estimation given the measured seismic background at the site.
2 The Baksan Neutrino Observatory and its rock composition
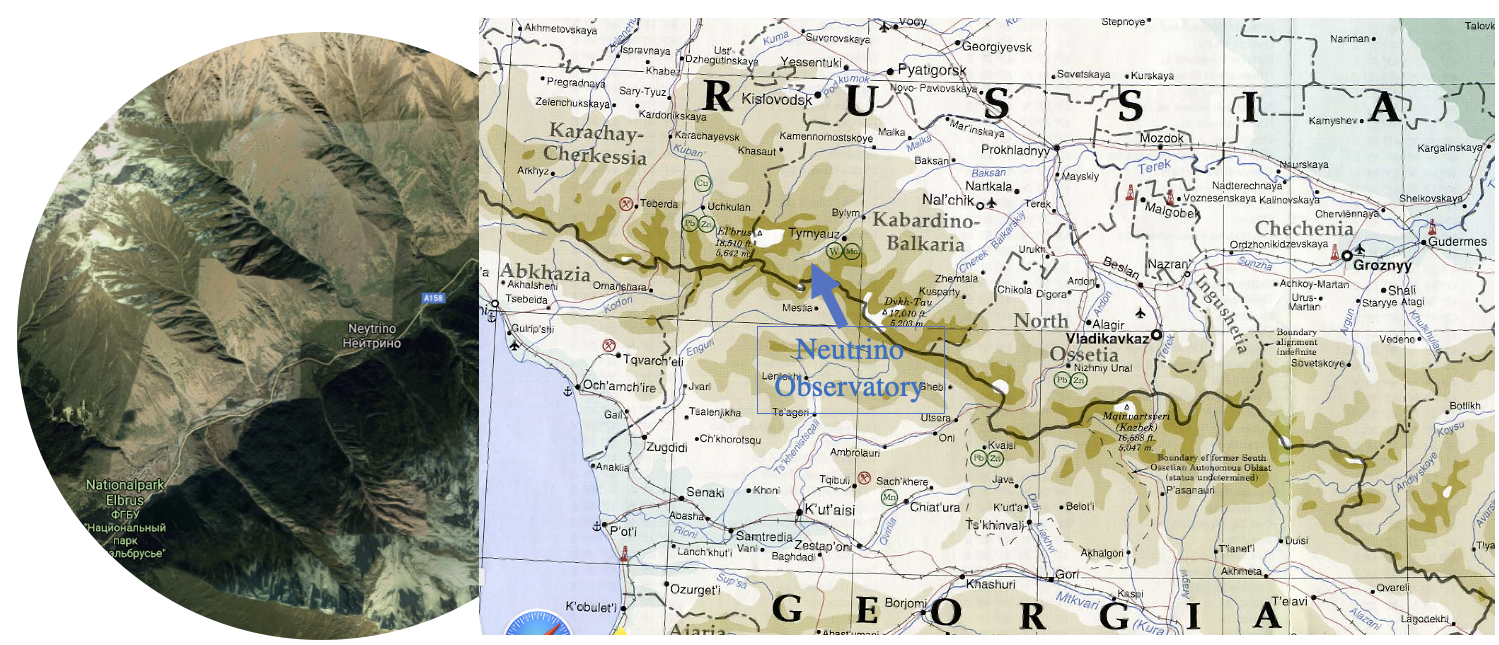
The Baksan Neutrino Observatory (BNO) is a scientific laboratory of the Institute for Nuclear Research of the Russian Academy of Sciences (INR RAS) located in the the Caucasus mountains of the Karbardino-Balkaria Republic in Russia. It started operations in 1977 [11], hosting mainly neutrino experiments already at the USSR epoch.
The laboratory itself was built in a 4 km long horizontal tunnel under the Mount Andyrchi, 4,000 m high. The entrance is at 1,700 m from sea level, in the gorges of the Baksan river.
BNO was conceived to carry on studies and experiments of both fundamental and applied physics. The Observatory includes surface installations for cosmic ray physics and underground laboratories for neutrino physics physics and physics of rare processes: it host also the Optoacoustic GRavitational ANtenna, OGRAN [12].
Geologically, the Caucasus Mountains belong to the Alpide belt system that extends from southeastern Europe into Asia; it is a border between the two continents and one of the world’s higher mountain chain. The Greater Caucasus Mountains are mainly composed of Cretaceous and Jurassic rocks with the Paleozoic and Precambrian rocks in the higher regions. The laboratory entrance is located in the gorge of the Baksan river, not far from the Mont Elbrus (5642 m), a dormant volcano. This is the largest Quaternary volcano in the European part of the Russia, situated within the central part of Greater Caucasus. North of the Greater Caucasus the deep sedimentary Terek and Kuban foreland basin (more than m thick; up to 1,600 m elevation) forms the transition to the Scythian platform. North-West of Mount Elbrus, the Stavropol “high” forms a basement uplift. In the North Caucasus and in particular in basin of Baksan river, the volcanic and plutonic rocks are interpreted as parts of a single magmatic system with an age of 2.8-3.0 Ma, similar to the magmatic system of the molybdenum-bearing Questa caldera complex of New Mexico. [10]
The surrounding rock geological minerals of the laboratory location are the plagiogneiss down to the depth 800 m, and plagio granites at more deep levels. The main rock of the massif is shale, which has a thorium and uranium radioactive concentration close to that of granite. A density of these rock species practically is equal in average to kg/m3. The chemical composition of the local rocks is reported in [13].
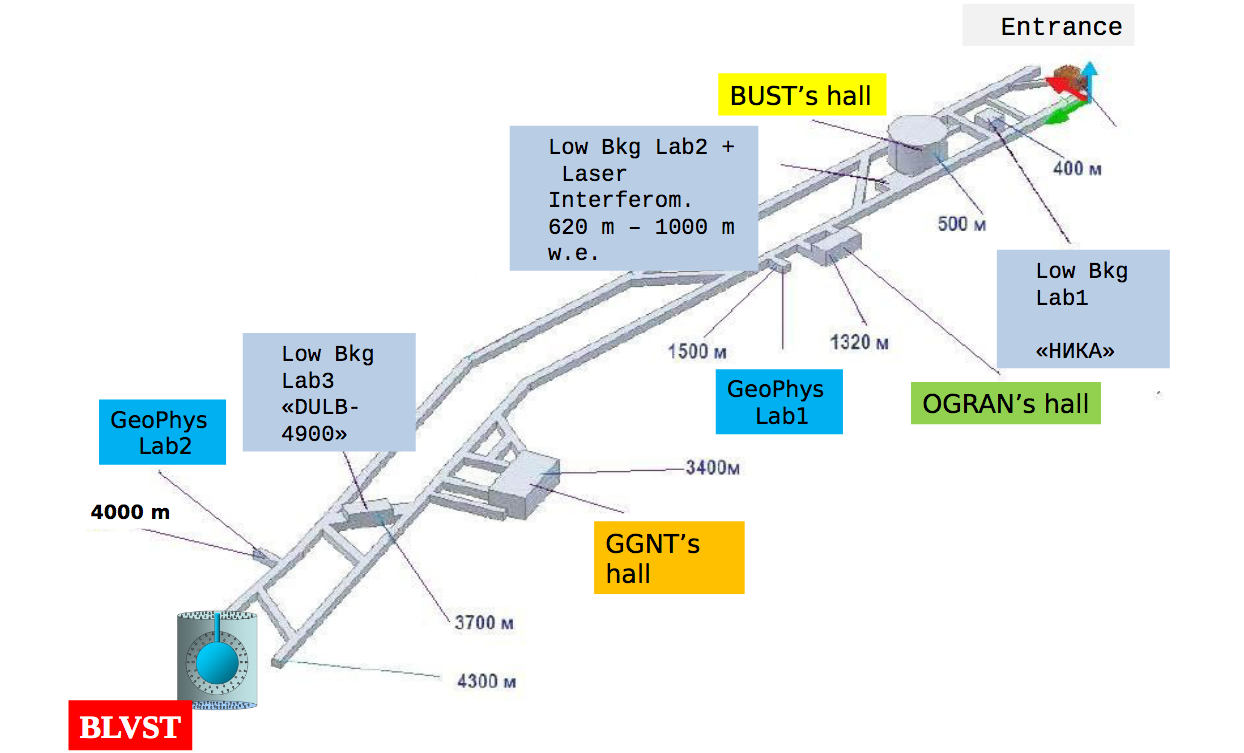
The underground laboratories, conceived to search for rare processes predicted in theories of elementary particle physics and cosmology, are distributed along the tunnel and they differ in their volume and depth. However, all laboratories have been designed to have the special feature of a reduced background caused by a surrounding radioactivity. The experimental areas can be divided into two groups: the first one is the group of moderately deep zone with the largest one reserved for scintillation telescope laboratory. The second one is the group of very deep experimental areas including the gallium-germanium solar neutrino laboratory. The OGRAN experiment is hosted in a dedicated room located almost at half the away of the horizontal tunnel[14].
3 The 2013 data taking
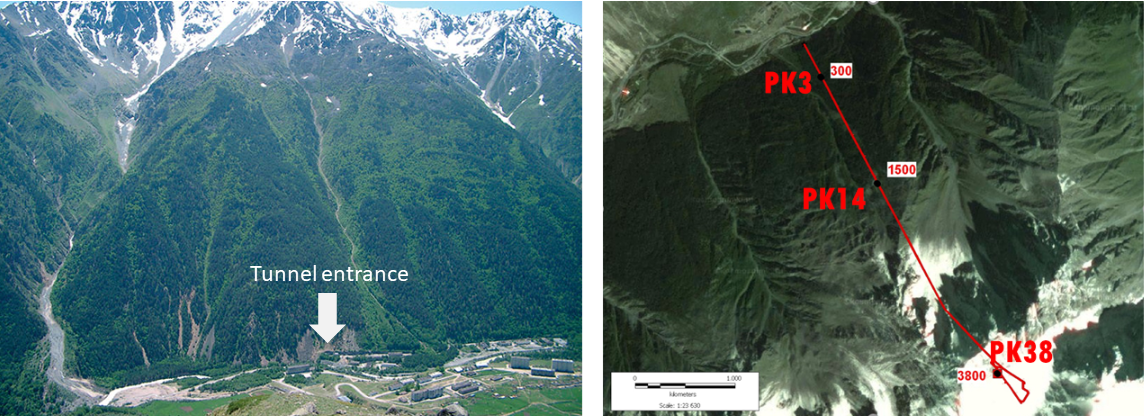
In 2013, the measurements were carried out by the SAI MSU group with the assistance of GSRAS (Geophysical Service of the Russian Academy of Sciences [15]), which has a stationary underground laboratory at m from the tunnel entrance of the BNO main tunnel, equipped with a full range of geophysical meters. Investigations of the seismic background along the main tunnel were carried out with a portable seismometer within the EU program F7 (ASPERA grant entitled ”Einstein’s Telescope” [1]). In 2013 measurements have been taken with a conventional seismometer Guralp CMG-3T/ESPC, an instrument consisting of three sensors, which can measure the north-south, east-west and vertical components of ground motion simultaneously. The seismometer is equipped with a built-in digitiser, and it operates in the frequency range Hz. The measurement campaign have been carried on by monitoring the seismic background noise in three different locations along the 4 km-long horizontal tunnel, named PK3, PK14, PK38.
PK3 is the station m far from the tunnel entrance and with a depth of m from the daily surface.
PK14 is at a distance of m from the entrance of the main tunnel: the instrumentation was in the vicinity of OGRAN, the detector hosted in a facility constructed using principles of solid-state and laser interferometer gravitational antennae. The tunnel depth from the surface in this point is m.
PK38 is the station at m from the tunnel entrance, at a depth of m; in this area in the past there was a geophysical complex with tilt indicators, magnetometers, gravimeters, thermometers as well as earthquake detection stations devoted to carry on a geophysical survey.
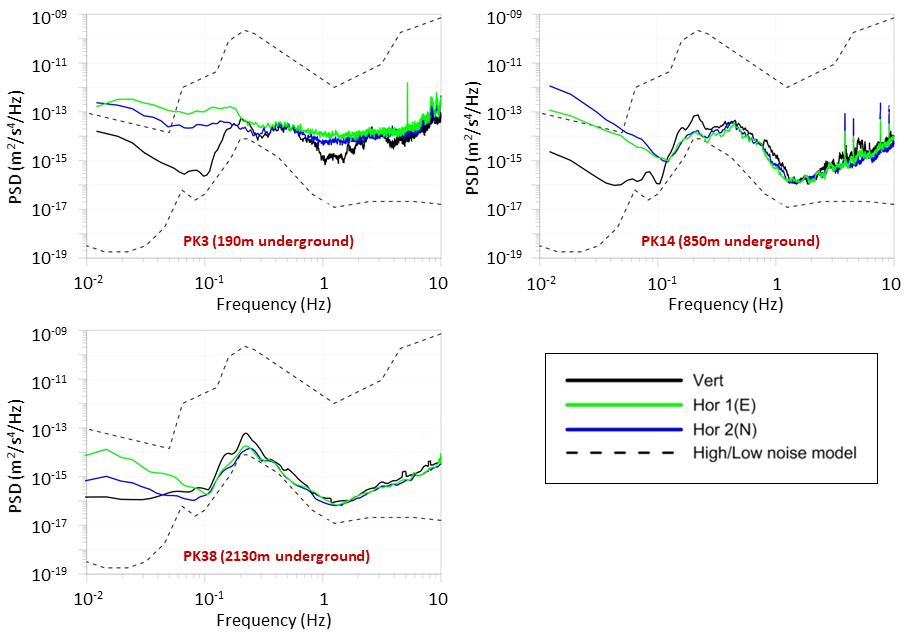
Results of measurements are presented in figure 4 as a spectral density of horizontal and vertical acceleration in the logarithmic scale. At the deepest mark m in the frequency range of Hz, the acceleration spectral density decreases from Hz to Hz.
4 The 2018 data taking
The second data taking was carried on during three days in 2018, from September to September , using two kind of seismometers:
-
•
a broadband triaxial Trillium 240 seismometer made by Nanometrics Inc [7] that some of the authors LN, MP and FR) used also to characterise other sites, which are candidates to host the Einstein Telescope 3G-GW detector;
-
•
SM3 seismometers developed by the Russian Academy of Sciences based on a pendulum with negative feedback[9]. One of them was initially installed close to the Trillium 240 in the PK14 station, then moved to the other stations.
The Trillium 240 seismometer was installed on the floor of the OGRAN laboratory, which is cemented to the bedrock of the tunnel, horizontally oriented towards the north direction and leveled. After the installation the sensor was left in position for about 24 hours to reach the thermal equilibrium with the local environmental temperature.
The Trillium 240 was connected to a DAQ Taurus [8] to record the acquired data. The frequency response of the three channels is nearly flat in the microseismic band, and it rolls off at 40db/decade at lower frequencies. The analog output of the sensor is filtered using a first order low pass anti-alias filter before being sampled at this frequency. This data is later low pass filtered and decimated, using a 3 to 4 stage FIR filter, to the output sample rate of 40 Hz.
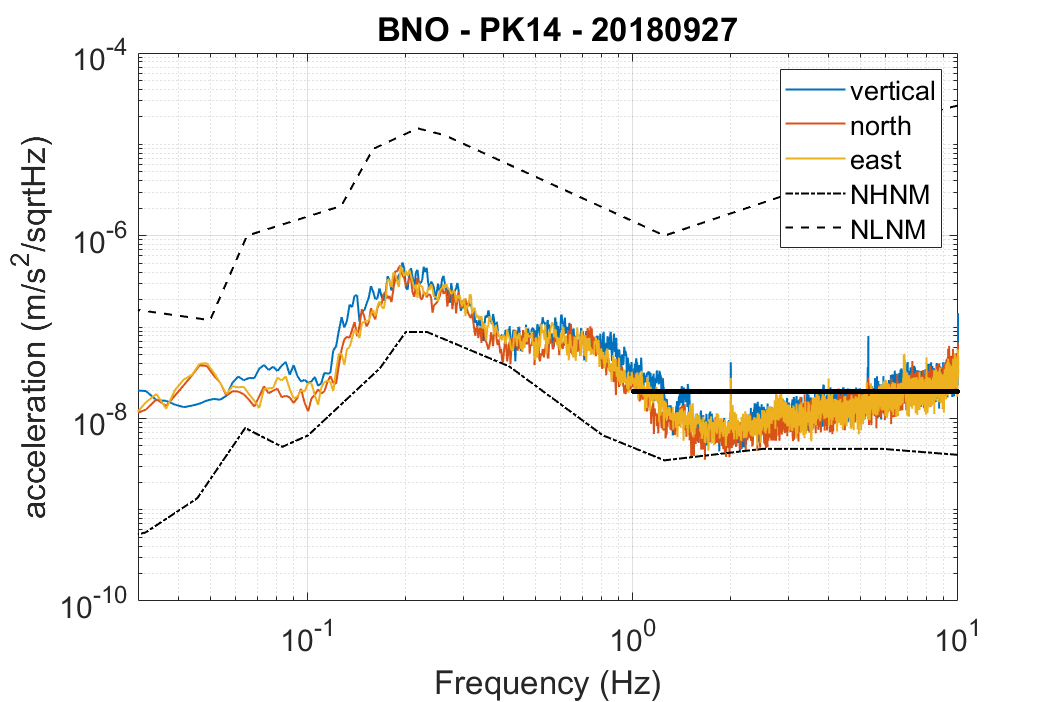
In figure 5 we show the acceleration spectrum along three axis measured during the night between the and the of September 2018: the most prominent feature is the secondary oceanic microseismic peak at Hz [4, 5], with a knee between Hz and Hz that is likely related to the waves in seas with a smaller characteristic wavelength than oceans [22], e.g. the Black and Caspian seas. Above Hz both the horizontals and vertical spectra are close to the minimum level given by the NLNM. From to Hz this spectrum is below the Einstein Telescope project seismic requirement[1]. Comparing the spectrum with the previous measurements made in 2013, and taking in mind the square factor between amplitude and power spectral densities, it is possible to note an excess seismic noise above 2 Hz in the previous measurements. This could be due to a transient noise in the BNO infrastructure and/or to the measurement setup adopted at that time.
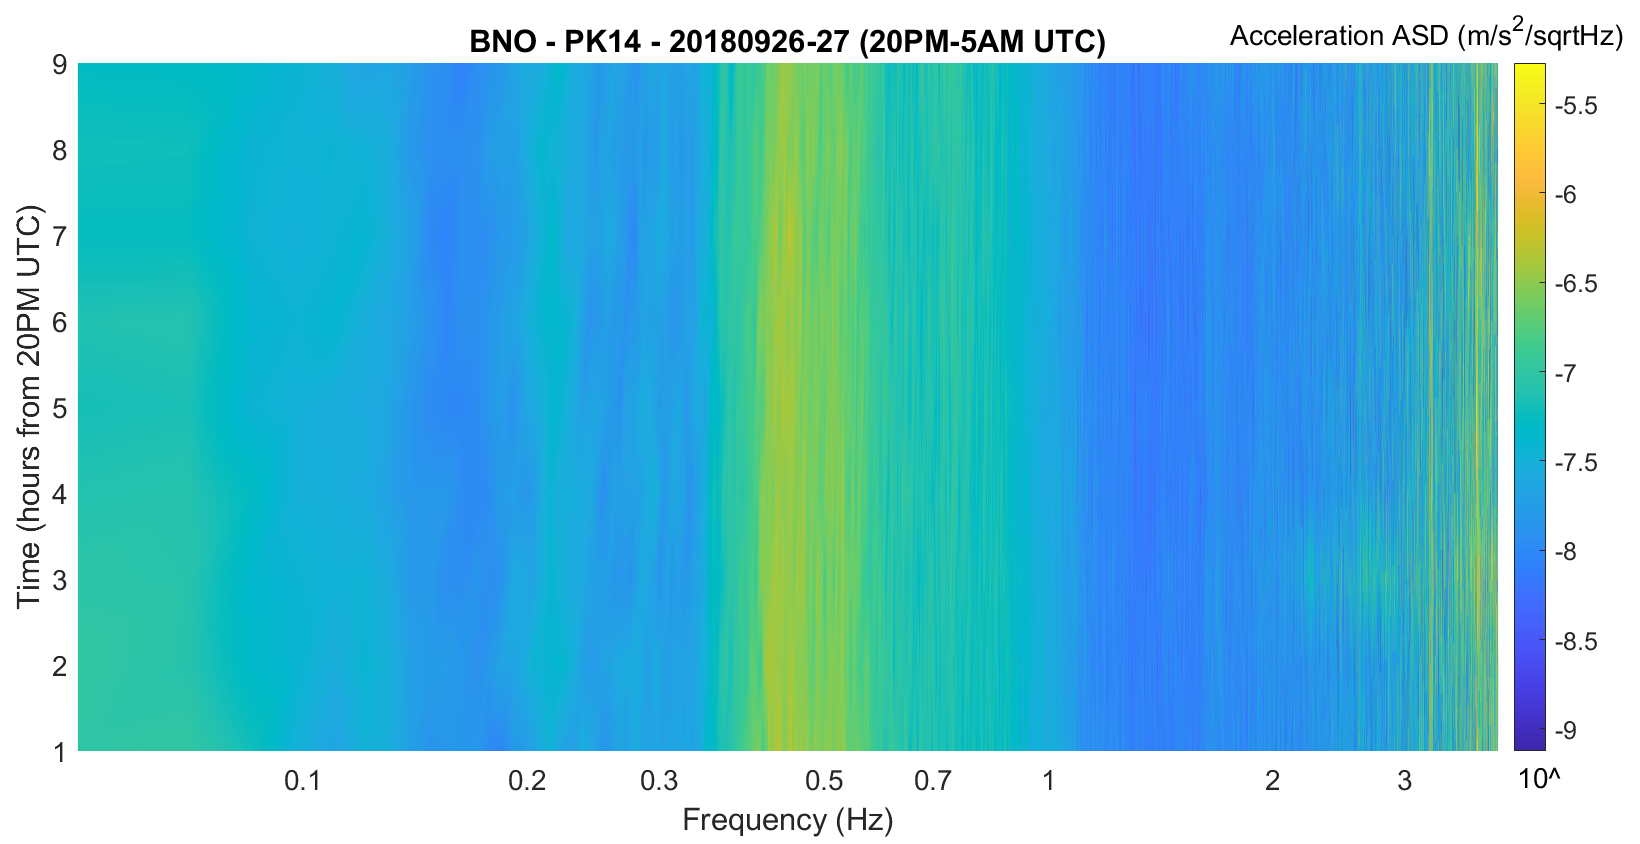
In figure 6 we report the spectrogram obtained from one hour-long averaged spectra measured between PM of the and AM of the of September. The spectrogram shows the stability of the microseismic peaks and the absence of notable transients during the measurement.
5 Microseismic coherence across the tunnel
Microseismic peaks are produced by the action of sea waves in the shallow waters of coastal regions and by ocean swell and standing waves in off-shore locations[4, 5, 6]. During the period of June 2013 we had dedicated data taking with the purpose to evidence of the existence of space coherence of the microseismic noise in the tunnel. This data taking was relatively short (few hours) and we focused the attention just on the vertical microseismic displacement. The noise spectrum of data sampled at 100 Hz, have been analysed up to maximum frequency of 10 Hz. We note that the noise was rather stationary during the short period of data taking, and no glitches or special event have been detected.
We assumed as base reference, the PK38 station (3800 m from the main entrance of the tunnel) and the synchronisation of the data streams collected in the other two stations were corrected to the respect of the reference station.
Then, we computed the the coherence in the frequency range from to 10 Hz both in the case of PK3-PK38 and of PK14-PK38. The two coherence plots in function of the frequency are shown in figure 7
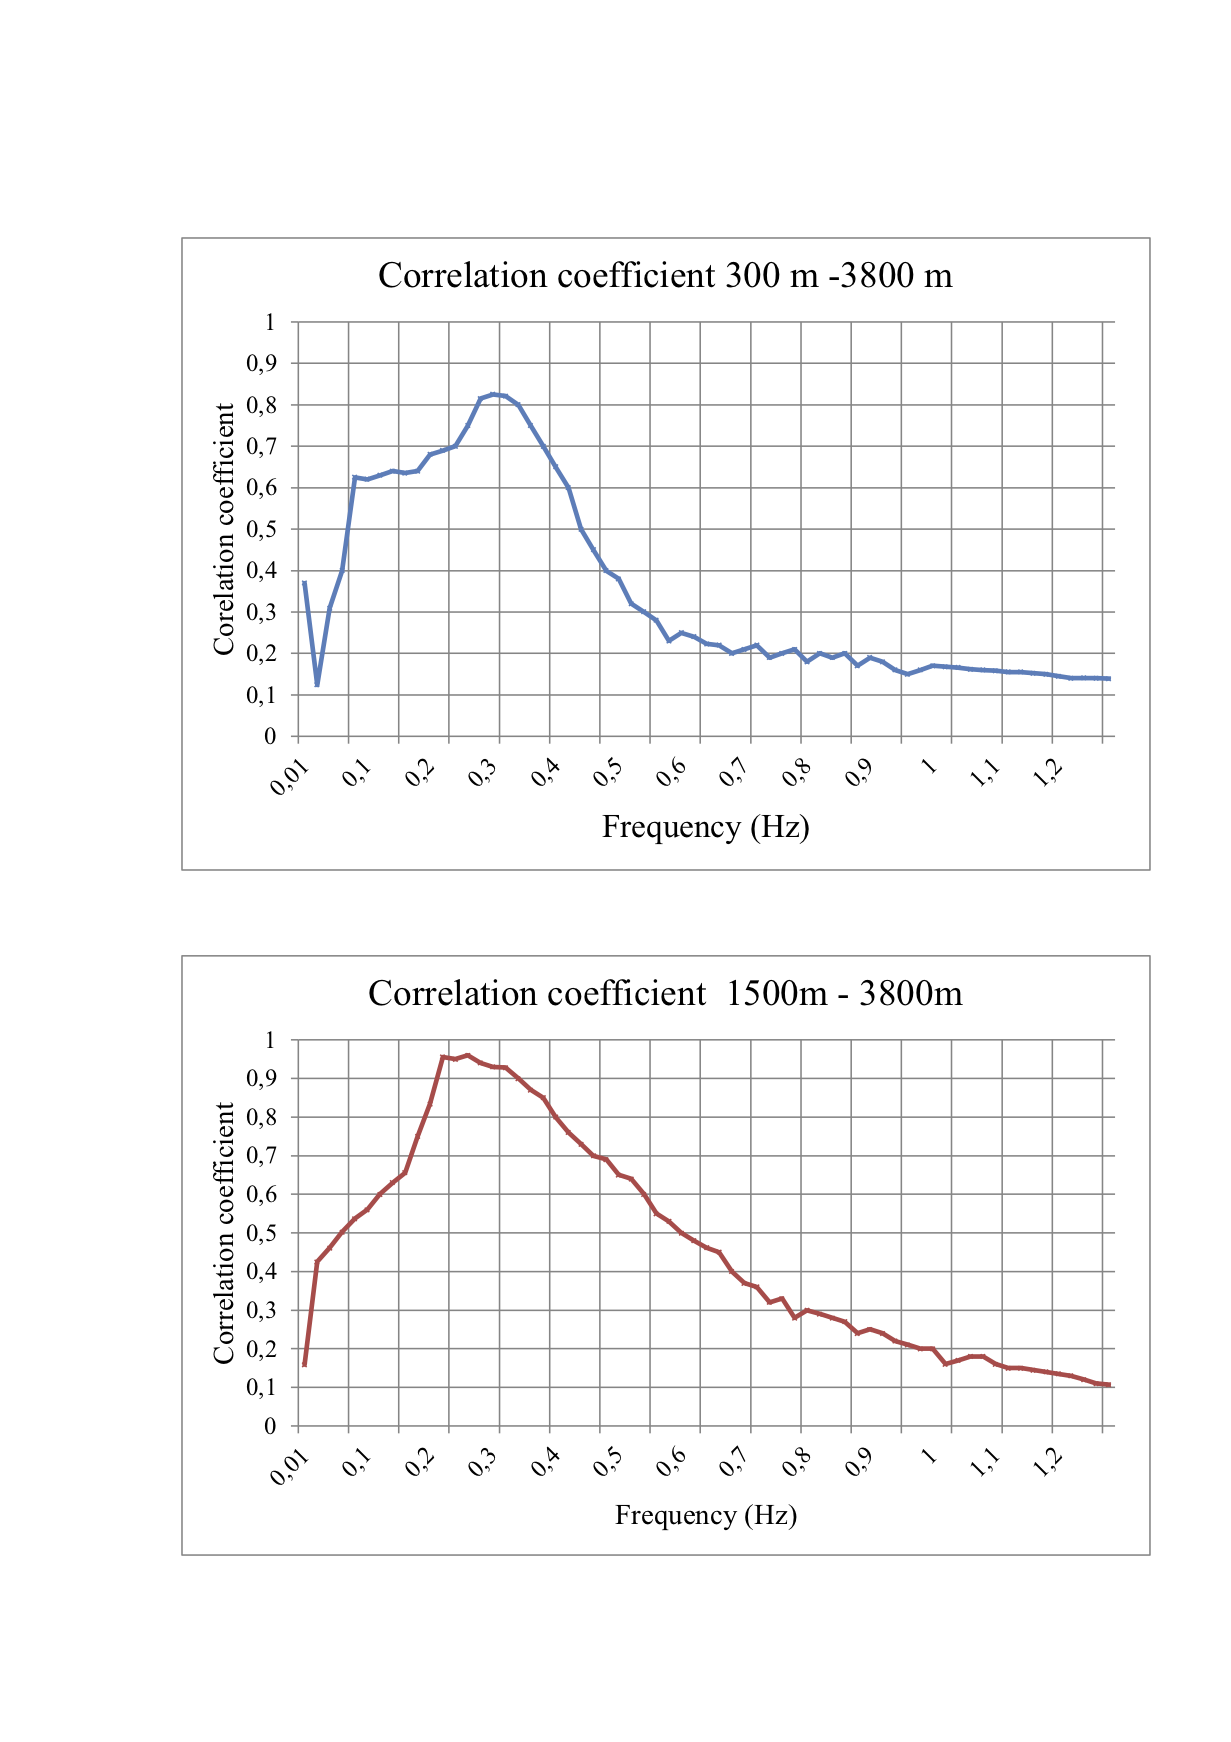
It is evident from the two plots that the coherence is significant in the frequency range Hz, the region dominated by the microseismic peak. In other frequency intervals the correlation is weak or absent.
Similar result has been obtained using data collected in 2018. We monitored still the vertical microseismic displacement using synchronised data of two SM3 sensors located at PK3 and Pk38 data.
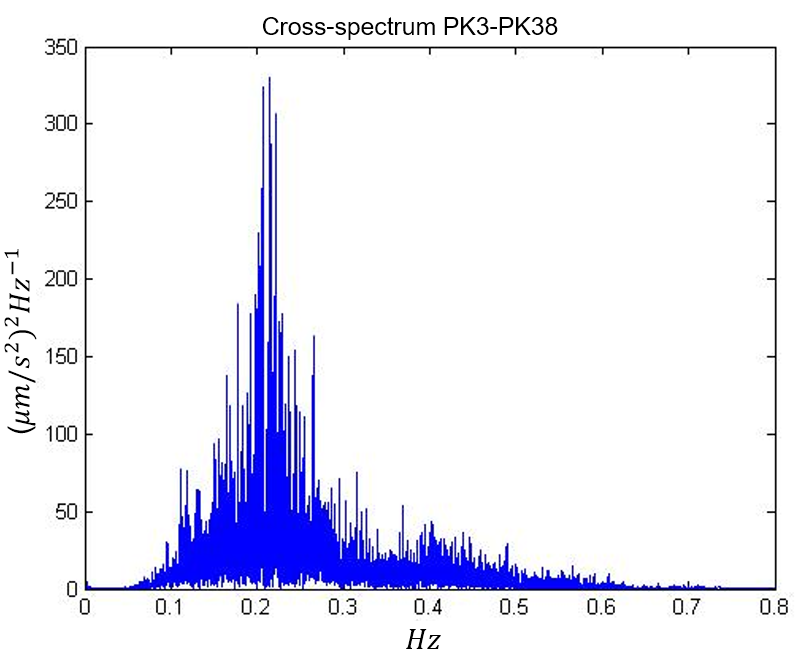
The measurement confirms the presence of a peak in the same frequency range for the cross correlation between the PK3 and PK38 stations.
6 Newtonian noise evaluation
In a deep underground laboratory as BNO, the contribution of surface Rayleigh waves to the Newtonian noise (NN) is expected to be negligible, while that of compressional body waves is still important [17, 18]. Under these assumptions, it is possible to calculate the NN projection produced by body waves, as discussed in [19] and [20]. In a first approximation, we can assume the detector caverns as spherical cavities with a radius smaller than the characteristic seismic wavelengths, and the detector test masses as placed at center of these cavities [19]. Moreover, we can assume that the NN contribution to the interferometer test masses is not coeherent [21], and an equal distribution of the displacement power among the three body wave polarizations [17]. With these assumptions, the NN projection of the seismic body waves background is expressed by:
| (1) |
where is the average density of the local rocks ( kg/m3), is the interferometer arms length ( km in ET) and is the seismic amplitude spectral density (ASD) measured at the site.
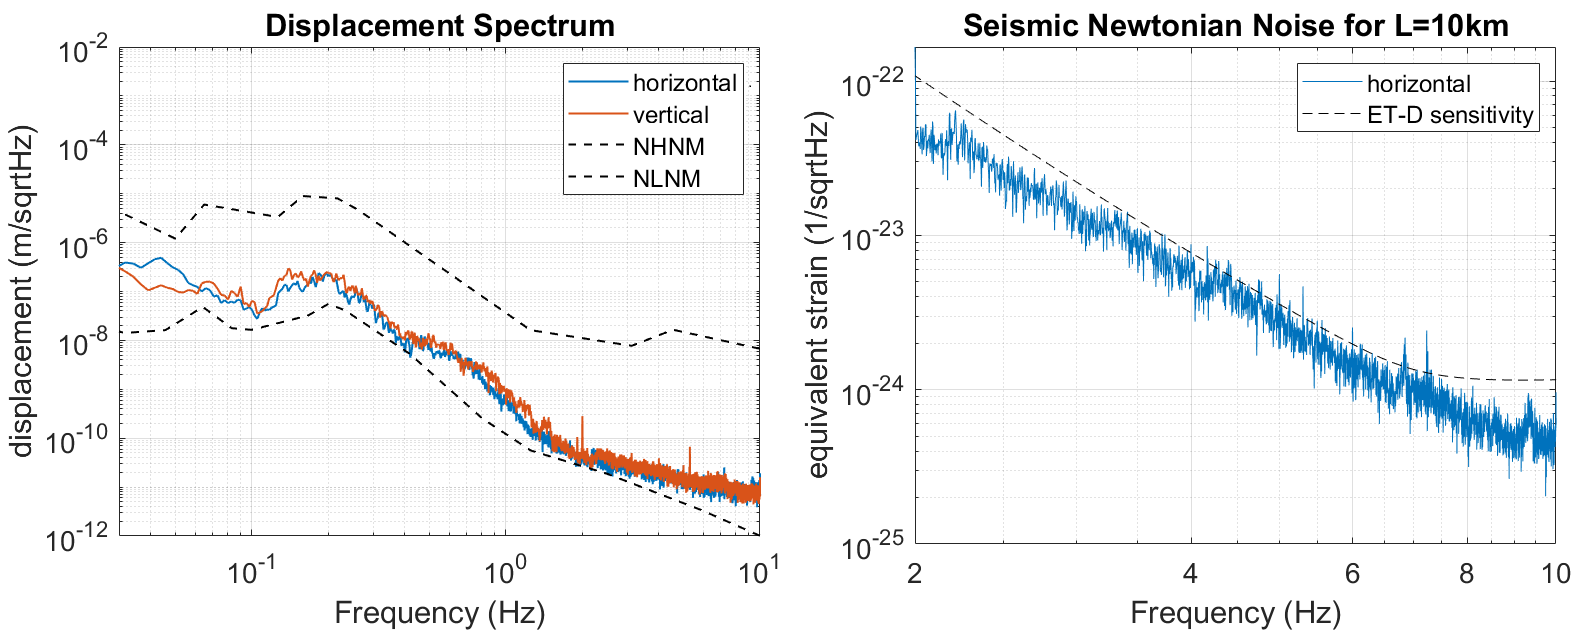
In figure 9 we show the displacement ASD measured in 2018 at PK14 and the Newtonian Noise projection obtained from this data using equation 1. It can be noticed that in the low frequency region for a 3G-GW (2-10Hz) the seismic noise background at BNO-PK14 (850m underground) is close to the Peterson’s New Low Noise Model. The expected seismic NN, based on this data, is below the ET[16] in almost all the Hz band.
7 Discussion and conclusion
We have presented the experimental results of our campaign on seismic measurements carried on in the Baksan Neutrino Observatory (BNO). The two series of measurements has been taken at a distance of years with different seismometers and show similar seismic PSDs. The spectra reported in figure 4 show clearly that the deeper location (PK34 station) is more quite above 1 Hz, a frequency range interesting for the site qualification of a 3G-GW detector. Down to Hz the spectrum is affected by the sea motion: it is well known that closed seas and big lakes cause a characteristic microseismic peak at higher frequencies than that related to the oceans, due to the shorter typical wavelength in smaller bodies of water. In the case of BNO we can see an additional peak at mHz that can be interpreted as produced by Caspian Sea and/or the Black Sea. Indeed, the correlation of microseism and sea waves is a known effect also observed in other locations[6], e.g. in the ET candidate site in Sardinia[22, 23], where a microseismic peak is well correlated with waves produced by the western sector of the Mediterranean sea[23]. No evidence of the dynamic effects due to magma movements of the near volcano have been detected at BNO.
In addition, we have computed the potential contribution of the expected Newtonian Noise using the seismic data acquired in 2018 at the PK14 station (about 850m underground): this NN projection is below the Einstein Telescope design sensitivity in almost all the band from 2 to 10 Hz.
Finally, we note that the cross spectrum of seismometers located in different positions along the tunnel shows the main peak at 0.21 Hz. The interpretation of this result is not straightforward: the correlation on the microseismic spectrum in the range Hz can be simple due to the secondary (dominant) microseismic peak produced by standing waves in the oceans, usually at Hz, or it may also show a resonance effect of the sound propagation in the tunnel. Future measurements with infra-sound microphones could permit to asses the correct interpretation of this result.
Acknowledgments
We thank the Direction of Baksan Neutrino Observatory for their kind hospitality during the data taking. Russian participants were supported by the national grant RFBR 19-29-11010. The support of Sapienza Grande Progetto di Ateneo 2017, Amaldi ResearchCenter (MIUR program ”Dipartimento di Eccellenza” CUP:B81I18001170001) and of Istituto Nazionale di Fisica Nucleare is gratefully acknowledged.
Data Availability Statement. This manuscript has associated data in a data repository. [Authors’ comment:
The 2018 measurement campaign data is stored in repository and is available upon request. Please contact the corresponding author.]
References
References
- [1] Einstein Telescope (ET) science team (2011), Einstein Gravitational Wave Telescope Conceptual Design Study, ET-0106C-10, available at http://et-gw.eu/etdsdocument
- [2] Cosmic Explorer project website, https://cosmicexplorer.org/
- [3] J. Peterson, Observation and modeling of seismic background noise, U.S. Geol. Surv. Open-File Rept. 2 (1993) 93-322
- [4] M.S. Longuet-Higgins, A theory of the origin of microseisms Philos. Trans. R. Soc. London 243 (1950) 1-35
- [5] R. K. Cessaro R.K., Sources of Primary and Secondary microseisms Bull. Seismol. Soc. Am. 84 (1994) 142-148
- [6] Cannata et al.: Unravelling the Relationship Between Microseisms and Spatial Distribution of Sea Wave Height by Statistical and Machine Learning Approaches Remote Sens. 12 761 (2020)
- [7] Trillium 240 Seismometer User Guide by Nanometrics Inc. (2005)
- [8] Taurus Portable Seismograph User Guide by Nanometrics Inc. (2004-2007)
- [9] L.R. Jaroszewicz, A. Kurzych, Z. Krajewski, P.Marc, J. K. Kowalski, P. Bobra, Z.Zembaty, B.Sakowicz, R.Jankowski, Review of the Usefulness of Various Rotational Seismometers with Laboratory Results of Fibre-Optic Ones Tested for Engineering Applications, Sensors 16 (2016), 2161
- [10] O. A. Bogatikov, A. G. Gurbanov, V. I. Kovalenko, N. V. Koronovskiy, P. Lipman, A. A. Tsvetkov The Upper Chegem Caldera Complex in the North Caucasus, International Geology Review, 34 (1992) 131-147
- [11] V.V. Kuzminov, The Baksan Neutrino Observatory Eur. Phys. J. Plus 127,(2012) 113 https://doi.org/10.1140/epjp/i2012-12113-0A.A.
- [12] V.N. Rudenko, Yu. M. Gavrilyuk, A.V. Gusev, D.P. Krichevskiy , S.I. Oreshkin, S.M. Popov, I. S. Yudin, Gravitational wave detector OGRAN as multi-messenger project of RAS-MSU. International Journal of Modern Physics A 35 (2020) 2040007 DOI: 10.1142/S0217751X20400072
- [13] A.A. Pomansky, Underground Low Background Laboratories of the Baksan Neutrino Observatory Nuclear Instruments and Methods in Physics Research 817 (1986) 406-410
- [14] V.N. Rudenko, N.L. Kvashninc , A.A. Lugovoi , S I. Oreshkin, S M. Popov, A.A. Samoylenko , M N. Skvortsov, I S. Yudin, Modernization and Methods of Maintaining the Operating Mode of the OGRAN (Optoacoustic Gravity Antenna) Setup. Physics of Atomic Nuclei, 83 (2020) 1682-1690
- [15] S.A. Fedotov, Geophysical Service of the Russian Academy of Science Journal of Volcanology and Seismology 2 (2009) 446-448. doi:10.1134/S0742046308060067
- [16] Einstein Telescope project web site, sensitivity page, http://www.et-gw.eu/index.php/etsensitivities
- [17] F. Amann et al. (2020), Site-selection criteria for the Einstein Telescope, Rev. Sci. Instrum. 91: 9
- [18] F. Badaracco, J. Harms (2019), Optimization of seismometer arrays for the cancellation of Newtonian noise from seismic body waves. Class. Quantum Grav. 36, 145006 (2019)
- [19] J. Harms,Terrestrial gravity fluctuations Living Reviews in Relativity 22, 6 (2019)
- [20] A. Allocca et al. (2021), Seismic glitchness at Sos Enattos site: impact on intermediate black hole binaries detection efficiency Eur. Phys. J. Plus 136:511
- [21] S. Hild et al., Sensitivity studies for third-generation gravitational wave observatories. Class. Quantum Grav. 28, 094013 (2011)
- [22] L. Naticchioni et al., Microseismic studies of an underground site for a new interferometric gravitational wave detector Class. Quantum Grav. 31, 105016 (2014)
- [23] M. Di Giovanni et al., A Seismological Study of the Sos Enattos Area - the Sardinia Candidate Site for the Einstein Telescope Seismological Research Letters 92 (1): 352 - 364 (2021).