Suppression of antiferromagnetic order and strong ferromagnetic spin fluctuations in Ca(Co1-xNix)2-yAs2 single crystals
Abstract
CaCo2-yAs2 is a unique itinerant system having strong magnetic frustration. Here we report the effect of electron doping on the physical properties resulting from Ni substitutions for Co. The single crystals of Ca(Co1-xNix)2-yAs2 were characterized by single-crystal x-ray diffraction, energy-dispersive x-ray spectroscopy, magnetization versus temperature , magnetic field , and time , and heat capacity measurements. The A-type antiferromagnetic (AFM) transition temperature K for decreases to 22 K with only 3% Ni substitution and is completely suppressed for . For strong ferromagnetic (FM) fluctuations develop as revealed by magnetic susceptibility measurements. For and 0.16, competing AFM and FM interactions result in spin-glass behavior at low as evidenced by observations of thermomagnetic hysteresis and magnetic relaxation. Enhanced FM fluctuations are also found for the and 0.31 crystals, where increases significantly at low . A large anisotropy in these compositions where is up to a factor of two larger than suggests that the FM spin fluctuations are quasi-1D in nature. Weak FM contributions to were found at K for –0.31. Heat-capacity measurements revealed the presence of FM quantum spin fluctuations for , where a logarithmic dependence of is observed at low . The suppression of AFM order by the development of strong FM fluctuations in Ca(Co1-xNix)2-yAs2 crystals suggests the presence of a FM quantum-critical point at . Our density-functional theory (DFT) calculations confirm that FM fluctuations are enhanced by Ni substitutions for Co in CaCo2-yAs2. The Sommerfeld electronic heat-capacity coefficient is enhanced for , 0.21, and 0.42 by about a factor of two compared to DFT calculations of the bare density of states (DOS) at the Fermi energy, suggesting an enhancement of the DOS from electron-phonon and/or electron-electron interactions. The crystals with do not exhibit FM spin fluctuations or magnetic order at K, which was found from the DFT calculations to result from a Stoner transition. Superconductivity is not observed above 1.8 K for any of the compositions. Neutron-diffraction studies of crystals with and 0.16 in the crossover regime found no evidence of A-type ordering above 4.8 K within experimental resolution as observed in the parent compound with . Furthermore, no other common magnetic structures, such as FM, helical stacking of in-plane FM layers, or in-plane AFM structure, were found above 4.8 K with an ordered moment greater than the uncertainty of 0.05 per transition-metal atom.
I Introduction
The discovery of superconductivity in doped iron arsenides by suppressing the long-range antiferromagnetic (AFM) order of parent compounds has opened up a wide research field studying the complex interplay between superconductivity (SC) and magnetism [1, 2, 3, 4, 5]. A considerable number of studies have been carried out to understand the mechanism of the observed high- superconductivity in doped -structure (122-type) Fe2As2 ( = Ca, Sr, Ba, Eu) compounds [6, 7, 8, 9, 10, 11]. It has been established that AFM fluctuations mediate the electron-pairing mechanism for SC in the iron-arsenide family of compounds [6, 11, 12]. Depending on the ratio of tetragonal lattice parameters , a collapsed-tetragonal (cT) or uncollapsed-tetragonal (ucT) version of the structure is formed (for a review, see Ref. [13]).
In contrast to 122-type iron-arsenide compounds, none of the parent cobalt arsenides exhibit superconductivity even with doping but are still found to be rich in physics associated with itinerant magnetism of the conduction electrons [14, 15, 16, 17, 18, 19, 20, 21, 22, 23, 24]. Interesting physical properties are observed including non-Fermi-liquid behavior associated with a quantum critical point, spin-glass behavior, and helical magnetic ordering in electron- or hole-doped 122-type CoAs-materials [25, 26, 27, 28, 29, 30, 31, 32]. For example, metallic is a Stoner-enhanced paramagnet and does not exhibit any magnetic ordering down to a temperature of 0.05 K; however, stripe-type AFM fluctuations were revealed via inelastic neutron-scattering (INS) measurements [16, 17, 18]. Although the wave vector associated with the stripe AFM fluctuations in is the same as that observed in the high- Fe2As2 parent compounds, the CoAs analogues do not exhibit SC, perhaps due to the simultaneous presence of strong ferromagnetic (FM) spin fluctuations [33]; however, the INS measurements in Ref. [17] indicate that dominant FM fluctuations present at high cross over to AFM fluctuations at low . Electron doping of via Ni substitution for Co results in helical AFM order with only a 1.3% Ni substitution for Co [27, 28]. A composition-induced non-Fermi-liquid behavior associated with a magnetic quantum-critical point is also evidenced in Sr(Co1-xNix)2As2 crystals near [27]. No magnetic ordering down to K is found in metallic which, however, is in proximity to a FM quantum-critical point associated with a flat electron band near the Fermi energy [21, 22, 23].
CaCo2-yAs2 is a unique member of the 122-type CoAs family with strong magnetic frustration and itinerant magnetism [34]. In contrast to and with ucT structures, CaCo2-yAs2 has a cT structure with a substantial concentration of vacancies on the Co site [14, 15]. The compound undergoes A-type AFM ordering below K, where the in-plane Co moments are aligned ferromagnetically along the axis, while adjacent layers of Co moments are stacked antiferromagnetically. From magnetic susceptibility versus temperature measurements, the dominant interactions are FM. INS measurements further reveal the presence of quasi one-dimensional FM spin fluctuations in the FM square Co planes associated with a flat band near , as also suggested by band-structure calculations [34, 35].
Due to the presence of the strong magnetic frustration in CaCo2-yAs2, it is expected that the ground state of the compound can be changed by tuning via chemical substitution. Hole doping has been accomplished by substituting Fe for Co in Ca(Co1-xFex)2-yAs2 single crystals [26]. The and neutron-diffraction measurements on Ca(Co1-xFex)2-yAs2 single crystals demonstrated that the Fe substitution suppresses the A-type AFM ordering with a reduction in the ordered moment, with long-range magnetic ordering disappearing by . INS measurements on an single crystal further show that although the same level of magnetic frustration is present in and , the spin fluctuations are strongly reduced for [36]. Thus, hole doping eventually quenches the magnetic moments via a Stoner transition [36].
In this paper, we report the growth of Ca(Co1-xNix)2-yAs2 single crystals and studies of their crystallographic, magnetic, and thermal properties. These materials are electron-doped instead of hole-doped as in Ca(Co1-xFex)2-yAs2. The and at fixed versus time measurements indicate that the A-type AFM ordering for is suppressed to 10.5 K for and does not occur above 1.8 K for , and that spin-glass ordering occurs below 5 K for these two compositions. Neutron-diffraction measurements of these two compositions show no evidence for long-range magnetic ordering above 4.6 K within experimental resolution. The out-of-plane magnetic susceptibility is strongly enhanced for , indicating the presence of strong FM -axis fluctuations which in turn suggests the presence of a nearby FM quantum-critical point (QCP). We also report density-functional theory (DFT) calculations of the competition between different magnetic structures and fluctuations. The large anisotropy between and in the composition region suggests quasi-one-dimensional FM spin fluctuations along the axis. The signature of critical FM spin fluctuations is also evident in the heat capacity for compositions , where versus exhibits a low- upturn having a dependence that is suppressed in magnetic fields applied along the axis. From the DFT calculations, we infer the occurrence of a Stoner transition to a nonmagnetic metal at . For , metallic single-crystal is reported to be paramagnetic down to K with a small and nearly -independent paramagnetic [37].
The experimental details are given in Sec. II. The crystallography results are presented in Sec. III, the magnetization versus applied magnetic field isotherms and the data in Sec. IV, and the data in Sec. V. The neutron-diffraction measurements are presented in Sec. VI and the DFT calculations in Sec. VII. A summary of our results including an - phase diagram constructed from the and isotherm measurements is given in Sec. VIII.
II Experimental and theoretical details
Single crystals of Ca(Co1-xNix)2-yAs2 with compositions = 0, 0.03, 0.05, 0.11, 0.16, 0.21, 0.31, 0.42, 0.52, 0.67, 0.81 and 1 were grown using a self-flux solution-growth technique. The high-purity starting materials Ca (99.999%), Co (99.998%), Ni (99.999%), and As (99.9999%) from Alfa Aesar were placed in an alumina crucible with the molar ratio Ca:Co:Ni:As = 1.2:)::4. The 20% extra Ca is found to produce larger crystals. The loaded crucible was then put into a silica tube and quartz wool was placed above the crucible to extract the molten flux during centrifugation. The silica tube was then sealed under atm of Ar gas. The assembly was heated to 650 ∘C at a rate of 50 ∘C/h and held there for 6 h to avoid excess pressure created by As vapor. Then the ampule was heated to 1300 ∘C at 60 ∘C/h and held at that temperature for 20 h for homogenization. Finally, the tube was cooled to 1180 ∘C at a rate of 6 ∘C/h and the single crystals were separated from the excess flux using a centrifuge. Shiny platelike single crystals of different sizes were obtained from the growths with the axis perpendicular to the plate surfaces with typical dimensions mm3. The crystal size was found to increase with increasing Ni concentration.
A scanning-electron microscope from JEOL equipped with an energy-dispersive x-ray spectroscopy (EDS) attachment was used to check the phase homogeneity and average compositions of the crystals. The EDS scans were taken at multiple points on both sides of the crystals as well as on cleaved crystals to confirm the homogeneity and the absence of any secondary phases.
Single-crystal x-ray diffraction (XRD) measurements were performed at room temperature on a Bruker D8 Venture diffractometer operating at 50 kV and 1 mA equipped with a Photon 100 CMOS detector, a flat graphite monochromator and a Mo K IS microfocus source ( Å). The raw frame data were collected using the Bruker APEX3 software package [38], while the frames were integrated with the Bruker SAINT program [39] using a narrow-frame algorithm for integration of the data and were corrected for absorption effects using the multiscan method (SADABS) [40]. The atomic thermal factors were refined anisotropically. Initial models of the crystal structures were first obtained with the program SHELXT-2014 [41] and refined using the program SHELXL-2014 [42] within the APEX3 software package.
The temperature - and magnetic field -dependent magnetic measurements were carried out using a Quantum Design, Inc., magnetic-properties measurement system (MPMS) SQUID magnetometer in the range to 300 K with up to 5.5 T (1 T Oe). The heat capacity measurements were performed using the relaxation technique in a Quantum Design, Inc., Physical-Properties Measurement System (PPMS) in the ranges –300 K and –9 T.
Single-crystal neutron-diffraction experiments were performed in using the TRIAX triple-axis spectrometer at the University of Missouri Research Reactor (MURR). An incident neutron beam of energy meV (wavelength Å) was directed at the sample using a pyrolytic graphite (PG) monochromator. The component present in the beam was removed using PG filters placed before the monochromator and between the sample and analyzer. Beam divergence was limited using collimators before the monochromator; between the monochromator and sample; sample and analyzer; and analyzer and detector of , respectively. Crystals of mass 20 mg were mounted on the cold tip of an Advanced Research Systems closed-cycle refrigerator with a base temperature in the 4.1 to 4.8 K range. The crystals were aligned in the and plane. Extended diffraction patterns along principal directions confirm the tetragonal symmetry with lattice constants and Å at 4.8 K for the crystal and and Å for the crystal.
DFT calculations were performed using a full-potential linear-augmented-plane-wave (FP-LAPW) method, as implemented in wien2k [43]. We used the virtual-crystal approximation (VCA) to simulate the doping effects. The generalized-gradient approximation (GGA) of Perdew, Burke, and Ernzerhof [44] was used for the correlation and exchange potentials. To generate the self-consistent potential and charge, we employed with Muffin-tin (MT) radii , 2.4, and 2.5 a.u. for Ca, Co, and As, respectively. The calculations were performed with 264 -points in the irreducible Brillouin zone (BZ). They were iterated until the charge differences between consecutive iterations was smaller than and the total energy difference less than 0.01 mRy.
We also calculated the magnetocrystalline anisotropy energy (MAE), which originates from the spin-orbit coupling (SOC) [45]. The MAE is calculated as , where and are the total energies for the magnetization oriented along the [001] and [100] directions, respectively. Positive (negative) corresponds to easy--axis (easy--plane) anisotropy. The SOC is included using the second-variation procedure [46].
The composition-dependent experimental lattice parameters listed in Table 1 in the following section were adopted in the calculations.
III Crystallography
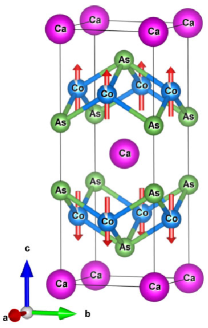
The body-centered-tetragonal crystal structure of CaCo2-yAs2 is shown in Fig. 1 [47]. The room-temperature crystallographic data for Ca(Co1-xNix)2-yAs2 crystals obtained from single-crystal XRD measurements are listed in Table 1. The listed compositions are the average compositions of the crystals from EDS measurements. The single-crystal XRD refinement does not allow simultaneous refinement of the total occupation of the transition metal site and the fraction of Co/Ni at that site. Thus, only the total occupancies were refined based on the Co/Ni ratio taken from the EDS data. All the compositions including the parents CaCo2-yAs2 and crystallize in the cT -type structure.
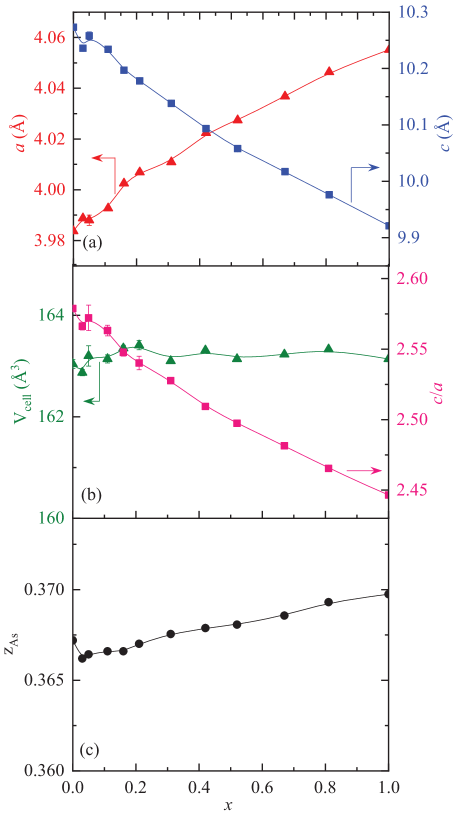
The tetragonal lattice parameters and , unit-cell volume , ratio, and the -axis As position parameter are plotted as a function of the Ni concentration in Fig. 2. The lattice parameter increases and the lattice parameter decreases nonlinearly with . As a result the unit-cell volume is almost constant throughout the composition range. Although all compositions form in the cT structure, the decrease in the ratio with increasing may result in a significant change in the interplanar magnetic coupling between the Co spins. The parameter initially decreases from to , but then increases with further increases in Ni concentration. The EDS scans taken at points on both sides of each crystal confirm the homogenous nature of the crystals. The average compositions estimated by EDS indicate that the vacancy concentration on the transition-metal site decreases with increasing Ni substitution and that the stoichiometric composition is obtained within the error bar for .
| Compound | (Å) | (Å) | (Å3) | ||
|---|---|---|---|---|---|
| CaCo1.86(2)As2 | 3.9837(4) | 10.2733(4) | 2.5788(6) | 163.04(9) | 0.3672(4) |
| Ca(Co0.970(3)Ni0.030(3))1.87(4)As2 | 3.9888(6) | 10.236(2) | 2.5661(2) | 162.87(6) | 0.36620(5) |
| Ca(Co0.95(1)Ni0.05(1))1.86(4)As2 | 3.988(2) | 10.258(7) | 2.5722(4) | 163.2(2) | 0.36643(8) |
| Ca(Co0.89(1)Ni0.11(1))1.87(4)As2 | 3.9927(8) | 10.234(3) | 2.5631(3) | 163.14(8) | 0.3666(1) |
| Ca(Co0.84(1)Ni0.16(1))1.89(6)As2 | 4.0025(6) | 10.197(2) | 2.5476(1) | 163.35(6) | 0.3666(1) |
| Ca(Co0.79(1)Ni0.21(1))1.86(3)As2 | 4.0069(8) | 10.178(4) | 2.5401(6) | 163.41(9) | 0.36701(9) |
| Ca(Co0.69(1)Ni0.31(1))1.87(3)As2 | 4.0109(1) | 10.1382(5) | 2.5276(1) | 163.10(1) | 0.36755(8) |
| Ca(Co0.58(1)Ni0.42(1))1.87(3)As2 | 4.0224(3) | 10.0935(1) | 2.5093(2) | 163.31(3) | 0.36788(5) |
| Ca(Co0.48(1)Ni0.52(1))1.87(4)As2 | 4.0274(3) | 10.058(1) | 2.4973(5) | 163.14(3) | 0.36807(4) |
| Ca(Co0.33(1)Ni0.67(1))1.89(4)As2 | 4.0368(3) | 10.017(1) | 2.4814(4) | 163.23(3) | 0.36857(6) |
| Ca(Co0.19(1)Ni0.81(1))1.94(3)As2 | 4.0464(2) | 9.976(1) | 2.4654(3) | 163.33(2) | 0.36931(7) |
| CaNi1.97(4)As2 | 4.0552(2) | 9.921(1) | 2.4464(4) | 163.14(2) | 0.36975(4) |
IV Magnetic measurements
IV.1 Magnetic susceptibility
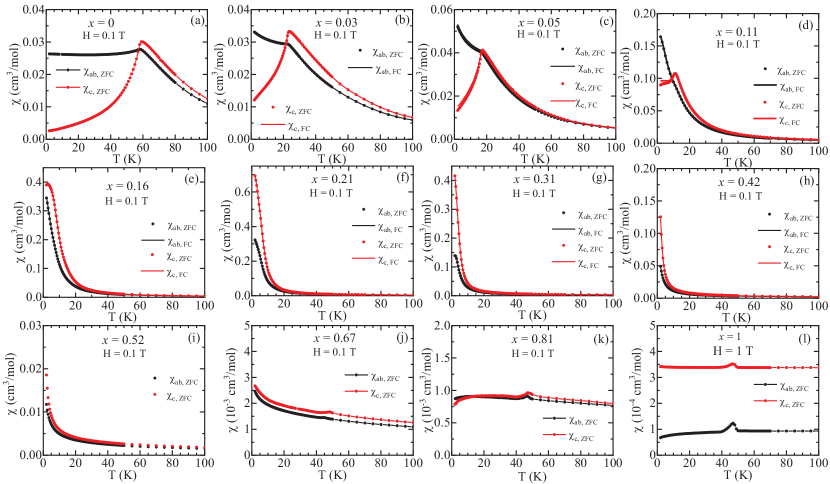
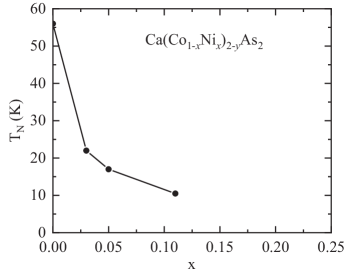
The -dependent magnetic susceptibilities for Ca(Co1-xNix)2-yAs2 crystals with = 0, 0.03, 0.05, 0.11, 0.16, 0.21, 0.31, 0.42, 0.52, 0.67, 0.81, and 1 are shown in Figs. 3(a)–3(l), respectively, for and under both zero-field-cooled (ZFC) and field-cooled (FC) conditions as noted in the respective panels. The parent compound CaCo2-yAs2 shows A-type AFM order with the ordered moments aligned along the axis below the Néel temperature K [15]. The -axis susceptibility approaches zero for and the in-plane susceptibility is almost independent of below , consistent with collinear AFM order along the axis according to molecular-field theory [48]. The is determined from the data using the Fisher criterion [49] where here the temperature of the peak in corresponds to . The drops from 52 K for to 22 K with only 3% Ni doping and then decreases further (see Table 3 below) as shown in Fig. 4.
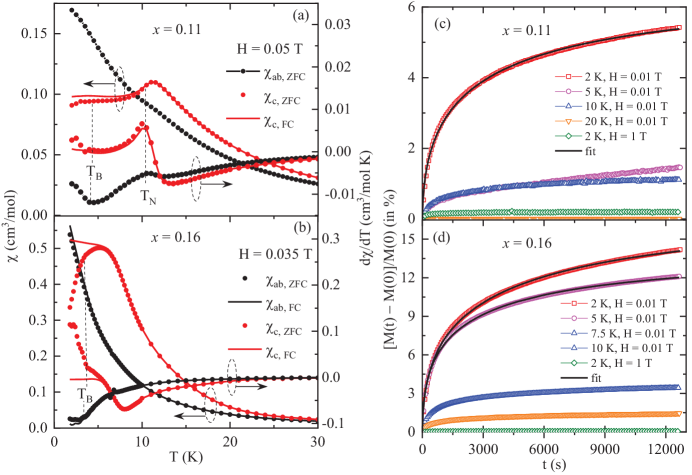
With increasing , the values of and both increase in the ordered state, indicating enhancements by FM fluctuations. For 5% Ni doping a small hysteresis between the ZFC and FC data for in Fig. 3(c) occurs at . The thermal hysteresis in increases for , where along with an AFM transition at K, another anomaly is observed at K which is clearly visible in the lower fields as shown in Fig. 5(a) for T. For , the signature of an AFM transition for T in Fig. 3(e) has almost disappeared, replaced by a strong FM-like increase, although the low-field data in T in Fig. 5(b) confirm the presence of two magnetic transitions at K and K, where is identified below as a blocking temperature. A separate discussion of the low- anomaly observed at for and 0.16 is given in the following section. No signature of AFM ordering of any kind is observed for .
For , Fig. 3 shows that strongly increases and becomes much larger than . At the lowest measured K, for . The ratio increases further for . These observations indicate a strong enhancement of FM -axis spin fluctuations for and 0.31. The FM spin fluctuations and the anisotropy is found to persist up to . The suppression of AFM order associated with the development of strong FM fluctuations in Ca(Co1-xNix)2-yAs2 crystals suggests the presence of a nearby FM quantum-critical point (QCP) close to . We note that a FM QCP can be avoided if preempted by an AFM transition [50, 51, 52].
The data for the and 0.81 crystals in Fig. 3 are significantly reduced in magnitude and are almost independent of with a small anisotropy. The data are also almost independent of for , and exhibit larger anisotropy than for and 0.81. A composition-independent anomaly is observed at K for all three compositions that may be associated with a small amount of O2 adsorbed on the crystal surfaces [53].
IV.2 Low-temperature magnetic features for 0.11 and 0.16
The anomalies in at low observed in Fig. 3 for the and 0.16 crystals were further investigated by measuring at smaller . The respective data measured in T and 0.035 T for and 0.16 are shown in Figs. 5(a) and 5(b), respectively, along with the respective derivatives. For , K. The ZFC and FC data for each composition diverge from each other below , exhibiting an anomaly at a blocking temperature K. The FM fluctuations considerably increase for and it is difficult to ascertain whether long-range AFM order occurs for this composition. Indeed, the zero-field neutron diffraction measurements discussed below show no evidence for long-range AFM ordering for . On the other hand, the data for show clear evidence for a blocking temperature K.
Thus in Ca(Co1-xNix)2-yAs2 crystals the AFM order is suppressed and FM fluctuations increase significantly with increasing Ni substitution. It is therefore likely that for the and 0.16 compositions AFM and FM interactions compete with each other at low which gives rise to a metastable glassy state at a temperature , similar to that observed in many reentrant AFM spin-glass systems [54, 55, 56]. To further elucidate this scenario, we measured the magnetic relaxation behavior at different temperatures for both compositions. The crystals were zero-field-cooled from the paramagnetic (PM) state to the measured temperature at which a magnetic field was switched on and the time evolution of the magnetization was recorded. As seen from Figs. 5(c) and 5(d), a clear dependence of the relative change in magnetization is observed for in the and 0.16 crystals. It is interesting to see that although the relaxation for is negligible for , the relaxation is quite significant at and 5 K for . This difference suggests that the strong enhancement of FM fluctuations along the axis and resultant strong competition between the FM and AFM interactions significantly weakens AFM ordering and pushes the system towards metastability at low . This is consistent with the observation of thermomagnetic irreversibility just below for . Moreover, magnetic relaxation is observed in Figs. 5(c,d) at K for small T, whereas the larger T is seen to prevent the metastable state from forming for both and .
| (K) | s) | ||
|---|---|---|---|
| 0.11 | 2 | 2.98(8) | 0.46(1) |
| 0.16 | 2 | 3.6(1) | 0.45(1) |
| 5 | 2.27(5) | 0.44(1) |
The relaxation behavior observed in Figs. 5(c,d) for is described well by the stretched-exponential dependence
| (1) |
similar to that observed in spin-glass systems [57, 58]. The fits at low temperatures are shown as the solid black curves in Figs. 5(c,d) and the fitted parameters and are listed in Table 2. Although the parameter is similar for both crystals, a significantly larger is observed at K for . This suggests that the competition between AFM and FM interactions is stronger in the crystal, consistent with the data in Fig. 3. Physical interpretations of the parameters and are given in Ref. [58].
IV.3 Magnetic susceptibility
| Compound | , | Field | ||||||
|---|---|---|---|---|---|---|---|---|
| direction | (K) | (K) | ||||||
| CaCo1.86(2)As2 | 52, — | 0.03(2) | 0.443(3) | 1.37(1) | 1.39(1) | 59.5(9) | 61(1) | |
| -0.2(2) | 0.480(1) | 1.43(1) | 64.5(3) | |||||
| Ca(Co0.97Ni0.03)1.86As2 | 22, — | 5.84(5) | 0.299(1) | 1.14(1) | 1.17(1) | 44.2(3) | 44.6(5) | |
| 3.52(3) | 0.349(1) | 1.22(1) | 45.4(2) | |||||
| Ca(Co0.95Ni0.05)1.86As2 | 17, — | 5.80(4) | 0.298(1) | 1.13(1) | 1.14(1) | 34.1(3) | 33.7(6) | |
| 4.70(4) | 0.322(1) | 1.17(1) | 33.1(3) | |||||
| Ca(Co0.89Ni0.11)1.87As2 | 10.5, 4.8 | 3.66(3) | 0.318(1) | 1.16(1) | 1.19(1) | 26.7(2) | 26.7(4) | |
| 3.71(2) | 0.369(1) | 1.25(1) | 26.8(2) | |||||
| Ca(Co0.84Ni0.16)1.89As2 | —, 3.5 | 4.06(2) | 0.285(1) | 1.09(1) | 1.12(1) | 18.4(1) | 18.7(2) | |
| 3.79(2) | 0.335(1) | 1.18(1) | 19.5(1) | |||||
| Ca(Co0.79Ni0.21)1.86As2 | 6.67(3) | 0.268(1) | 1.07(1) | 1.09(1) | 10.9(2) | 11.4(4) | ||
| 5.52(3) | 0.303(1) | 1.13(1) | 12.6(2) | |||||
| Ca(Co0.69Ni0.31)1.87As2 | 6.98(5) | 0.214(2) | 0.95(1) | 0.98(1) | ||||
| 6.77(4) | 0.252(1) | 1.03(1) | ||||||
| Ca(Co0.58Ni0.42)1.87As2 | 4.36(3) | 0.188(1) | 0.89(1) | 0.92(1) | ||||
| 4.14(3) | 0.227(1) | 0.97(1) | ||||||
| Ca(Co0.48Ni0.52)1.87As2 | 3.63(6) | 0.175(2) | 0.86(1) | 0.89(1) | ||||
| 3.98(8) | 0.211(3) | 0.94(1) | ||||||
| Ca(Co0.33Ni0.67)1.89As2 | 3.73(3) | 0.128(1) | 0.73(1) | 0.77(1) | ||||
| 3.66(8) | 0.170(3) | 0.84(1) | ||||||
| Ca(Co0.19Ni0.81)1.94As2 | 3.19(2) | 0.090(3) | 0.60(1) | 0.65(1) | ||||
| 3.90(3) | 0.140(2) | 0.75(1) |
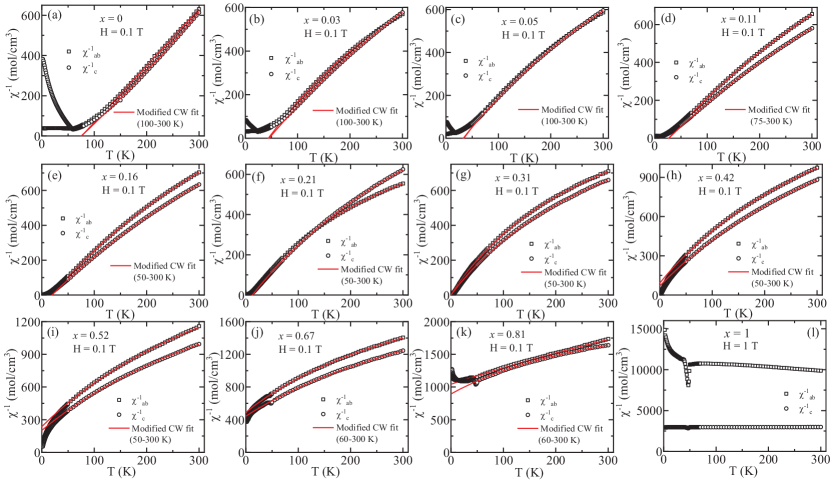
The dependences of the inverse magnetic susceptibilities and for all the Ca(Co1-xNix)2-yAs2 crystal compositions –1 are shown in Figs. 6(a)–6(l). We analyzed the data in the PM regime using the modified Curie-Weiss law for local magnetic moments given by
| (2) |
where is an isotropic -independent term, is the Weiss temperature for field direction , and the Curie constant per mole of formula units (f.u.) is given by
| (3) |
where is Avogadro’s number, is the spectroscopic splitting factor ( factor), is the spin angular-momentum quantum number, is Boltzmann’s constant, and is the effective moment of a spin. The per (Co+Ni) transition metal atom is obtained from per mole of formula units using
| (4) |
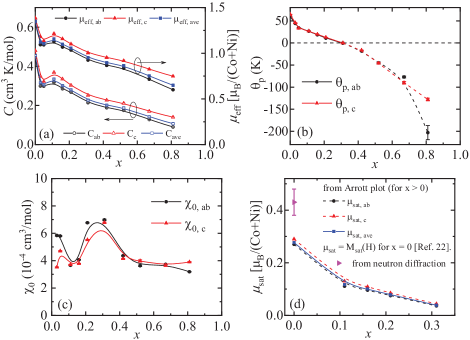
As shown in Figs. 6(a)–6(k), the and data are well described by Eq. (2) in the range noted in the panel for each crystal and the fitted parameters are listed in Table 3. The values of , , , and as a function of for the Ca(Co1-xNix)2-yAs2 crystals are plotted in Figs. 7(a)–7(c). The and decrease with increasing . The positive also decreases with increasing and becomes negative for . The large negative value of for is a result of the overall suppression of at the larger values and does not have physical significance.
In a local-moment picture the isotropic Curie constant in units of for Heisenberg spins with is given by
| (5) |
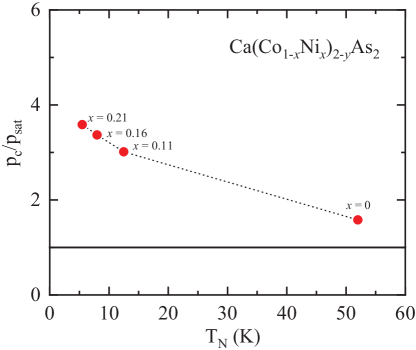
Thus for the minimum with and two spins per formula unit, one obtains . The Curie constants for all the Ca(Co1-xNix)2-yAs2 crystals in Table 3 are much smaller than this value and hence suggest an itinerant character of the magnetism in these crystals as in undoped CaCo2-yAs2 where FM interactions dominate. For an itinerant weak ferromagnet, the degree of itinerancy can be expressed in a Rhodes-Wohlfarth (RW) plot [59, 60] of the ratio versus the FM Curie temperature , where is the saturation moment per transition-metal atom normalized by the Bohr magneton and [27]
| (6) |
For Heisenberg local-moment spins with the value of is equal to unity, whereas a larger value of signifies itinerant magnetic character. Figure 8 shows an RW plot of versus for four of our Ca(Co1-xNix)2-yAs2 crystals, where the values are listed in Table 3. The value of is estimated by plotting versus at (i.e., here) known as an Arrott plot [61, 62] and extrapolating the high-field data to [63] as shown in the insets in Fig. 9 below. For CaCo2-yAs2 the saturation (ordered) moment is taken to be that obtained from zero-field neutron diffraction measurements [26]. We have seen that AFM ordering does not occur for . Therefore proxies for the values of for and 0.21 in the RW plot are taken as the temperatures where the curvature of in Figs. 3(e) and 3(f) respectively change sign from positive to negative on cooling. As seen from Fig. 8, for all measured Ca(Co1-xNix)2-yAs2 compositions and also increases with increasing . This behavior suggests that the Ca(Co1-xNix)2-yAs2 crystals are essentially weak itinerant ferromagnets as expected from the dominance of FM interactions in these materials as also previously inferred for the Sr(Co1-xNix)2As2 system [27].
IV.4 Magnetization versus applied magnetic field isotherms
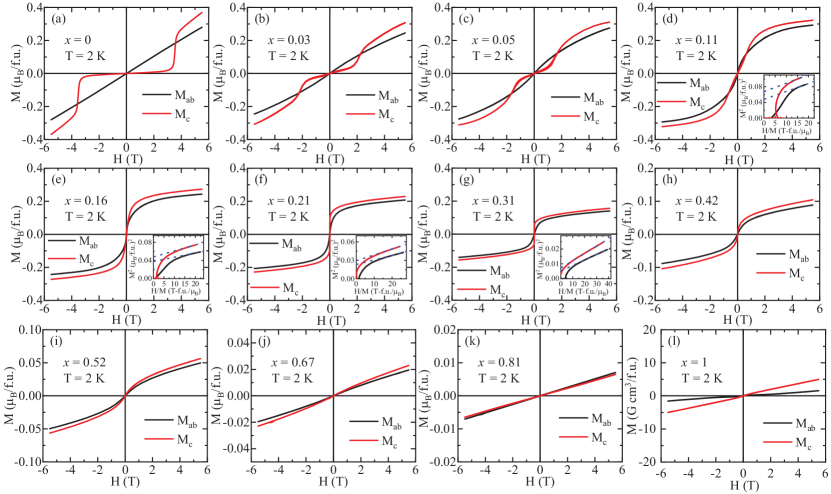
In order to investigate the magnetic-field evolution of the magnetic ground state, magnetization versus applied magnetic field hysteresis measurements were carried out for each of our crystal compositions. Before each measurement the superconducting magnet was quenched to reduce the applied field to zero. Figures 9(a)–9(l) show four-quadrant hysteresis data with and measured at K for each of the Ca(Co1-xNix)2-yAs2 crystals.
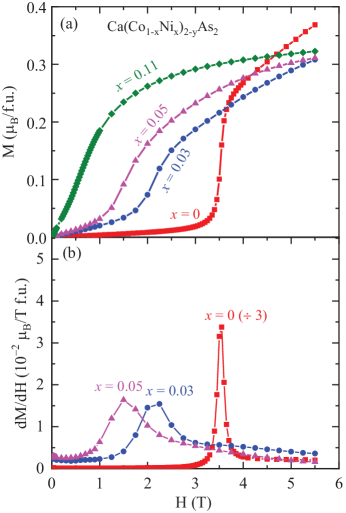
As reported earlier [15, 64, 65], the undoped composition shows a clear spin-flop (SF) transition in the data at T, consistent with the known collinear -axis AFM ordering [26], whereas shows a smooth behavior. Figure 10(a) shows expanded plots of the data in Fig. 9 for , 0.03, 0.05, and 0.11. The latter three compositions show spin-flop transitions. The derivatives versus for these three compositions are plotted in Fig. 10(b) from which we obtain the respective spin-flop fields listed in Table 4.
| direction | (T) | (Oe) | (/f.u.) | (/f.u.) | (/TM) | |
|---|---|---|---|---|---|---|
| 0 | 0.43(5) [26] | |||||
| 0.27 [22] | ||||||
| 3.60(1) | 0.29 [22] | |||||
| 0.03 | ||||||
| 2.2(1) | ||||||
| 0.05 | ||||||
| 1.5(1) | ||||||
| 0.11 | 0 | 0 | 0 | 0.176(2) | ||
| 150(5) | 0.0032 | 0.01 | ||||
| 0.16 | 20(5) | 0.0025 | 0.043 | 0.144(2) | ||
| 160(5) | 0.0139 | 0.03 | ||||
| 0.21 | 0 | 0.0020 | 0.034 | 0.127(2) | ||
| 25(5) | 0.0163 | 0.11 | ||||
| 0.31 | 0 | 0 | 0.009 | 0.094(2) | ||
| 0 | 0.0103 | 0.067 |
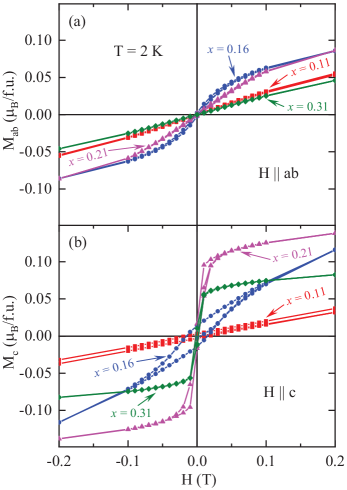
No magnetic hysteresis is observed in Fig. 9 in either or for , 0.03, 0.05 or . However hysteresis in the isotherms at low fields was detected at K for the crystals with , as shown in Figs. 11(a) and 11(b) for and , respectively. These data indicate the occurrence of weak ferromagnetism and the parameters associated with it are the coercive field , remanent magnetization and FM moment listed in Table 4. The observation of small values for and 0.16 and even smaller values for and 0.31 is consistent with the notion that the suppression of AFM ordering is mediated by strong FM fluctuations. The quasi-1D -axis FM fluctuations discussed earlier are also reflected in the behavior, where only the data are hysteretic to some extent, whereas hysteresis is much smaller in the data.
We obtained estimates of the saturation moments for , 0.16, 0.31, and 0.41 from extrapolations to of Arrott plots of versus shown in the respective insets of Fig. 9. The results are listed in Table 4 and plotted in Fig. 7(d) together with the low- ordered-moment for obtained from zero-field neutron-diffraction [26] and T, K) [15] measurements.
V Heat capacity
| Compound | doping | ||||||
|---|---|---|---|---|---|---|---|
| (mJ/mol K2) | (mJ/mol K4) | (J/mol K6) | (mJ/mol K2) | (K) | [states/(eV f.u.)] | ||
| CaCo1.86(2)As2 | 29.6(1) | 0.391(1) | 12.54(5) | ||||
| Ca(Co0.97Ni0.03)1.86As2 | 47.59(8) | 0.126(4) | 0.52(4) | 20.17(3) | |||
| Ca(Co0.95Ni0.05)1.86As2 | 57.98(1) | 0.131(3) | 1.21(3) | 24.57(1) | |||
| Ca(Co0.89Ni0.11)1.87As2 | 53.5(7) | 0.21(1) | 0.44(7) | 10.4(8) | 22.6(3) | ||
| Ca(Co0.84Ni0.16)1.89As2 | 59(1) | 0.14(4) | 0.8(2) | 10.21(3) | 25.0(4) | ||
| Ca(Co0.79Ni0.21)1.86As2 | 55(1) | 0.14(3) | 1.3(1) | 8.14(2) | 23.3(4) | ||
| Ca(Co0.69Ni0.31)1.87As2 | 52(1) | 0.24(3) | 0.6(1) | 7(1) | 22.0(4) | ||
| Ca(Co0.58Ni0.42)1.87As2 | 40(1) | 0.35(1) | 0.37(6) | 4.80(6) | 16.9(4) | ||
| Ca(Co0.48Ni0.52)1.87As2 | 32.9(4) | 0.22(1) | 0.90(5) | 4(1) | 13.9(2) | ||
| Ca(Co0.33Ni0.67)1.89As2 | 29.62(4) | 0.10(3) | 1.67(2) | 12.55(2) | |||
| Ca(Co0.19Ni0.81)1.94As2 | 18.77(6) | 0.15(3) | 1.51(3) | 7.95(3) | |||
| CaNi1.97As2 | 9.3(1) | 0.15(6) | 1.7(6) | 3.94(4) |
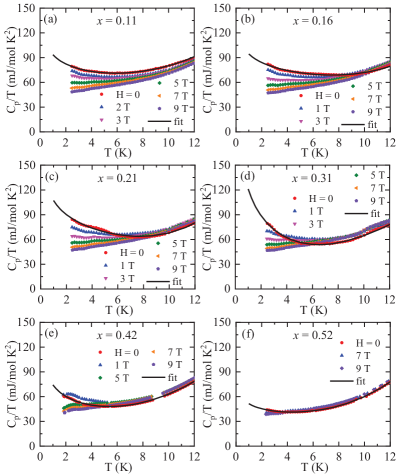
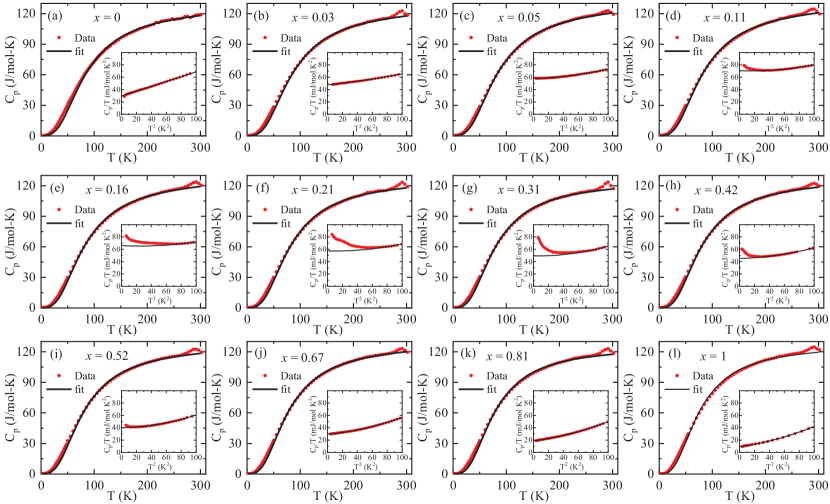
The zero-field heat capacities for all the Ca(Co1-xNix)2-yAs2 crystal compositions are shown in Figs. 12(a)–12(l) in the range 2–300 K. No detectable feature is observed at for any of the respective compositions, evidently due to the small magnetic entropy change in these itinerant magnets at . The value at our high- limit of 300 K is close to the classical Dulong-Petit high- limit J/mol K where is the molar gas constant and here is the number of atoms per formula unit. As seen from the figures for all compositions except , a hump-like feature appears in the at K that is due to melting of the Apiezon N grease used to make thermal contact between the sample and platform of the sample puck. This spurious feature can be avoided by using Apiezon H grease for the high- measurements as shown for the crystal with .
Due to the nonstoichiometry of the Ca(Co1-xNix)2-yAs2 crystals, the charge doping with respect to stoichiometric is not equal to the value of . Instead, noting that Co2+ and Ni2+ respectively have and electron configurations, the doping charge per formula unit in units of the elementary charge is given by
| (7) |
where a negative value of corresponds to hole doping and a positive value to electron doping. The doping levels per formula unit are given for each of the crystal compositions in the second column of Table 5.
The insets of Figs. 12(a)–12(l) show vs for all the Ca(Co1-xNix)2-yAs2 crystal compositions. The low- data in the range 2–10 K for , 0.03, 0.05, 0.67, 0.81, and 1 were fitted by the expression
| (8) |
where is the Sommerfeld electronic heat-capacity coefficient associated with the conduction carriers and the last two terms describe the low- lattice heat-capacity contribution. The fitted parameters are listed in Table 5. As shown in Fig. 12, the vs data for the , 0.16, 0.21, 0.31, 0.42, and 0.52 crystals exhibit an upturn below a temperature below which the vs data are not described by Eq. (8).
As discussed earlier, the AFM interactions are gradually suppressed with increasing Ni substitution in the Ca(Co1-xNix)2-yAs2 crystals. For the and 0.16 crystals the strengths of the AFM and FM interactions are comparable so that the materials settle into a metastable state below their respective . The FM spin fluctuations dominate the AFM fluctuations with a further increase in the Ni concentration as inferred from a strong signature of FM spin fluctuations observed in the susceptibility data for and 0.31 giving rise to a low- upturn in the vs data as shown in the insets of Fig. 12 and further discussed below.
To elucidate and confirm the presence of FM spin fluctuations in the , 0.16, 0.21, 0.31, 0.41, and 0.52 crystals, we measured versus for magnetic fields applied along the axis and the corresponding plots are shown in Figs. 13(a)–13(f). One may argue that such upturns may also be associated with the high- tail of a Schottky anomaly; however, in this case an upturn is expected to increase with increasing magnetic field which conflicts with the observed data. In particular, the upturns in the data are gradually suppressed with increasing magnetic field.
In a magnetic system with FM quantum fluctuations a contribution is observed [27, 30, 66, 67, 68, 69, 70, 71]. We found that the zero-field at low of the , 0.16, 0.21, 0.31, 0.41, and 0.52 crystals can also be well described by
| (9) |
where in addition to the Sommerfeld coefficient and lattice coefficients and , is the spin fluctuation coefficient and is the spin-fluctuation temperature. The fitted parameters are listed in Table 5. The FM spin fluctuations are observed over a wide composition range in Ca(Co1-xNix)2-yAs2 in contrast to the ranges observed in isostructural Sr(Co1-xNix)2As2 [27] and Ca(Co1-xIrx)2-yAs2 [30] crystals where the spin fluctuations were limited to narrow composition ranges.
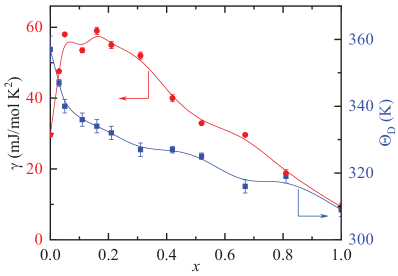
The Sommerfeld coefficient in Table 5 increases by nearly a factor of two with only 3–5% Ni substitutions, indicating a corresponding rapid increase in the electronic density of state at the Fermi energy . The enhanced values are observed for the compositions with strong FM fluctuations. As the strength of these fluctuations gradually decreases for the larger values, correspondingly decreases as shown in Fig. 14. The values are determined from the values using the relation
| (10) |
and are listed in Table 5. Here, is the density of states at determined from measurements and includes the factor of two Zeeman degeneracy of the conduction carriers.
The data in the temperature range 50–300 K are analyzed according to
| (11) | |||||
where is the Sommerfeld coefficient which we use as a variable in this fit, is the number of atoms per formula unit, is the Debye lattice heat capacity per mole of atoms at constant volume, and is the Debye temperature. The high- data associated with the phonon contribution are well described by the Debye model as shown by the black solid lines in Figs. 12(a)–12(l). The fitted parameters are listed in Table 6. From the Table, significantly differs from in Table 5 except for and .
| (K) | ||
|---|---|---|
| 0 | 29.4(3) | 357(4) |
| 0.03 | 28(1) | 347(1) |
| 0.05 | 22(1) | 340(2) |
| 0.11 | 22(1) | 336(2) |
| 0.16 | 16(1) | 334(2) |
| 0.21 | 11(1) | 332(2) |
| 0.31 | 17(1) | 327(2) |
| 0.42 | 13(1) | 327(1) |
| 0.52 | 12(1) | 325(1) |
| 0.67 | 15(1) | 316(2) |
| 0.81 | 13(1) | 319(2) |
| 1 | 8(1) | 309(2) |
VI Neutron Diffraction
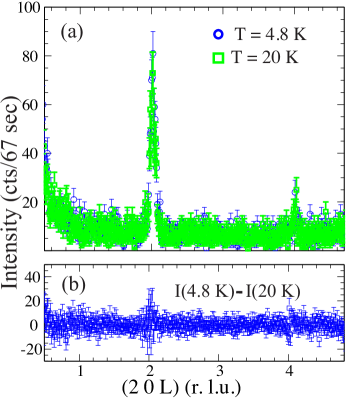
Guided by the magnetic structure of the A-type antiferromagnetism exhibited by the parent compound CaCo1.86As2, we conducted a thorough search for new emerging magnetic Bragg reflections along the r.l.u. (reciprocal-lattice unit) direction [14]. In particular, for A-type antiferromagnetism it is expected to observe (201) and (203) magnetic reflections. Figure 15(a) shows scans along for an crystal at base temperature and at 20 K, i.e., above the anomaly found in [Fig. 3(a)]. As shown by the difference between these two scans in Fig. 15(b), no obvious peaks are observed over the whole range thus excluding A-type ordering. In fact, much longer time counting longitudinal and transverse scans at the (201) position exclude an A-type phase at K assuming that the average ordered moment is not larger than our resolution of per transition-metal atom.
Additional scans along , , and at and 20 K (not shown) do not show evidence of new emerging Bragg reflections that may indicate magnetic ordering that is different from A-type AFM ordering. For instance, the absence of magnetic reflections along eliminates the helical structure recently discovered in the related Sr(Co1-xNix)2-yAs2 system in which adjacent FM layers (moments aligned in the plane) are rotated at a finite angle as they stack along the axis [29]. We note that examination of nuclear Bragg reflections do not show increased intensity as the temperature is lowered from 20 K to base temperature thus excluding FM ordering of the whole system assuming that the ordered moment is not larger than .
Similar experiments for the crystal with scans along and at base temperature and at 20 K were conducted (not shown) and also did not yield evidence of any of the various scenarios that were excluded above within our resolution for the crystal.
VII Theory
VII.1 Band-filling dependence of magnetic phases and their competition
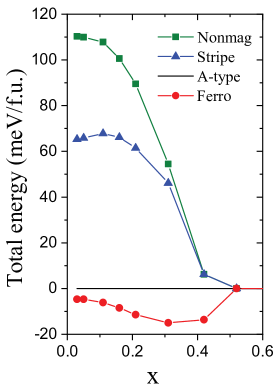
Figure 16 shows the energies of four magnetic configurations, including ferromagnetic, A-type, stripe-AFM, and nonmagnetic states in Ca(Co1-xNix)2As2. For stoichiometric CaCo2As2, FM and A-type AFM configurations have much lower energy than the stripe-AFM ordering, indicating FM intralayer moment alignment is favored over the stripe-AFM intralayer alignment, as observed. The energy difference between the stripe-AFM phase and FM phase is much larger in cT-phase CaCo2As2 than in T-phase SrCo2As2 [72], mainly due to the different -ratios in the T and cT phases. As a result, stripe ordering or fluctuations are unlikely to occur in CaCo2As2-related compounds.
The energy difference between the FM and A-type AFM configurations is much smaller, suggesting that interlayer coupling is much weaker than intralayer coupling. Interestingly, the stoichiometric CaCo2As2 FM state with even has a lower energy than the A-type AFM state found in CaCo1.86As2 from experiments. This suggests that the intrinsic vacancies and the induced local structural relaxation present in experimental samples may play a significant role in stabilizing the AFM interlayer coupling.
Compared to SrCo2As2, CaCo2-yAs2 shows a more stable magnetic ordering and the FM fluctuations exist in a much broader doping range in the Ni-doped compounds. This is likely due to the lack of intralayer FM-AFM competition and the easy-axis anisotropy in CaCo2As2. The much higher stripe-phase energy excludes stripe ordering or fluctuations in CaCo2As2, while both interlayer and intralayer FM-AFM competition coexist in SrCo2As2. Moreover, unlike SrCo2As2, CaCo2As2 has an easy-axis magnetocrystalline anisotropy, which is essential to stabilize the long-range magnetic ordering in 2D systems or layered bulk systems with very weak interlayer couplings, according to the Mermin-Wagner theorem [73].
The calculated magnetocrystalline anisotropy energy in stoichiometric CaCo2As2 is eV/Co with the easy direction along the axis, consistent with the easy -axis anisotropy found in experiments on [22]. For comparison, using the experimental value of the -axis spin-flop field T and the ordered moment /Co [22], we obtain eV/Co. The difference between the two values may be associated with the Co vacancies in which were not accounted for in the theoretical calculation. In addition, magnetic-dipole interactions [74] between the Co spins in the simple-tetragonal Co structure give a small XY anisotropy eV/Co assuming Co point-dipole local moments.
VII.2 Density of States
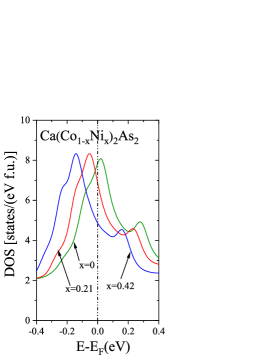
The influence of electron doping on the nonmagnetic density of electron states (DOS) is plotted versus energy relative to the Fermi energy in Fig. 17. The DOS in undoped CaCo2As2 peaks near as previously reported [75]. From Fig. 17, a large amount of electron doping decreases DOS() and suppresses the on-site magnetic moment according to a Stoner-like mechanism within a rigid-band picture, as also found previously for hole doping [75]. Indeed, with electron doping, as shown in Fig. 16 the on-site magnetic moment of atoms in Ca(Co1-xNix)2As2 vanishes at the Stoner transition composition , which agrees well with the experimental fact that no spin fluctuations and magnetic ordering were observed with . Interestingly, calculations also found that a smaller amount of electron doping promotes the FM interlayer coupling against the AFM one, consistent with the above experiments showing that electron doping suppresses the AFM interlayer coupling and induces strong FM fluctuations.
| (e/f.u.) | (states/eV f.u.) | (e/f.u.) | (states/eV f.u.) | |
| 0 | 0 | 7.846 | 0.06 | 13.9(2) |
| 0.21 | 0.42 | 6.754 | 0.50 | 12.55(2) |
| 0.42 | 0.84 | 4.809 | 1.15 | 7.95(3) |
The values of the calculated densities of states at the Fermi energy from Fig. 17 are listed for , 0.21, and 0.42 in Table 7. Three measured values for approximately the same electron-doping levels from Table 5 are listed for comparison. The observed values are roughly a factor of two larger than the bare calculated values, suggesting significant enhancements from electron-phonon and/or electron-electron interactions.
VIII Summary
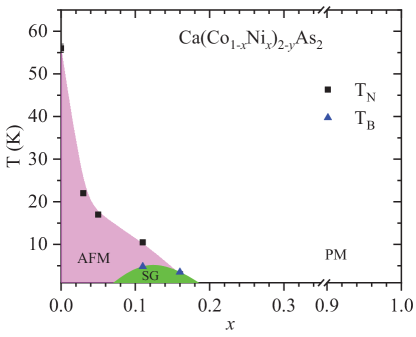
The magnetic phase diagram in the - plane of the Ca(Co1-xNix)2-yAs2 system based on the , isotherm and isotherm and isofield measurements is shown in Fig. 18. The A-type AFM ordering observed at K in the highly-frustrated itinerant parent compound CaCo2-yAs2 is gradually suppressed with Ni substitution and vanishes for . Ni substitution strongly enhances the FM spin fluctuations in this system and as a result rapidly drops to 22 K with only a 3% Ni substitution along with a strong enhancement of the Sommerfeld electronic heat-capacity coefficient.
The FM fluctuations increase further in the and 0.16 crystals and compete with the AFM ordering in these systems until the formation of a low- spin-glass state below a blocking temperature K. With a further increase in Ni concentration quasi-one-dimensional -axis FM spin fluctuations dominate in the and 0.31 crystals where becomes much larger than in the low- region. Small static FM moments at K were observed for , 0.16, 0.21, and 0.31 from magnetization versus field isotherms, with a maximum value of 0.12 /f.u. for .
DFT calculations confirm that FM fluctuations are enhanced by Ni substitutions for Co in CaCo2-yAs2. The FM spin fluctuations are observed over a wide composition range from to at which a Stoner transition to a nonmagnetic state occurs as previously observed in the hole-doped Ca(Co1-xFeAs2 system [75].
The results suggest the presence of a FM quantum-critical point at , which is unusual in such materials. However, a FM QCP can be avoided if preempted by an AFM transition [50, 51, 52]. If FM critical fluctuations persist to low temperatures, a novel ground state such as -wave superconductivity is conceivable [76, 77, 78, 79] with an onset below our low- measurement limit of 1.8 K.
Acknowledgements.
This research was supported by the U.S. Department of Energy, Office of Basic Energy Sciences, Division of Materials Sciences and Engineering. Ames Laboratory is operated for the U.S. Department of Energy by Iowa State University under Contract No. DE-AC02-07CH11358.References
- [1] M. Rotter, M. Tegel, and D. Johrendt, Superconductivity at 38 K in the Iron Arsenide (Ba1-xKx)Fe2As2, Phys. Rev. Lett. 101, 107006 (2008).
- [2] K. Sasmal, B. Lv, B. Lorenz, A. M. Guloy, F. Chen, Y.-Y. Xue, and C.-W. Chu, Superconducting Fe-Based Compounds (Srx)Fe2As2 with = K and Cs with Transition Temperatures up to 37 K, Phys. Rev. Lett. 101, 107007 (2008).
- [3] A. Leithe-Jasper, W. Schnelle, C. Geibel, and H. Rosner, Superconducting State in SrFe2-xCoxAs2 Internal Doping of the Iron Arsenide Layers, Phys. Rev. Lett. 101, 207004 (2008).
- [4] N. Kumar, S. Chi, Y. Chen, K. G. Rana, A. K. Nigam, A. Thamizhavel, W. Ratcliff, II, S. K. Dhar, and J. W. Lynn, Evolution of the bulk properties, structure, magnetic order, and superconductivity with Ni doping in CaFe2-xNixAs2, Phys. Rev. B 80, 144524 (2009).
- [5] Z. Ren, Q. Tao, S. Jiang, C. Feng, C. Wang, J. Dai, G. Cao, and Z. Xu, Superconductivity Induced by Phosphorus Doping and Its Coexistence with Ferromagnetism in EuFe2(As0.7P0.3)2, Phys. Rev. Lett. 102, 137002 (2009).
- [6] D. C. Johnston, The puzzle of high temperature superconductivity in layered iron pnictides and chalcogenides, Adv. Phys. 59, 803 (2010).
- [7] J. Paglione and R. L. Greene, High-temperature superconductivity in iron-based materials, Nat. Phys. 6, 645 (2010).
- [8] P. C. Canfield and S. L. Bud’ko, Magnetism and its microscopic origin in iron-based high-temperature superconductors, Annu. Rev. Condens. Matter Phys. 1, 27 (2010).
- [9] G. R. Stewart, Superconductivity in iron compounds, Rev. Mod. Phys. 83, 1589 (2011).
- [10] P. Dai, J. Hu, and E. Dagotto, Magnetism and its microscopic origin in iron-based high-temperature superconductors, Nat. Phys. 8, 709 (2012).
- [11] P. Dai, Antiferromagnetic order and spin dynamics in iron-based superconductors, Rev. Mod. Phys. 87, 855 (2015).
- [12] D. J. Scalapino, A common thread: The pairing interaction for unconventional superconductors, Rev. Mod. Phys. 84, 1383 (2012).
- [13] For a review of collapsed- and uncollapsed-tetragonal materials, see Sec. VIII of V. K. Anand, P. K. Perera, A. Pandey, R. J. Goetsch, A. Kreyssig, and D. C. Johnston, Crystal growth and physical properties of , and , Phys. Rev. B 85, 174509 (2012).
- [14] D. G. Quirinale, V. K. Anand, M. G. Kim, A. Pandey, A. Huq, P. W. Stephens, T. W. Heitmann, A. Kreyssig, R. J. McQueeney, D. C. Johnston, and A. I. Goldman, Crystal and magnetic structure of CaCo1.86As2 studied by x-ray and neutron diffraction, Phys. Rev. B 88, 174420 (2013).
- [15] V. K. Anand, R. S. Dhaka, Y. Lee, B. N. Harmon, A. Kaminski, and D. C. Johnston, Physical properties of metallic antiferromagnetic CaCo1.86As2 single crystals, Phys. Rev. B 89, 214409 (2014).
- [16] A. Pandey, D. G. Quirinale, W. Jayasekara, A. Sapkota, M. G. Kim, R. S. Dhaka, Y. Lee, T. W. Heitmann, P. W. Stephens, V. Ogloblichev, A. Kreyssig, R. J. McQueeney, A. I. Goldman, A. Kaminski, B. N. Harmon, Y. Furukawa, and D. C. Johnston, Crystallographic, electronic, thermal, and magnetic properties of single-crystal , Phys. Rev. B 88, 014526 (2013).
- [17] B. Li, B. G. Ueland, W. T. Jayasekara, D. L. Abernathy, N. S. Sangeetha, D. C. Johnston, Q.-P. Ding, Y. Furukawa, P. P. Orth, A. Kreyssig, A. I. Goldman, and R. J. McQueeney, Competing magnetic phases and itinerant magnetic frustration in , Phys. Rev. B 100, 054411 (2019).
- [18] W. Jayasekara, Y. Lee, A. Pandey, G. S. Tucker, A. Sapkota, J. Lamsal, S. Calder, D. L. Abernathy, J. L. Niedziela, B. N. Harmon, A. Kreyssig, D. Vaknin, D. C. Johnston, A. I. Goldman, and R. J. McQueeney, Stripe Antiferromagnetic Spin Fluctuations in , Phys. Rev. Lett. 111, 157001 (2013).
- [19] P. Wiecki, V. Ogloblichev, A. Pandey, D. C. Johnston, and Y. Furukawa, Coexistence of antiferromagnetic and ferromagnetic spin correlations in revealed by 59Co and 75As NMR, Phys. Rev. B 91, 220406(R) (2015).
- [20] Y. Li, Z. Yin, Z. Liu, W. Wang, Z. Xu, Y. Song, L. Tian, Y. Huang, D. Shen, D. L. Abernathy, J. L. Niedziela, R. A. Ewings, T. G. Perring, D. M. Pajerowski, M. Matsuda, P. Bourges, E. Mechthild, Y. Su, and P. Dai, Coexistence of Ferromagnetic and Stripe Antiferromagnetic Spin Fluctuations in , Phys. Rev. Lett. 122, 117204 (2019).
- [21] A. S. Sefat, D. J. Singh, R. Jin, M. A. McGuire, B. C. Sales, and D. Mandrus, Renormalized behavior and proximity of to a magnetic quantum critical point, Phys. Rev. B 79, 024512 (2009).
- [22] V. K. Anand, D. G. Quirinale, Y. Lee, B. N. Harmon, Y. Furukawa, V. V. Ogloblichev, A. Huq, D. L. Abernathy, P. W. Stephens, R. J. McQueeney, A. Kreyssig, A. I. Goldman, and D. C. Johnston, Crystallography and physical properties of , Ba0.94K0.06Co2As2, and Ba0.78K0.22Co2As2, Phys. Rev. B 90, 064517 (2014).
- [23] N. Xu, P. Richard, A. van Roekeghem, P. Zhang, H. Miao, W.-L. Zhang, T. Qian, M. Ferrero, A. S. Sefat, S. Biermann, and H. Ding, Electronic Band Structure of BaCo2As2: A Fully Doped Ferropnictide Analog with Reduced Electronic Correlations, Phys. Rev. X 3, 011006 (2013).
- [24] N. S. Sangeetha, V. K. Anand, E. Cuervo-Reyes, V. Smetana, A.-V. Mudring, and D. C. Johnston, Enhanced moments of Eu in single crystals of the metallic helical antiferromagnet EuCo2-yAs2, Phys. Rev. B 97, 144403 (2018).
- [25] N. S. Sangeetha, V. Smetana, A.-V. Mudring, and D. C. Johnston, Anomalous Composition-Induced Crossover in the Magnetic Properties of the Itinerant-Electron Antiferromagnet Ca1-xSrxCo2-yAs2, Phys. Rev. Lett. 119, 257203 (2017).
- [26] W. T. Jayasekara, A. Pandey, A. Kreyssig, N. S. Sangeetha, A. Sapkota, K. Kothapalli, V. K. Anand, W. Tian, D. Vaknin, D. C. Johnston, R. J. McQueeney, A. I. Goldman, and B. G. Ueland, Suppression of magnetic order in CaCo1.86As2 with Fe substitution: Magnetization, neutron diffraction, and x-ray diffraction studies of Ca(Co1-xFex)yAs2, Phys. Rev. B 95, 064425 (2017).
- [27] N. S. Sangeetha, L.-L. Wang, A. V. Smirnov, V. Smetana, A.-V. Mudring, D. D. Johnson, M. A. Tanatar, R. Prozorov, and D. C. Johnston, Non-Fermi-liquid types of behavior associated with a magnetic quantum critical point in Sr(Co1-xNix)2As2 single crystals, Phys. Rev. B 100, 094447 (2019).
- [28] Y. Li, Z. Liu, Z. Xu, Y. Song, Y. Huang, D. Shen, N. Ma, A. Li, S. Chi, M. Frontzek, H. Cao, Q. Huang, W. Wang, Y. Xie, R. Zhang, Y. Rong, W. A. Shelton, D. P. Young, J. F. DiTusa, and P. Dai, Flat-band magnetism and helical magnetic order in Ni-doped , Phys. Rev. B 100, 094446 (2019).
- [29] J. M. Wilde, A. Kreyssig, D. Vaknin, N. S. Sangeetha, B. Li, W. Tian, P. P. Orth, D. C. Johnston, B. G. Ueland, and R. J. McQueeney, Helical magnetic ordering in Sr(Co1-xNix)2As2, Phys. Rev. B 100, 161113(R) (2019).
- [30] S. Pakhira, N. S. Sangeetha, V. Smetana, A.-V. Mudring, and D. C. Johnston, Ferromagnetic cluster-glass phase in Ca(Co1-xIrx)2-yAs2 crystals, Phys. Rev. B 102, 024410 (2020).
- [31] S. Pakhira, N. S. Sangeetha, V. Smetana, A.-V. Mudring, and D. C. Johnston, Short-range ferromagnetic order due to Ir substitutions in single-crystalline Ba(Co1-xIrx)2As2 (), J. Phys.: Condens. Matter 33, 115802 (2021).
- [32] N. S. Sangeetha, S. Pakhira, D. H. Ryan, V. Smetana, A.-V. Mudring, and D. C. Johnston, Magnetic phase transitions in Eu(Co1-xNix)2-yAs2 single crystals, Phys. Rev. Mater. 4, 084407 (2020).
- [33] P. Wiecki, B. Roy, D. C. Johnston, S. L. Bud’ko, P. C. Canfield, and Y. Furukawa, Competing Magnetic Fluctuations in Iron Pnictide Superconductors: Role of Ferromagnetic Spin Correlations Revealed by NMR, Phys. Rev. Lett. 115, 137001 (2015).
- [34] A. Sapkota, B. G. Ueland, V. K. Anand, N. S. Sangeetha, D. L. Abernathy, M. B. Stone, J. L. Niedziela, D. C. Johnston, A. Kreyssig, A. I. Goldman, and R. J. McQueeney, Effective One-Dimensional Coupling in the Highly Frustrated Square-Lattice Itinerant Magnet CaCo2-yAs2, Phys. Rev. Lett. 119, 147201 (2017).
- [35] H. Mao and Z. Yin, Electronic structure and spin dynamics of ACo2As2 (A = Ba, Sr, Ca), Phys. Rev. B 98, 115128 (2018).
- [36] B. G. Ueland, S. Pakhira, B. Li, A. Sapkota, N. S. Sangeetha, T. G. Perring, Y. Lee, L. Ke, D. C. Johnston, and R. J. McQueeney, Carrier Tuning of Stoner Ferromagnetism in ThCr2Si2-Structure Cobalt Arsenides, arXiv:2103.05695.
- [37] B. Cheng, B. F. Hu, R. Y. Chen, G. Xu, P. Zheng, J. L. Luo, and N. L. Wang, Electronic properties of transitional metal pnictides: A comparative study by optical spectroscopy, Phys. Rev. B 86, 134503 (2012).
- [38] APEX3, Bruker AXS Inc., Madison, Wisconsin, USA, 2015.
- [39] SAINT, Bruker AXS Inc., Madison, Wisconsin, USA, 2015.
- [40] L. Krause, R. Herbst-Irmer, G. M. Sheldrick, and D. J. Stalke, Comparison of silver and molybdenum microfocus X-ray sources for single-crystal structure determination, Appl. Crystallogr. 48, 3 (2015).
- [41] G. M. Sheldrick, SHELTX – Integrated space-group and crystal-structure determination, Acta Crystallogr. A 71, 3 (2015).
- [42] G. M. Sheldrick, Crystal structure refinement with SHELXL, Acta Crystallogr. C 71, 3 (2015).
- [43] P. Blaha, K. Schwarz, F. Tran, R. Laskowski, G. K. H. Madsen, and L. D. Marks, WIEN2k: An APW+lo program for calculating the properties of solids, J. Chem. Phys. 152, 074101 (2020).
- [44] J. P. Perdew, K. Burke, and M. Ernzerhof, Generalized Gradient Approximation Made Simple, Phys. Rev. Lett. 77, 3865 (1996).
- [45] C. Li, A. J. Freeman, H. J. F. Jansen, and C. L. Fu, Magnetic anisotropy in low-dimensional ferromagnetic systems: Fe monolayers on Ag(001), Au(001), and Pd(001) substrates, Phys. Rev. B 42, 5433 (1990).
- [46] L. Ke and M. van Schilfgaarde, Band-filling effect on magnetic anisotropy using a Green’s function method, Phys. Rev. B 92, 014423 (2015).
- [47] K. Momma and F. Izumi, VESTA 3 for three-dimensional visualization of crystal, volumetric and morphology data, J. Appl. Cryst. 44, 1272 (2011).
- [48] D. C. Johnston, Unified molecular field theory for collinear and noncollinear Heisenberg antiferromagnets, Phys. Rev. B 91, 064427 (2015).
- [49] M. E. Fisher, Relation between the Specific Heat and Susceptibility of an Antiferromagnet, Philos. Mag. 7, 1731 (1962).
- [50] M. Brando, W. J. Duncan, D. Moroni-Klementowicz, C. Albrecht, D. Grüner, R. Ballou, and F. M. Grosche, Logarithmic Fermi-Liquid Breakdown in NbFe2, Phys. Rev. Lett. 101, 026401 (2008).
- [51] E. Lengyel, M. E. Macovei, A. Jesche, C. Krellner, C. Geibel, and M. Nicklas, Avoided ferromagnetic quantum critical point in CeRuPO, Phys. Rev. B 91, 035130 (2015).
- [52] S. Hamann, J. Zhang, D. Jang, A. Hannaske, L. Steinke, S. Lausberg, L. Pedrero, C. Klingner, M. Baenitz, F. Steglich, C. Krellner, C. Geibel, and M. Brando, Evolution from Ferromagnetism to Antiferromagnetism in Yb(Rh1-xCox)2Si2, Phys. Rev. Lett 122, 077202 (2019).
- [53] Yu. A. Freiman and H. J. Jodl, Solid oxygen, Phys. Rep. 401, 1 (2004).
- [54] J. Dho, W. S. Kim, and N. H. Hur, Reentrant Spin Glass Behavior in Cr-Doped Perovskite Manganite, Phys. Rev. Lett. 89, 027202 (2002).
- [55] S. Pakhira, C. Mazumdar, R. Ranganathan, S. Giri, and M. Avdeev, Large magnetic cooling power involving frustrated antiferromagnetic spin-glass state in NiSi3 ( = Gd, Er), Phys. Rev. B 94, 104414 (2016).
- [56] M. Viswanathan and P. S. Anil Kumar, Observation of reentrant spin glass behavior in LaCo0.5Ni0.5O3, Phys. Rev. B 80, 012410 (2009).
- [57] J. A. Mydosh, Spin Glasses: An Experimental Introduction (Taylor & Francis, London, 1993).
- [58] D. C. Johnston, Stretched Exponential Relaxation Arising from a Continuous Sum of Exponential Decays, Phys. Rev. B 74, 184430 (2006).
- [59] P. Rhodes and E. P. Wohlfarth, The effective Curie-Weiss constant of ferromagnetic metals and alloys, Proc. Roy. Soc. London, Ser. A 273, 247 (1963).
- [60] J. M. Santiago, C.-L. Huang, and E. Morosan, Itinerant magnetic metals, J. Phys.: Condens. Matter 29, 373002 (2017).
- [61] A. Arrott, Criterion for Ferromagnetism from Observations of Magnetic Isotherms, Phys. Rev. 108, 1394 (1957).
- [62] A. Arrott, Equations of state along the road to Arrott’s last plot, J. Magn. Magn. Mater. 322, 1047 (2010).
- [63] Y. Takahashi, Spin Fluctuation Theory of Itinerant Electron Magnetism (Springer, Berlin, 2013).
- [64] B. Cheng, B. F. Hu, R. H. Yuan, T. Dong, A. F. Fang. Z. G. Chen, G. Xu, Y. G. Shi, P. Zheng. J. L. Luo, and N. L. Wang, Field-induced spin-flop transitions in single-crystalline , Phys. Rev. B 85, 144426 (2012).
- [65] J. J. Ying, Y. J. Yan, A. F. Wang. Z. J. Xiang, P. Cheng, G. J. Ye, and X. H. Chen, Metamagnetic transition in Ca1-xSr and 1) single crystals, Phys. Rev. B 85, 214414 (2012).
- [66] P. Fulde and A. Luther, Effects of Impurities on Spin Fluctuations in Almost Ferromagnetic Metals, Phys. Rev. 170, 570 (1968).
- [67] A. J. Millis, Effect of a nonzero temperature on quantum critical points in itinerant fermion systems, Phys. Rev. B 48, 7183 (1993).
- [68] M. Nicklas, M. Brando, G. Knebel, F. Mayr, W. Trinkl, and A. Loidl, Non-Fermi-Liquid Behavior at a Ferromagnetic Quantum Critical Point in NixPd1-x, Phys. Rev. Lett. 82, 4268 (1999).
- [69] M. B. Maple, R. E. Baumbach, N. P. Butch, J. J. Hamlin, and M. Janoschek, Non-Fermi Liquid Regimes and Superconductivity in the Low Temperature Phase Diagrams of Strongly Correlated - and -Electron Materials, J. Low Temp. Phys. 161, 4 (2010).
- [70] L. S. Wu, M. S. Kim, K. Park, A. M. Tsvelik, and M. C. Aronson, Quantum critical fluctuations in layered YFe2Al10, Proc. Natl. Acad. Sci. USA 111, 14088 (2014).
- [71] S. Pandey, V. Siruguri, and R. Rawat, Quantum critical point and intermediate valence fluctuations in CeRu2-xCoxGe2, Phys. Rev. B 98, 155129 (2018).
- [72] W. Jayasekara, Y. Lee, A. Pandey, G. S. Tucker, A. Sapkota, J. Lamsal, S. Calder, D. L. Abernathy, J. L. Niedziela, B. N. Harmon, A. Kreyssig, D. Vaknin, D. C. Johnston, A. I. Goldman, and R. J. McQueeney, Stripe Antiferromagnetic Spin Fluctuations in SrCo2As2, Phys. Rev. Lett. 111, 157001 (2013).
- [73] N. D. Mermin and H. Wagner, Absence of Ferromagnetism or Antiferromagnetism in One- or Two-Dimensional Isotropic Heisenberg Models, Phys. Rev. Lett. 17, 1133 (1966); 17, 1307(E) (1966).
- [74] D. C. Johnston, Magnetic dipole interactions in crystals, Phys. Rev. B 93, 014421 (2016).
- [75] B. G. Ueland, S. Pakhira, B. Li, A. Sapkota, N. S. Sangeetha, T. G. Perring, Y. Lee, L. Ke, D. C. Johnston, and R. J. McQueeney, Carrier Tuning of Stoner Ferromagnetism in ThCr2Si2-Structure Cobalt Arsenides, arXiv:2103.05695.
- [76] D. Fay and J. Appel, Coexistence of -state superconductivity and itinerant ferromagnetism, Phys. Rev. B 22, 3173 (1980).
- [77] E. V. Kuz’min, S. G. Ovchinnikov, and I. O. Baklanov, Comparison of superconductivity in Sr2RuO4 and copper oxides, Phys. Rev. B 61, 15392 (2000).
- [78] M. Mochizuki, Y. Yanase, and M. Ogata, Ferromagnetic Fluctuation and Possible Triplet Superconductivity in NaxCoOH2O: Fluctuation-Exchange Study of the Multiorbital Hubbard Model, Phys. Rev. Lett. 94, 147005 (2005).
- [79] T. Hattori, Y. Ihara, Y. Nakai, K. Ishida, Y. Tada, S. Fujimoto, N. Kawakami, E. Osaki, K. Deguchi, N. K. Sato, and I. Satoh, Superconductivity Induced by Longitudinal Ferromagnetic Fluctuations in UCoGe, Phys. Rev. Lett. 108, 066403 (2012).