Redshift Evolution of Galaxy Group X-ray Properties in Simba
Abstract
We examine the evolution of intragroup gas X-ray scaling relations for group-sized halos () in the Simba galaxy formation simulation. X-ray luminosity vs shows increasing deviation from self-similarity from , with halos exhibiting a large reduction in and slight increase in X-ray luminosity-weighted temperature . These shifts are driven by a strong drop in with time for these halos, and coincides with the onset of black hole jet feedback in these systems at in Simba. The connection with black hole feedback is corroborated by in halos being strongly anti-correlated with and at . This is further reflected in the scatter of : halos with small lie near self-similarity, while those with the highest lie furthest below. Turning off jet feedback results in mostly self-similar behaviour down to . For the X-ray weighted metallicity , stellar feedback impacts the enrichment of halo gas. Finally, halo profiles show that jet feedback flattens the electron density and entropy profiles, and introduces a core in X-ray surface brightness particularly at . This argues that intragroup X-ray evolution is largely driven by jet feedback removing hot gas from the cores of massive groups, and expelling gas altogether in less massive groups.
keywords:
galaxies: formation, galaxies: evolution, galaxies: groups: general, X-rays: galaxies: clusters1 Introduction
Clusters of galaxies are formed as peaks in the primordial density field collapse and subsequently grow through hierarchical clustering. As probes of the high-mass tail of the spectrum of mass perturbations, these clusters allow us to constrain the evolution of structure in the universe. The basic properties of these clusters are largely determined by initial conditions and the dynamically dominant dissipationless dark matter, although baryonic processes can have a non-trivial impact particularly in the group regime. Models of dark matter driven dissipationless collapse are nonetheless broadly successful in predicting relationships between cluster properties, the most common of which being the self-similar model of clusters (Kaiser, 1986). In this scenario, groups and clusters are identical when scaled by mass, which is known as strong self-similarity (Bower, 1997). Under strong self-similarity, the slope of the resulting scaling relations is not expected to evolve with redshift, although there is an expected evolution in the normalisation due to the changing density of the Universe. This model provides us with a clear baseline from which to examine the impact of baryonic physics in cluster formation.
As matter collapses to form these clusters gas experiences adiabatic compression and shock heating, creating a hot intracluster medium (ICM) with temperatures K, which emit X-rays as a result of thermal bremsstrahlung as well as metal emission lines. This hot gas cools and settles into hydrostatic equilibrium. Radiative cooling from dense gas in the cores of all but the most massive systems is expected to create a cooling flow that feeds star formation and accretion onto the central super-massive black hole. However, observed star formation rates (SFRs) are orders of magnitude lower than cooling flow estimates would suggest (Fabian, 2002), resulting in the cluster cooling flow problem.
Feedback from active galactic nuclei (AGN) is often proposed as the solution to the cooling flow problem (Bower et al., 2006; Croton et al., 2006; Somerville et al., 2008), by injecting large amounts of energy into the ICM to keep the gas hot. Several other candidates to solve this problem have been suggested such as magnetic conduction (Narayan & Medvedev, 2001; Fabian, 2002), Type Ia supernova feedback (Sasaki, 2001), and dynamical heating (Birnboim et al., 2007), but the current consensus is that none of these are able to sufficiently counteract cooling. Meanwhile, bubbles of hot gas seemingly created by AGN jets have been observed with sufficient mechanical inflation work to counteract cooling (McNamara & Nulsen, 2007) lending credence to the idea that AGN jet feedback is responsible for the heating of the intracluster medium (ICM), which quenches massive galaxies and solves the cluster flow problem.
Modern models of groups and clusters must therefore include the impact of AGN feedback. Among hydrodynamic simulations, Illustris (Vogelsberger et al., 2014; Genel et al., 2014), Magneticum (Hirschmann et al., 2014), Horizon-AGN (Dubois et al., 2014; Volonteri et al., 2016; Kaviraj et al., 2017), EAGLE (Schaye et al., 2015), MassiveBlack (Khandai et al., 2015), Blue Tides (Feng et al., 2016), Romulus (Tremmel et al., 2017), Illustris-TNG(TNG; (Springel et al., 2018), FABLE (Henden et al., 2018), and Simba (Davé et al., 2019) all include black hole growth and the energetic output resulting from black hole accretion. A plausible connection between AGN feedback and quenching of star formation was able to be established by EAGLE, TNG, FABLE, and Simba thanks to their success in broadly reproducing the observed massive red and dead galaxy population.
Due to the difficult nature of modelling AGN, different simulations have approached the problem in a variety of ways. EAGLE’s implementation employs a single mode of AGN feedback with a fixed efficiency, injecting energy thermally at the location of the black hole (BH) proportional to its accretion rate. This model closely resembles quasar feedback and as such may be effective in breaking self similarity but may lack the effect of jets in opposing cooling and quenching star formation. TNG conversely employs two forms of feedback, with kinetic black hole-driven winds at low accretion rates, and thermal feedback heating gas surrounding the BH at high accretion rates. FABLE employs a modified version of this, in which quasar mode feedback at high accretion rates is stored in the BH until there is enough energy to raise the temperature of a set number of particles by a given amount. Finally, Simba employs high-velocity jets similar to TNG, but does so in a stably bipolar fashion. The nature of the torque-limited black hole accretion model used in Simba means that BHs inherently grow along galaxy-black hole scaling relations with no need for self-regulation (Anglés-Alcázar et al., 2013a), allowing for a more collimated AGN feedback to enact galaxy quenching.
Observations allow us to place constraints on these varying forms of AGN feedback at low redshifts, as we explored in Robson & Davé (2020). X-rays provide an efficient and physically motivated method of detection that allows us to probe the potential well of a cluster through the observation of its X-ray luminosity, . Observed properties such as and the X-ray luminosity-weighted temperature allow us to establish proxies for the cluster mass through the use of scaling relations. These scaling relations have been studied in great detail for low redshifts (Arnaud et al., 2010; Vikhlinin et al., 2009; Pratt et al., 2009; Böhringer et al., 2007). We are then able to use the halo mass to examine the space density of clusters, and more thoroughly test theoretical models of cluster formation.
Moving to higher redshifts, X-ray observations rapidly become more challenging owing to surface brightness dimming, making it difficult to precisely know the evolution of scaling relations with redshift (Reichert et al., 2011). Several studies have found self-similar evolution to redshift driven primarily by the density of the Universe increasing with redshift (Vikhlinin et al., 2002; Maughan et al., 2006). Other works however have found evolution departing from that predicted by self-similarity (Ettori et al., 2004; Branchesi et al., 2007). This lack of consensus may arise from difficulties in managing selection bias in samples of high-redshift clusters drawn from different surveys. Future X-ray telescopes such as Lynx and Athena are expected to allow us to probe larger samples to higher redshifts.
Thus it is timely to make predictions for the expected evolution of groups and clusters within self-consistent models including galaxy formation processes. Such simulations can help us to better understand what constraints on key physical processes such as AGN feedback are possible from present data, as well as improvements to be expected from future facilities. By further examining how the hot gas content of halos evolves over redshift we can hopefully constrain not only the physical processes driving AGN feedback in these dense environments, but also determine how AGN drive the evolution of intragroup and intracluster gas. Particularly enabled by simulations, studying the evolution of a set of simulated halos over time may help us better understand these samples and improve our ability to deal with surveys of high-z objects.
In this paper we examine the redshift evolution of the X-ray scaling relations of halos in the Simba suite of cosmological simulations (Davé et al., 2019). We also track how populations of halos binned by mass evolve along these scaling relations, in order to examine how various galaxy formation processes, particularly AGN feedback, have a differential impact with halo mass. Finally, we examine these trends in test simulations where we turn off individual feedback modules, in order to isolate the particular physics in Simba driving the evolution.
This paper is organised as follows. In Section 2 we discuss the Simba suite of simulations and the key tools in reproducing X-ray scaling relations. In Section 3 we discuss the evolution of X-ray scaling relations from to . In Section 4 we investigate the evolution of these scaling relations utilising differing levels of feedback within simulations. And finally in Section 5 we discuss the evolution of profiles both within the fiducial run, and within the No-Jet run of Simba to examine the impact of jet feedback.
2 Simulations and Analysis
2.1 The Simba simulation
The Simba simulation (Davé et al., 2019) is a cosmological hydrodynamic simulation using the Gizmo code (Hopkins, 2015). The flagship simulation evolves a random cosmological volume of (100 Mpc)3 including dark matter particles and gas elements evolved from initial conditions to the present day. Simba adopts a cosmology with , and in line with Planck Collaboration et al. (2016).
An H2-based model with the H2 fraction computed from the Krumholz & Gnedin (2011) sub grid model is used to model star formation from gas in a Monte Carlo fashion. Chemical enrichment is tracked from Type II supernovae (SNe), Type Ia SNe, and Asymptotic Giant Branch (AGB) stars, tracking eleven elements (H,He,C,N,O,Ne,Mg,Si,S,Ca,Fe) during the simulation. Radiative cooling (both primordial and metal-line) and photoionisation is included using Grackle-3.1 assuming a Haardt & Madau (2012) ionising background, with on-the-fly self-shielding. Star formation driven galactic winds are modelled as decoupled two-phase winds with a mass loading factor scaled to stellar mass as described by the tracking of individual particles in the FIRE zoom simulations (Anglés-Alcázar et al., 2017b).
Black holes are seeded at in galaxies that exceed stellar masses of . There are two modes for the growing of black holes: Torque-limited accretion for gas with K (Anglés-Alcázar et al., 2017a) in which angular momentum is the primary bottleneck to accretion (Hopkins & Quataert, 2011); and Bondi & Hoyle (1944) accretion from higher temperature gas. The galaxy stellar mass threshold is motivated by findings in the FIRE project simulations showing that stellar feedback strongly suppresses black hole growth in low mass galaxies (Anglés-Alcázar et al., 2017c). Simba also includes AGN feedback, which we detail in the next section owing to its central importance in this work.
2.2 AGN feedback in Simba
With AGN feedback proposed as a significant mechanism in quenching star formation and contributing the the evolution of groups and clusters, simulations must take care in modelling their impact. (Heckman & Best, 2014) described two main modes of AGN feedback: Radiative mode at high Eddington ratios (); and jet mode at lower . Simba includes these two modes, plus X-ray feedback from and high-energy photon pressure.
The energy output of radiative mode AGN is dominated by electromagnetic radiation emitted by the accretion disks of central super massive black holes (SMBH). The photon pressure drives multi-phase winds up to speeds of or more, entraining surrounding materials and as a result can include molecular (Sturm et al., 2011) and warm ionised (Perna et al., 2017) gas.
Jet mode AGN on the other hand produce feedback in the form of collimated jets, moving at speeds of order on large scales, and this dominates the energetic output as bulk kinetic energy. This mode is thought to be powered by the advection dominated accretion of hot gas prevalent at low accretion, below (Best & Heckman, 2012) and the spin of SMBHs.
Significant emission from the BHs in both modes also provide a photon pressure on surrounding material. Cold gas, often found around radiative mode AGN, is able to quickly absorb and subsequently radiate away this X-ray photon pressure. However in systems with low cool gas fractions, the photon pressure is able to drive a spherical outward momentum.
The way in which these modes interact with their surrounding medium can have a significant impact on the growth and evolution of the galaxies and halos in which they reside. As a result Simba attempts to implement these forms of feedback in a way that mirrors observations as closely as possible. It is not only important to consider how the feedback is implemented, but when, since we are concerned here with redshift evolution.
Radiative and jet feedback in Simba is modelled as purely kinetic and bipolar, continuous outflows, ejected parallel to the axis of angular momentum of the inner disk. Using observations of ionised gas linewidths of X-ray detected AGN (Perna et al., 2017) the outflow velocity for radiative mode is parametrised in terms of black hole mass as:
| (1) |
This model is similar to the AGN feedback implemented in Gizmo (Anglés-Alcázar et al., 2017a) however includes a variable outflow velocity.
As drops to the jet feedback begins to add an additional velocity component, with a strength depending on the Eddington ratio:
| (2) |
with the velocity increase capped to at 0.02. Additionally jet mode will only be triggered when following observations in which radio jets only occur within galaxies containing black holes with (Barišić et al., 2017). This limit has implications on when jet feedback typically begins in the simulations. As black holes grow in mass with time, we also see a decreasing (Anglés-Alcázar et al., 2013b). This combination of beginning to cross the limit of , and a decreasing we expect to see jet feedback turning on at for central galaxies in group-sized halos.
While radiative mode winds are ejected at the ISM temperature, gas in jets is raised to the virial temperature of the halo. Jets are typically observed to be made up of synchroton-emitting plasma, eventually thermalising an around with surrounding hot gas (Fabian, 2012). To avoid significant radiative losses in the dense gas surrounding the black hole, gas wind elements undergo a short hydrodynamic and radiative cooling decoupling time of where is the Hubble time at launch.
X-ray feedback operates in two forms, depending on the gas it is heating. Non-ISM gas is heated directly according to the heating flux. ISM gas however is low resolution and pressurised such that any added heat would quickly be cooled away. Thus, one half of the energy is applied as a radial outward kick with the other being added as heat. X-ray feedback is only activated at low eddington ratios () alongside full velocity jets. In an attempt to model the ability of gas rich galaxies to absorb and radiate X-ray energy, galaxies must also have a cold gas fraction of . This heating has a minimal effect on the galaxy mass function, however contributes to fully quenching galaxies (Appleby et al., 2019).
Alongside the fiducial box, we have also run a number of versions excluding various modules of the implemented feedback. Due to the computational requirements of running these simulations, these runs use a box with dark matter particles and gas elements. This gives these runs the same resolution as the fiducial run, with th the volume. While this reduces the number of high mass halos, we are still able to examine the impact of the various forms of feedback amongst group-sized halos. The various models run are: a "No-X" model (Simba-NoX) with only X-ray feedback turned off and jets are left on; a "No-Jet" model (Simba-NoJet) with jet and associated X-ray feedback turned off; a "No-AGN" model in which all AGN feedback is turned off; and finally a "No-Feedback" model in which all feedback including star formation winds is turned off. The initial conditions for all runs are identical.
2.3 Identifying halos and computing X-ray emission
Halos are identified via a 3-D friends-of-friends (FoF) finder implemented within Gizmo, using a linking length that is 0.2 times the mean interparticle spacing. Galaxies are identified in post-processing from within these halos, using a 6-D FoF finder applied to star-forming gas and stars. The galaxies and halos are identified and catalogued using the Caesar code (Thompson, 2015). These catalogs, along with particle snapshots, for all the runs described above are publicly available at simba.roe.ac.uk.
The python package Pygad (Röttgers & Arth, 2018) is a multi-purpose analysis toolkit for particle-based hydrodynamics simulations, and gives us tools for the general analysis of simulations. Various criteria such as specific particles, defined regions, or particles that fit within a specified parameter range (e.g. temperature or metallicity) can be used to create sub-snapshots with particles contained within individual Caesar halos.
A module for analysing X-ray luminosity is included in Pygad, using XSPEC (Arnaud et al., 2010) to compute X-ray spectra. XSPEC is fully described in Eisenreich et al. (2017). Pygad calculates the X-ray luminosity of selected gas particles using emission tables in XSPEC along with particle temperatures and metallicities taken from the simulation. In our analysis of Simba’s X-ray properties we use the 0.5-2keV X-ray table to be consistent with the work done in Robson & Davé (2020). Pygad is publicly available at https://bitbucket.org/broett/pygad.
In the end, we identify 1379, 1051, 509, and 126 halos with at , respectively, in our flagship run. This constitutes the main sample that we will analyse for this work.
3 Evolution of Scaling Relations
We begin by examining the evolution of X-ray scaling relations in our selected galaxy groups. Intragroup gas can be characterised by it’s X-ray luminosity , X-ray luminosity-weighted temperature , the hot gas fraction , and the X-ray luminosity-weighted metallicity . To understand the physical drivers behind these relations, we first examine the evolution with respect to , both by looking at the scaling relations at various redshifts, and by tracking individual halos back in time. In the end, we make predictions for the evolution in the most common observable barometer of hot bound gas, the relation, and use the evolution in the physical quantities vs. to provide a context for the predicted evolution in .
3.1 evolution
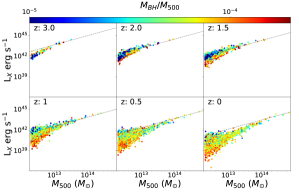
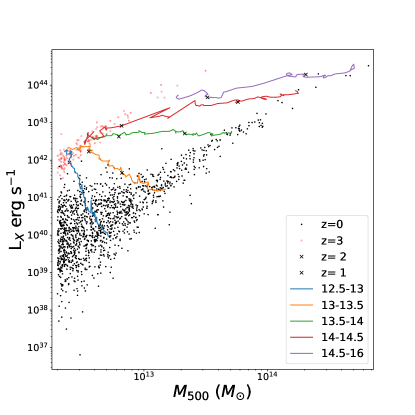
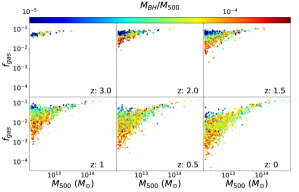
Figure 1 shows the scaling relation for all halos with in Simba at . Points colored by the black hole mass fraction , where is the black hole mass of the central galaxy. The dashed line shows the scaling predicted from the self-similar model, normalized to the most massive halo at that epoch.
A clear is already in place at high redshifts, even though the halos are still relatively small. As time progresses, the overall scaling relation does not change much, but there is a marked increase in the scatter, moreso at low . This starts to become particularly prominent at . At any given redshift, the most luminous X-ray halos at a given follow self-similarity, but there is an increasing number of halos that deviate strongly from it.
A clear trend can be seen in the of lower mass halos. From we see the drop in of low mass halos correspond to an increase in .
These results can be understood by appealing to the impact of AGN jet feedback in Simba. As noted earlier, jet feedback turns on at low . As shown in Anglés-Alcázar et al. (2013a), at these mass scales, the Eddington ratio becomes comparable to the jet threshold at , albeit with a fair amount of scatter. Thus we expect that black holes that have managed to grow large by these epochs will be putting out a significant fraction of their AGN feedback in high-energy jets into intragroup gas. This circumstantially correlates well with driving a decreasing in systems with large at . We will show more evidence for this connection with jet feedback when examining the other scaling relations.
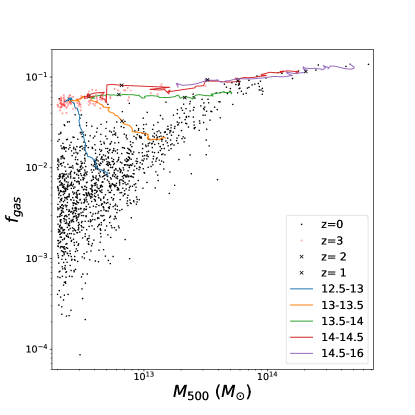
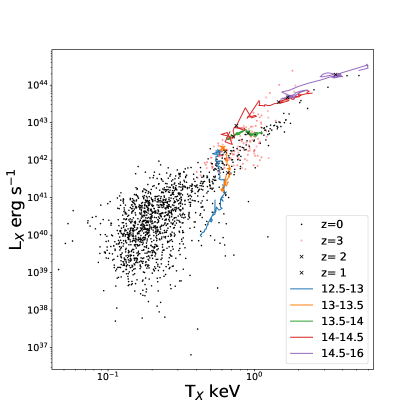
Figure 2 provide another view on how the population evolves to . Here we examine the median evolutionary tracks of halos binned by mass. The small points are in two groupings: The high- grouping (red points) is at while the low grouping (black points) shows the individual halos at . The coloured lines show median tracks of halos in various bins: (purple), (red), (green), (gold), (blue). These are constructed by following individual halos back in time via their most massive dark matter progenitor, so long as the progenitor has .
This shows that halos with (at ) show little change in despite an order of magnitude increase in from to . In contrast, halos with a show over an order of magnitude decrease in , with a smaller increase in mass. The slope of the scaling relation is maintained by low mass halos losing luminosity, along with younger halos forming at the low mass end. In effect, the scaling relation spreads out in over time.
We checked that including only halos with progenitors all the way back to revealed similar trend in the median tracks. However, if one only follows the main descendants of halos from , this reveals that individual scaling tracks almost exclusively retain a constant luminosity as mass increases from to . This indicates that the relation evolves via a combination of massive halos gaining hot gas compensated by the lowering density of the cosmos, along with low-mass halos entering into our sample above our mass cut but containing less hot gas. We will later show that this owes primarily to jet feedback removing hot gas from these lower mass halos, as found in Robson & Davé (2020).
3.2 Evolution
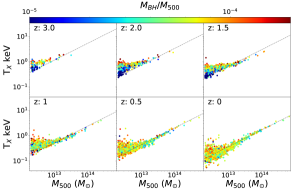
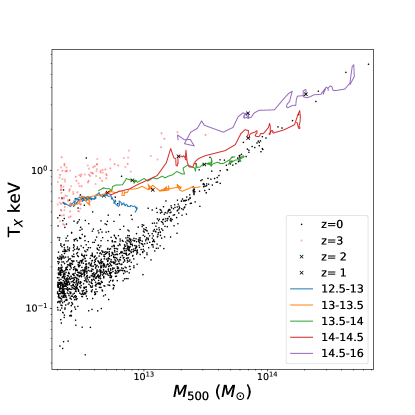
Figure 3 shows the scaling relation at with points colour-coded by , similar to Fig. 1. The self-similar relation is again shown as the dashed line in each panel.
The evolution from shows a very slight steepening of the slope driven by a decrease of amongst the lowest mass halos. The most notable trend is that, amongst the lower mass halos, we see a large scatter in increase from a span of around 0.5 dex, to dex from , with again the most significant change happening around .
Looking at the trend with reveals a muddier situation than with . At high redshifts, there is a clear (though mild) trend that high- halos have high . This makes sense because the integrated AGN feedback energy is higher for high-mass black holes. Yet, the trend disappears at . This suggest that the switching on of jet feedback is breaking the relation between and amongst smaller halos. A possible explanation is that jet feedback expels the hottest gas out of low-mass halos altogether, leaving only (relatively) cooler gas. As a result, there is not a simple relationship with for the scaling; in Simba, stronger AGN feedback does not monotonically increase .
Figure 4 shows median tracks within different halo mass bins, tracked backwards in time from the population, analogous to Fig. 2. Again, we show 5 halo mass bins in as denoted in the legend, and we plot tick marks along the tracks at integer redshifts. The tracks start at on the left hand side and evolve rightwards (growing in ) with time.
We see that the evolution here has some similarities but also some differences relative to the tracks in space. The highest mass halos show a clear increase in temperature from , while the least massive halos at show less change in the X-ray weighted gas temperature. Interestingly, all halos start along the same mildly upwards trend, but while the massive halos continue that trend to , at the low-mass halos stop evolving in , with the lowest mass bin actually dropping in median since . The net effect is a slight steepening of the slope.
This differential evolution with halo mass is likely driven by the interplay between jet feedback and structure formation. At the lower masses, the jets are fast enough to drive substantial material out of halos, heating the surrounding gas but depositing less energy into the halo itself. At the higher masses, the jets cannot escape the halo as easily, and the kinetic energy is thermalised within the halo.
3.3 evolution
In examining and vs. , we have implicated the halo hot gas fraction as an important quantity that is directly impacted by jet feedback. Robson & Davé (2020) showed that without jets on, gas fractions show much larger values in small halos, with not nearly as strong a trend with halo mass. Thus it is worth examining how the gas fraction evolves with time, to provide insights into the evolution of other more directly observable quantities.
Figure 5 shows the scaling relation at with points scaled by the stellar mass fraction . We note that the top of each panel corresponds to reaching the cosmic halo baryon fraction . We define hot gas as gas with K.
From we see that has a fairly weak trend with halo mass. As time goes and particularly at , the scatter increases dramatically at the low-mass end, with an increasing number of halos with lower values. This scatter introduced at lower masses results in a steepening of the scaling relation.
The colour scaling shows an inverse relation between and at , with lower mass black holes corresponding to higher hot gas fractions. This trend is already beginning at , showing the effects of early jet feedback that results in early quenched galaxies, with the effects ramping up most strongly from . The lower hot gas content in halos with more AGN feedback might seem counterintuitive, since one expects AGN feedback to heat gas. But the wind speed of the jets is such that it can easily unbind gas at these lowest masses, whereas for the high-mass halos it will be more easily trapped within the halo. Thus the impact of AGN jets isn’t so much to heat the halo gas, as expel it. This is why we see a correspondingly strong trend with in which is sensitive to gas density, but a weak trend with . We will examine gas densities later when we look at the X-ray profiles.
3.4 evolution
While emission via bremsstrahlung dominates for systems with metal line emission becomes increasingly important towards lower- systems. This includes all but the most massive systems in our sample, and as such an examination of the hot gas metallicity of these systems also provides insight. Moreover, metals provide a unique tracer of supernova-generated products and their distribution into intragroup gas.
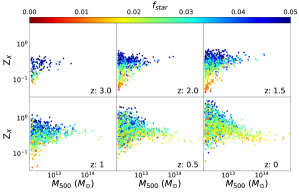
Figure 7 shows the scaling relation at with points scaled by the stellar mass fraction . here is defined as the ratio of stellar mass within against . Through we can infer a level of stellar feedback within a cluster, a key driver behind metallicity. Scaling by , as in previous plots, showed no relation motivating us to investigate the effects of different forms of feedback on evolution.
Between and little evolution is seen in the shape of the relation, with an increase in halos above the mass cut we see little change in metallicity at any given mass with the exception of more massive halos become present. However after we begin to see a change in metallicities seen among low mass halos. Much like previous scaling relations, we see an increase is seen in the scatter at lower masses. In particular, the lowest mass groups can show high intragroup metallicities, exceeding solar in some cases at .
Noting the colour-coding, the high intragroup metallicities correlate fairly well with high in the central galaxy. This trend is very pronounced at high-, but remains noticeable all the way to . At , the lowest metallicity systems have very low stellar fractions, which suggests that these systems have been quenched early on (Cui et al., 2021). This is perhaps not surprising, since the stars are responsible for producing much of the metals in the system, particularly early on. Moving to lower redshifts, re-accretion of enriched intergalactic gas (i.e. “outside-in enrichment"; Oppenheimer et al., 2012) imparts a metal floor in these high density environments, and dilutes the strong trend arising purely from self-enrichment. Nonetheless Simba predicts that poor groups with higher stellar masses (which also tend to have more star-forming galaxies; Cui et al., 2021) will generally to have higher metallicities.
3.5 evolution
The relation has long been a key observational diagnostic of hot gas in massive halos. The evolution of this relation will obviously be a combination of the evolution in each quantity versus from the previous sections. Here we examine this evolution directly, including examining how groups at different masses evolve within space.
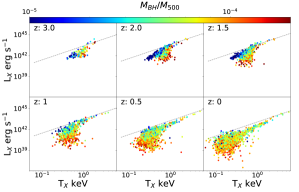
Figure 8 shows the scaling relation at with points colour-coded by . We impose a mass cut of at each redshift. The dashed line shows the self-similar relation normalized to the highest group.
From , the relation looks broadly very similar. The largest halos with the highest are already on the self-similar relation, and by there is a fairly tight locus which sets an upper edge following self-similarity. Over time, there is a growing scatter of points to lower . This becomes particularly prominent at in the lower mass halos. We have similarly seen in and scaling relations that there is a change in evolution for lower-mass groups around this epoch.
There is a marked trend that the groups with the lowest values have the highest values. This directly implicates the impact of AGN feedback in growing a population of low-mass groups that deviates from self-similarity. As we discussed earlier, the effect of the jets is to evacuate the low-mass halos. This lowers the amount of X-ray emitting gas and thus , but we showed that it does not have a strong impact on values in low-mass systems because there is the competing effect that the hottest gas is evacuated from these systems altogether. Simba’s prediction of a strong anti-correlation between and at keV can be tested with next-generation X-ray facilities.
In Figure 9 we show the evolution of the relation in 5 mass bins as indicated in the legend, as before. In this case, the red points depicting values are not wholly distinct from the black points, since there is not a monotonic increase in as there is in .
The scaling tracks offer a very interesting perspective on evolution. The overall relation at and are not that different in terms of the slope and amplitude, although at there are many more low- systems with a large scatter in . The apparent lack of evolution in the relation has been noted in some observations of clusters (Holden et al., 2002; Borgani et al., 2001), though not for lower-mass groups since current X-ray data lacks the sensitivity at . Several other studies have shown this weak evolution at however show varying levels of evolution from motivated by the consideration of the effect of cool core clusters (Vikhlinin et al., 2002; Ettori et al., 2004).
The modest evolution in is seen across all masses, though again there is a different trend for systems that tend to evolve rightwards with a modest increase in , while evolve downwards in with little change in . The net effect is to leave the overall relation relatively unchanged, but to spread out the groups along the relation. Hence even though and individually show significant change over time, the relation combines these two coincidentally into a nearly non-evolving relation, albeit with a large increase in scatter at very low .
4 Effects of Feedback on Scaling Relations
We have implicated jet feedback in driving the evolution of the intragroup medium scaling relations particularly at the low- end. We can test this more directly by examining a suite of smaller runs having the same resolution, with individual AGN and star-formation modules turned on and off. This offers us the chance to directly connect the scaling relations to the physics of the implemented feedback processes.
As previously described, the variant models used for comparison are the full Simba, No-X, No-Jet, No-AGN, and No-Feedback models. No-X turns off only X-ray feedback, No-Jet additionally turns off jet feedback, No-AGN additionally turns off radiative AGN feedback, and No-Feedback additionally turns off star formation winds. Overall, the No-AGN results were very similar to the No-Jet results, showing that the radiative AGN feedback has minimal effect on X-ray scaling relations (as likewise found for galaxy properties; Davé et al., 2019), and as such it has been left out of the following plots for brevity. By investigating the evolution of scaling relations with each feedback variant run we are able to demonstrate each specific model’s impact on each of the previously studied scaling relations.
4.1 Hot Gas Fraction
Since the hot gas fraction is implicated in driving much of the evolution of the scaling relations, we begin by examining how feedback impacts this quantity.
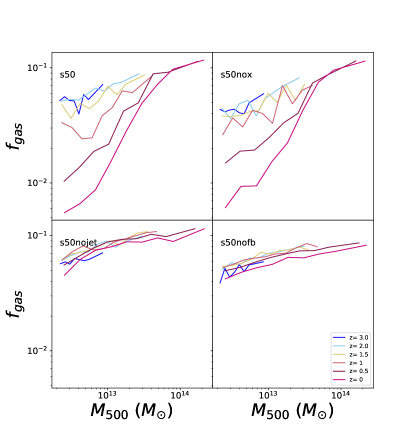
Figure 10 shows the median as a function of at redshifts (blue to red) in various colours as indicated in the legend. The upper left panel shows a run with full Simba physics, and the other panels show the No-X run (upper right), No-Jet (lower left), and No-Feedback (lower right).
There is a dramatic difference in the evolution of once the jet feedback is turned on, seen by comparing No-Jet in the lower left, and No-X in the upper right. Turning on star formation feedback and X-ray AGN feedback have in contrast a fairly minor effect. We clearly see the impact of jet feedback at at while having a limited effect at . Once jets are turned off (No-Jet and No-Feedback runs), there is essentially no evolution in . This clearly demonstrates that it is jets that are responsible for evacuating the hot gas from halos.
The most notable evolution occurs at , which is consistent with the strong increase in scatter seen in various scaling relations at these lower masses around this epoch. This suggests that jet feedback drives gas out of halos in a more stochastic manner, thereby creating large scatter in . Since jet feedback becomes strong at below a few percent, which tends to occur when the black hole mass grows to above Thomas et al. (2019), this then connects the larger black holes with the lower and hence lower . We can see this more clearly by examining the and relations more directly using our feedback variant runs, which we do next.
4.2
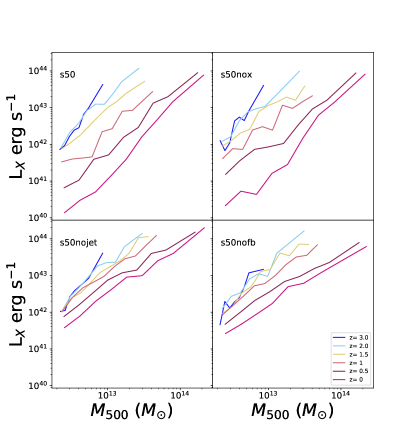
Figure 11 shows the median as a function of at reshifts (blue to red) in various colours as indicated in the legend. The upper left panel shows a run with full Simba physics, and the other panels show the No-X run (upper right), No-Jet (lower left), and No-Feedback (lower right), as in Figure 10.
In full-physics Simba we see a steady decrease in the lowest luminosities, with the highest luminosities remaining relatively consistent as masses increase from to . This is inline with what we saw in the box. We see very little difference in the overall evolution of the No-X run, suggesting that X-ray feedback has minimal effect on the evolution of the X-ray luminosity.
In contrast, in the No-Jet run we immediately see the impact of jet feedback. Scaling relations at high redshifts match closely with Simba’s, but much less evolution in is seen, with minimum values not going below erg s-1. The slope of the relation is mostly invariant. NoFB shows a similarly low amount of evolution, showing that SF feedback (and radiative AGN feedback) have fairly minimal impact on this scaling relation. However, there are some non-trivial differences, particularly in the most massive halos that seem to have lower without any feedback. Hence stellar and radiative AGN feedback seem to work to increase the X-ray luminosities. The origin is likely from the slight increase in hot gas content from NoFBNo-Jet as seen in Figure 10, because the NoFB case locks more of the halo’s baryons into stars (Appleby et al., 2021).
4.3
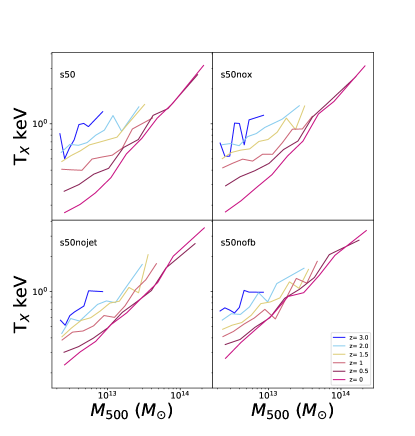
Figure 12 shows the median as a function of at redshifts (blue to red) in various colours as indicated in the legend. The panels are ordered among the feedback variants as before.
We see quantitatively similar behaviour as in the relation, though less dramatically. Jet feedback has the clearest impact on this scaling relation, particularly on the least massive halos. This can be seen from the difference between the No-Jet in the lower left, and No-X in the upper right. The noticeable difference in the evolution between these two runs begins at . The outcome of jets is to, perhaps counter-intuitively, lower the temperature of the hot gas in low-mass halos; we speculated this earlier, but here it is clearly demonstrated. At high masses, none of the feedback models have a significant effect on . Nonetheless, it is worth noting that stellar feedback impacts the temperature of low mass at early times, producing a steeper scaling relation. Thus evolution owes to a combination of different feedback processes operating at different times.
4.4
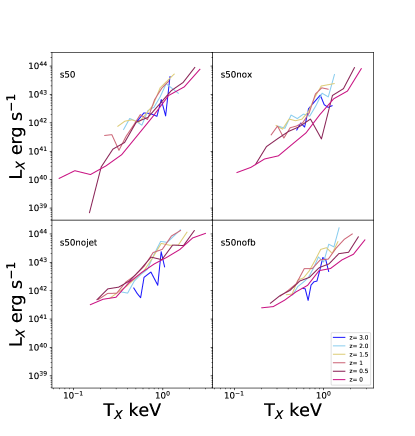
Figure 13 shows the median as a function of at redshifts (blue to red) in our various feedback runs.
Remarkably, despite clear evolution in and , the relation seems to show little evolution, and indeed not much sensitivity to feedback. This occurs because jet feedback lowers both and , resulting in halos moving further down the relation, but not changing its slope or amplitude much. The net effect is that AGN jet feedback “stretches out" the relation, but doesn’t substantially alter it. In detail, the relation does get a bit steeper once jets are turned on, because the drop in due to the evacuation of halos is more severe than the lowered owing to the hot gas being unbound from low-mass halos. Hence AGN jets do break the self-similarity in at low masses, but the effect is not as dramatic as seen in the individual relations vs. .
In Robson & Davé (2020) we proposed that Simba’s scaling relations at were a result of the implemented jet feedback evacuating hot gas in lower mass halos. In Fig 11 and Fig 12, Simba and No-X show a clear deviation in their evolution after , around the time jet feedback kicks in in the Simba simulations. This lends credence to the idea that jets are responsible for Simba’s ability to match X-ray scaling relations, which is mainly driven by the gas fraction evolution.
4.5
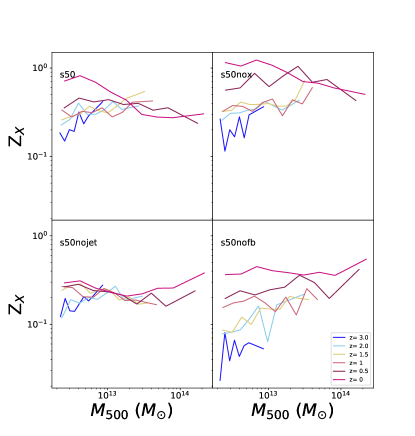
Figure 14 compares the scaling relations of the various feedback runs, in the same format as the previous plots.
In contrast to the other quantities, jet feedback appears not to be the main driver of evolution in . In NoFB we see a steady increase in metallicity over time, which disappears in the No-Jet case, which instead has metallicities remaining fairly steady solar across time (i.e. roughly the value in the No-Feedback run). We do not show it, but the No-AGN case is similar to No-Jet. This shows us that stellar feedback is increasing the metallicity of hot gas to observed levels early on and then maintaining them.
Nonetheless the jets do have some effect. In the No-X run, with the introduction of jet feedback we see the X-ray weighted metallicities increase mildly after in the most massive halos relative to No-Jet, and slightly later but more noticeably after in the least massive halos. Hence jets are an important factor for increasing the metallicity in hot intragroup gas at later epochs, presumably by transporting metals out of galaxies in the process of quenching them.
The inclusion of X-ray feedback in the Simba run then sees these late brought back down to in all but the least massive halos at . This drop relative to No-X is concordant with the drop in the stellar fraction produced in massive galaxies (Davé et al., 2019), thus indicates the effect of X-ray feedback in fully quenching galaxies in Simba.
Overall, jet feedback has the largest impact in altering the scaling relations from the No-Feedback case. The No-Feedback scalings are, not surprisingly, broadly consistent with self-similar scaling, albeit with deviations at low masses owing to excessive cooling in this model (Davé et al., 2002). Jets evacuate low mass halos and result in lower temperatures for the gas that remains, giving lower and values. The metallicity, meanwhile, is primarily deposited by star formation feedback at early epochs, though jet feedback tends to result in higher in low-mass halos at late epochs.
5 Profiles
Global weighted measures tend to weight central regions more heavily where much of the X-ray emission arises, resulting in the properties used in these scaling relations being more sensitive to the core. It is interesting to ask where in radius the various feedback processes in Simba impact the observable properties. To garner a more detailed view of where feedback impacts the halo we examine the evolution of these halos’ profiles. Thus we examine the evolution of profiles in the fiducial Simba run for electron density (), X-ray surface brightness , , and entropy , and subsequently compare with the No-Jet run since we have shown that the jets have the largest impact on the hot gas properties.
We generate projected (2-D) profiles for halos with and , by stacking halos in these mass bins scaling each to their respective values. These profiles are plotted for . Profiles at show similar trends as at and so were omitted for clarity.
5.1 Full Simba Profiles
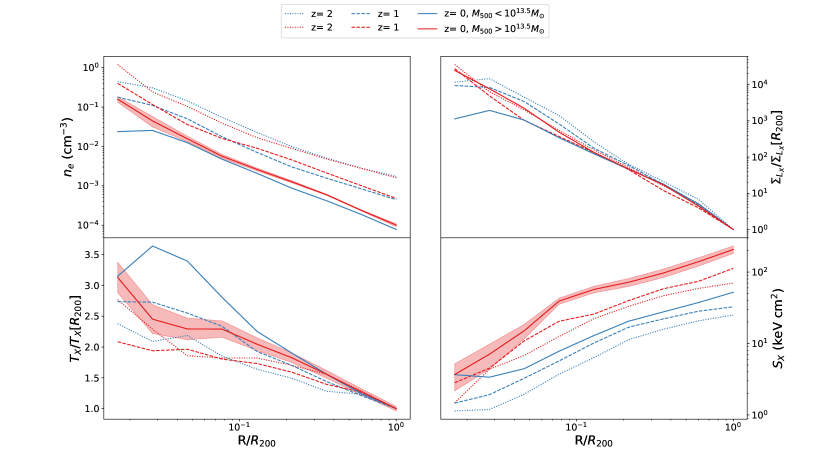
Figure 15 shows the median profiles for electron density () in the top left plot, surface density ( where is the surface area of the 2-D radial bin) scaled by its value at in the top right, scaled by its value at in the bottom left, and Entropy () in the bottom right. Here Entropy is defined as and is calculated by dividing the temperature of each particle by its and then calculating the weighted average across the radial bin. Profiles are represented by dotted, dashed, and solid lines for , and respectively. Profiles of halos with are blue and halos with are red. The shaded areas represent the standard error and are shown on halos with at . We scale and by their values at in order to highlight the evolution in the shapes of these profiles; the amplitude evolution for these quantities was quantified in the previous section.
The top left panel shows the electron density profiles. The most visible trend in both mass bins is a steady decrease in the amplitude with time. Less evident but still clear is a slight flattening, indicating a stronger decrease in core density. At and the profiles for and lie very close to each other, consistent with self-similarity. However, at we see that the two mass bins have diverged in amplitude, with more massive halos having an overall higher electron density. Notably, this occurs at all radii, and is not limited to the core. This is consistent with the stronger removal of hot gas due to jet feedback that heats the gas in lower mass halos, but is not expected in a scenario where more efficient cooling in lower mass systems depletes the hot gas in the central region.
Moving to the temperature profiles in the lower left panel of Figure 15, we first note that most of the profiles are within a factor of two of being isothermal (note the small range in -axis). Within this, however, some notable differences in profile shapes are seen. Even at early epochs, high-mass halos have a steeper profile than low-mass ones. Both mass bins have steeper profiles with time, and by they exhibit a mildly cooler core at . None of these core drops are so dramatic as to identify these systems as “cool core" systems, which have profiles dropping well below in the centres. While some individual profiles do this, the mean profile is not a classic cool core system in either mass bin. The variation among individual profiles and their central cooling times is an interesting study that we leave for future work; here we simply note that there are mild differences in profile shapes in the two mass bins over time.
The electron density plus the temperature are the main determinants of the X-ray luminosity. Figure 15, top right, shows profiles scaled to their value at . Overall, the profiles in both mass bins becomes slightly shallower with time, showing a pronounced central peak at reflective of the peak in the profile then. Already at , differences emerge in the core, with a slight flattening of the inner profile between in the low-mass halos, becoming even more pronounced at . The outer () profiles remain fairly consistent at all redshifts, indicating that the drop in X-ray luminosity for low-mass systems at late times (and the associated departures from self-similarity) arises primarily from the core region, likely indicating the effect of jets on the cores of lower mass halos.
Finally we investigate the X-ray weighted entropy profiles in the bottom right plot of Figure 15. Here the combined effect of and can be seen as given by the entropy definition. A steady increase in entropy can be seen in both mass bins, with lower mass halos exhibiting more flattening across redshift. While both mass bins show a similar raising of core entropies, lower mass halos do appear to exhibit overall lower entropies at early times. This is consistent with the idea that cooling is more effective in low-mass halos at early epochs, but by , the jet feedback has evacuated gas such that it raises the entropy particularly strongly in low-mass systems. This raised entropy is likely a critical factor to suppress cooling in these systems in order to keep galaxies quenched.
5.2 No-Jet Profiles
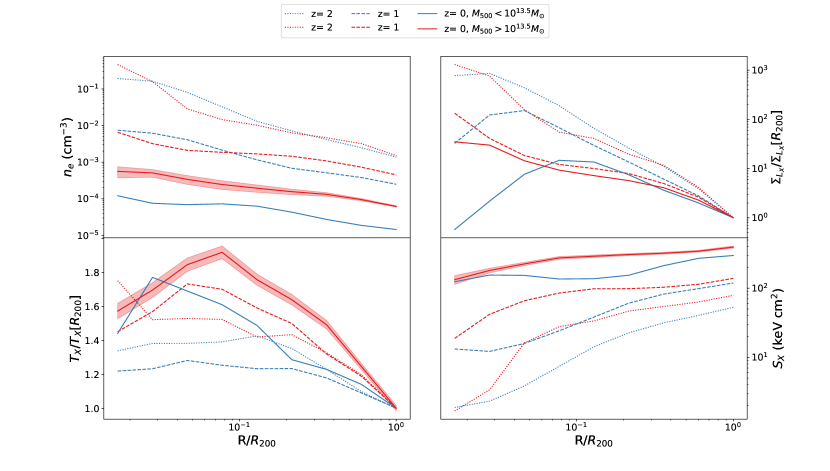
We have implicated jets in impacting the evolution of low-mass profiles in comparison with higher-mass systems. We can test this more directly by examining the same set of profiles in our No-Jet run. We note that here we must use the run here, but we have checked that the profiles in the full Simba run follows the same trends as those in the fiducial volume that we presented in the previous section. However, this does mean that the bin is notably less populated in the No-Jet case owing to the smaller volume.
Figure 16 shows the profiles in the No-Jet run, formatted as in Figure 15, displaying profiles at (solid, dotted, dashed lines) in high and low halo mass bins (red and blue, respectively).
For the profiles, in the top left plot, we see two interesting effects: Firstly there is significantly less evolution across mass scales, with only an order of magnitude decrease in density, as opposed to the 3 orders of magnitude decrease seen in Figure 15. This difference in evolution is most notable in the core regions, with all halos maintain a much higher core density over redshift, even while the electron density at has fairly similar evolution with and without jets; the electron density profiles without jets are thus much steeper than with jets.
Secondly the two mass bins evolve in line with each other, with the only difference being a flatter inner core electron density seen in the lower mass halos. Thus without jets, the profiles are much more in line with self-similarity, with perhaps a mild effect from other feedback processes concentrated at in lower-mass groups. Comparing with Figure 15, this implicates jets in lowering the electron densities across the entire mass range, and doing so across all radii.
The profiles in the lower left panel of Figure 16 also experience a similarly mild evolution. The shapes of the profiles remain fairly constant in both mass bins, with halos maintaining higher temperature cores. In detail, the profiles are actually steeper for low mass halos vs. high-mass ones, which is opposite to the trend seen in the full-physics Simba case. By , the inner profiles in the low-mass groups shows a significant elevation, possibly due to enhanced energy input from other feedback processes combined with cooling out of the lower-temperature gas to form into stars. Comparing to Figure 15, the No-Jet profiles are clearly much steeper, and the effect of jets here is already evident at with steeper profiles. This may indicate that even early low level jet feedback works to push hot X-ray emitting gas from cores to the outer regions. This trend strengthens down to , particularly in the low-mass groups.
In the top right plot of Figure 16, the profiles are again notable for showing very little evolution in the shape of the profiles, except for a slightly lower core luminosity seen in the lower mass halos. This directly mimics the trend seen in the electron densities. Moreover, by , the profiles are definitely steeper than in the fiducial run in Figure 15. This most clearly demonstrates that it is AGN jet feedback that is primarily responsible for breaking the self-similar scaling of the X-ray emission. Other feedback and cooling effects have a much smaller impact.
Finally in the bottom right panel of Figure 16 we show the entropy profiles. We see a steady but slow increase in the normalisation of the entropy profiles. The lower mass halos fail to come in line with the most massive halos, and most notably neither bin experiences a rise of core entropy with respect to the outer regions. This is in line with the idea that jets work to remove low entropy gas, especially from the cores of halos. The low central entropy allows for substantial cooling that keeps galaxies fueled and star-forming even in high-mass halos in the No-Jet run, which does not agree with observations. This highlights how jets are responsible for quenching star formation in massive systems, via their impact on the hot gas in the cores of massive halos.
Overall we see little to no evolution in the shape of the X-ray profiles in the No-Jet case, along with a smaller evolution in the normalisation of these profiles. This indicates that jets not only impact the overall properties, but also importantly how these properties are expressed as a function of radius. Interestingly we see jets having an effect in flattening profiles, or creating larger cores (specifically in the low mass profiles). Finally while jets have a clear impact in the shapes of profiles in both mass bins, larger effects are seen in the normalisations of these profiles in the bin, highlighting the greater impact of jet feedback on lower mass halos.
6 Summary
In this paper we have examined the redshift evolution of the X-ray scaling relations and X-ray profiles of intragroup gas within the Simba suite of cosmological hydrodynamical galaxy formation simulations. We consider the scaling relations at particular redshifts from , the median paths of halos in different mass bins through scaling relation space, and the hot gas and X-ray profiles of intragroup gas. We isolate the physical processes driving this evolution by comparing among feedback variant Simba runs with different feedback models turned on an off, in comparison with the baseline model of self-similar evolution. We show that:
-
•
Simba halos show are consistent with a self-similar slope of their X-ray scaling relations at , while at there are an increasing number of groups that are substantially deviated from self-similarity.
-
•
Evolution of the scaling relation sees significant change occurring after driven primarily by a decrease in among halos with . This is further corroborated by median tracks of halos showing that the least massive halos show a 2 dex drop in for a 0.3 dex increase in while the most massive halos show a slight increase in for an order of magnitude increase in from .
-
•
Evolution of the appears to be driven by an overall decrease in for halos with . Following halo over time indicate that the least massive halos at do not lower in suggesting that halos crossing above at later epochs are responsible for the lowering of in the smaller halos.
-
•
The hot gas fraction vs. shows dramatic evolution at with a large drop and increasing in scatter particularly for systems. This scatter is highly correlated with the black hole mass fraction , such that halos with central galaxies having high have low and vice-versa. Median tracks show that halos with have hot gas fractions encompassing the majority of the cosmic baryon fraction, while halos show an order of magnitude decrease.
-
•
The X-ray weighted metallicity shows a significant trend with the stellar baryon fraction in halos at early epochs, which gets washed out over time. Larger groups have a metallicity around one-third solar, while smaller groups generally have slightly higher metallicity but with a very large scatter.
-
•
The relation shows an increasing departure from self-similarity with time, with a growing population at keV having lower that becomes particularly prominent at . The halos that are most deviant from self-similarity are the ones with the highest , circumstantially implicating black hole feedback as the cause of this deviation.
-
•
To pinpoint the particular physical processes driving the above evolution, we examine smaller Simba runs with specific feedback modules turned off. Turning off both AGN and star formation feedback results in little evolution in , and modest evolution in and mostly consistent with self-similarity.
-
•
Introducing stellar (but no AGN) feedback does not change , , or , but it does result in significantly earlier deposition of metals into the hot gas even by .
-
•
Introducing AGN jet feedback has a dramatic impact on scaling relations. Jets are clearly implicated in lowering in groups, particularly at . This reflects in a dramatic reduction in in such groups over time, and an increased reduction in with time.
-
•
Remarkably, the evolution undergoes a sort of cancellation, in that the lowering of both and results in groups evolving mostly along the relation. The net effect is that groups today end up much more spread out along the relation, but the overall relation is surprisingly similar in slope and amplitude in all the feedback variants.
-
•
The evolution is unique in that it is more impacted by stellar feedback than AGN feedback. With no feedback, a steady increase is seen in metallicity. The inclusion of stellar feedback produces hot gas metallicities even by . The inclusion of jet and X-ray feedback then seems to reintroduce a modest level of upwards evolution in metallicity particularly in low-mass halos, resulting in the final relation that increases mildly to low halo masses.
-
•
Electron density profiles in Simba drop and flatten with time, at all masses. The drop in smaller groups from is however significantly greater than in larger systems. profiles also experience a flattening at all mass ranges, however it is most prominent at , growing a constant surface brightness core () by . The temperature evolution is not dramatic, but entropy is also flattened, resulting in all groups having median core entropies above 100 keV cm2.
-
•
Turning off jet feedback has significant impact on both the shape and normalisation of these profiles. Electron density, temperature, and luminosity profiles are steeper. There is much less difference between the two mass bins, with only a very small core appearing at late times in the lower mass groups. The entropy profile is much steeper, with typical entropies at below 10 keV cm2 at all masses.
These results overall show that the implementation of AGN jet feedback in Simba has a significant impact on X-ray properties both globally and in terms of their profiles. It is this feedback that causes strong departures from self-similarity, which tend to become noticeable around as AGN jets turn on in central group galaxies, and that results in intragroup gas that closely matches X-ray observations at as shown in Robson & Davé (2020). The evolution of X-ray profiles provides further constraints on these models, demonstrating the effects of feedback in evacuating low entropy gas and creating X-ray surface brightness cores particularly in lower-mass groups.
A dearth of observations at these mass scales at , along with an overall lack of consensus caused by selection biases in available results, makes it premature to compare the evolution of Simba’s groups to X-ray observations. With future missions such as Lynx and Athena providing significantly deeper observations that will push toward higher redshifts, it should be possible to further constrain these models providing even greater insight into exactly how AGN feedback impacts the growth of groups and clusters. In future work we plan to examine how these next-generation telescopes will help uncover the physics of gas within groups and clusters, with the successes of Simba suggesting that it provides a suitable framework for interpreting these observations.
Acknowledgements
The authors thank Weiguang Cui, Nicole Thomas, Sarah Appleby, and Rohit Kondapally for helpful discussions. RD acknowledges support from the Wolfson Research Merit Award program of the U.K. Royal Society. This work used the DiRAC@Durham facility managed by the Institute for Computational Cosmology on behalf of the STFC DiRAC HPC Facility. The equipment was funded by BEIS capital funding via STFC capital grants ST/P002293/1, ST/R002371/1 and ST/S002502/1, Durham University and STFC operations grant ST/R000832/1. DiRAC is part of the National e-Infrastructure.
Data Availability
The raw simulation data and catalogs for all the runs used in this paper are available at https://simba.roe.ac.uk. The X-ray data will be made available on request to the lead author.
References
- Anglés-Alcázar et al. (2013a) Anglés-Alcázar D., Özel F., Davé R., 2013a, ApJ, 770, 5
- Anglés-Alcázar et al. (2013b) Anglés-Alcázar D., Özel F., Davé R., 2013b, ApJ, 770, 5
- Anglés-Alcázar et al. (2017a) Anglés-Alcázar D., Davé R., Faucher-Giguère C.-A., Özel F., Hopkins P. F., 2017a, MNRAS, 464, 2840
- Anglés-Alcázar et al. (2017b) Anglés-Alcázar D., Faucher-Giguère C.-A., Kereš D., Hopkins P. F., Quataert E., Murray N., 2017b, MNRAS, 470, 4698
- Anglés-Alcázar et al. (2017c) Anglés-Alcázar D., Faucher-Giguère C.-A., Quataert E., Hopkins P. F., Feldmann R., Torrey P., Wetzel A., Kereš D., 2017c, MNRAS, 472, L109
- Appleby et al. (2019) Appleby S., Davé R., Kraljic K., Anglés-Alcázar D., Narayanan D., 2019, arXiv e-prints, p. arXiv:1911.02041
- Appleby et al. (2021) Appleby S., Davé R., Sorini D., Storey-Fisher K., Smith B., 2021, arXiv e-prints, p. arXiv:2102.10126
- Arnaud et al. (2010) Arnaud M., Pratt G. W., Piffaretti R., Böhringer H., Croston J. H., Pointecouteau E., 2010, A&A, 517, A92
- Barišić et al. (2017) Barišić I., et al., 2017, ApJ, 847, 72
- Best & Heckman (2012) Best P. N., Heckman T. M., 2012, MNRAS, 421, 1569
- Birnboim et al. (2007) Birnboim Y., Dekel A., Neistein E., 2007, MNRAS, 380, 339
- Böhringer et al. (2007) Böhringer H., et al., 2007, A&A, 469, 363
- Bondi & Hoyle (1944) Bondi H., Hoyle F., 1944, MNRAS, 104, 273
- Borgani et al. (2001) Borgani S., et al., 2001, ApJ, 561, 13
- Bower (1997) Bower R. G., 1997, MNRAS, 288, 355
- Bower et al. (2006) Bower R. G., Benson A. J., Malbon R., Helly J. C., Frenk C. S., Baugh C. M., Cole S., Lacey C. G., 2006, MNRAS, 370, 645
- Branchesi et al. (2007) Branchesi M., Gioia I. M., Fanti C., Fanti R., 2007, A&A, 472, 739
- Croton et al. (2006) Croton D. J., et al., 2006, MNRAS, 365, 11
- Cui et al. (2021) Cui W., Davé R., Peacock J. A., Anglés-Alcázar D., Yang X., 2021, arXiv e-prints, p. arXiv:2105.12145
- Davé et al. (2002) Davé R., Katz N., Weinberg D. H., 2002, ApJ, 579, 23
- Davé et al. (2019) Davé R., Anglés-Alcázar D., Narayanan D., Li Q., Rafieferantsoa M. H., Appleby S., 2019, MNRAS, 486, 2827
- Dubois et al. (2014) Dubois Y., et al., 2014, MNRAS, 444, 1453
- Eisenreich et al. (2017) Eisenreich M., Naab T., Choi E., Ostriker J. P., Emsellem E., 2017, MNRAS, 468, 751
- Ettori et al. (2004) Ettori S., Tozzi P., Borgani S., Rosati P., 2004, A&A, 417, 13
- Fabian (2002) Fabian A. C., 2002, doi:10.1007/10856495_3, p. 24
- Fabian (2012) Fabian A. C., 2012, ARA&A, 50, 455
- Feng et al. (2016) Feng Y., Di-Matteo T., Croft R. A., Bird S., Battaglia N., Wilkins S., 2016, MNRAS, 455, 2778
- Genel et al. (2014) Genel S., et al., 2014, MNRAS, 445, 175
- Haardt & Madau (2012) Haardt F., Madau P., 2012, ApJ, 746, 125
- Heckman & Best (2014) Heckman T. M., Best P. N., 2014, ARA&A, 52, 589
- Henden et al. (2018) Henden N. A., Puchwein E., Shen S., Sijacki D., 2018, MNRAS, 479, 5385
- Hirschmann et al. (2014) Hirschmann M., Dolag K., Saro A., Bachmann L., Borgani S., Burkert A., 2014, MNRAS, 442, 2304
- Holden et al. (2002) Holden B. P., Stanford S. A., Squires G. K., Rosati P., Tozzi P., Eisenhardt P., Spinrad H., 2002, AJ, 124, 33
- Hopkins (2015) Hopkins P. F., 2015, MNRAS, 450, 53
- Hopkins & Quataert (2011) Hopkins P. F., Quataert E., 2011, MNRAS, 415, 1027
- Kaiser (1986) Kaiser N., 1986, MNRAS, 222, 323
- Kaviraj et al. (2017) Kaviraj S., et al., 2017, MNRAS, 467, 4739
- Khandai et al. (2015) Khandai N., Di Matteo T., Croft R., Wilkins S., Feng Y., Tucker E., DeGraf C., Liu M.-S., 2015, MNRAS, 450, 1349
- Krumholz & Gnedin (2011) Krumholz M. R., Gnedin N. Y., 2011, ApJ, 729, 36
- Maughan et al. (2006) Maughan B. J., Jones L. R., Ebeling H., Scharf C., 2006, MNRAS, 365, 509
- McNamara & Nulsen (2007) McNamara B. R., Nulsen P. E. J., 2007, ARA&A, 45, 117
- Narayan & Medvedev (2001) Narayan R., Medvedev M. V., 2001, ApJ, 562, L129
- Oppenheimer et al. (2012) Oppenheimer B. D., Davé R., Katz N., Kollmeier J. A., Weinberg D. H., 2012, MNRAS, 420, 829
- Perna et al. (2017) Perna M., Lanzuisi G., Brusa M., Cresci G., Mignoli M., 2017, A&A, 606, A96
- Planck Collaboration et al. (2016) Planck Collaboration et al., 2016, A&A, 594, A13
- Pratt et al. (2009) Pratt G. W., Croston J. H., Arnaud M., Böhringer H., 2009, A&A, 498, 361
- Reichert et al. (2011) Reichert A., Böhringer H., Fassbender R., Mühlegger M., 2011, A&A, 535, A4
- Robson & Davé (2020) Robson D., Davé R., 2020, MNRAS, 498, 3061
- Röttgers & Arth (2018) Röttgers B., Arth A., 2018, arXiv e-prints, p. arXiv:1803.03652
- Sasaki (2001) Sasaki S., 2001, PASJ, 53, 53
- Schaye et al. (2015) Schaye J., et al., 2015, MNRAS, 446, 521
- Somerville et al. (2008) Somerville R. S., Hopkins P. F., Cox T. J., Robertson B. E., Hernquist L., 2008, MNRAS, 391, 481
- Springel et al. (2018) Springel V., et al., 2018, MNRAS, 475, 676
- Sturm et al. (2011) Sturm E., et al., 2011, ApJ, 733, L16
- Thomas et al. (2019) Thomas N., Davé R., Anglés-Alcázar D., Jarvis M., 2019, MNRAS, 487, 5764
- Thompson (2015) Thompson R., 2015, SPHGR: Smoothed-Particle Hydrodynamics Galaxy Reduction (ascl:1502.012)
- Tremmel et al. (2017) Tremmel M., Karcher M., Governato F., Volonteri M., Quinn T. R., Pontzen A., Anderson L., Bellovary J., 2017, MNRAS, 470, 1121
- Vikhlinin et al. (2002) Vikhlinin A., van Speybroeck L., Markevitch M., Forman W. R., Grego L., 2002, ApJ, 578, L107
- Vikhlinin et al. (2009) Vikhlinin A., et al., 2009, ApJ, 692, 1033
- Vogelsberger et al. (2014) Vogelsberger M., et al., 2014, MNRAS, 444, 1518
- Volonteri et al. (2016) Volonteri M., Dubois Y., Pichon C., Devriendt J., 2016, MNRAS, 460, 2979