EVScout2.0: Electric Vehicle Profiling Through Charging Profile
Abstract
EVs (Electric Vehicles) represent a green alternative to traditional fuel-powered vehicles. To enforce their widespread use, both the technical development and the security of users shall be guaranteed. Privacy of users represents one of the possible threats impairing EVs adoption. In particular, recent works showed the feasibility of identifying EVs based on the current exchanged during the charging phase. In fact, while the resource negotiation phase runs over secure communication protocols, the signal exchanged during the actual charging contains features peculiar to each EV. A suitable feature extractor can hence associate such features to each EV, in what is commonly known as profiling.
In this paper, we propose EVScout2.0, an extended and improved version of our previously proposed framework to profile EVs based on their charging behavior. By exploiting the current and pilot signals exchanged during the charging phase, our scheme is able to extract features peculiar for each EV, allowing hence for their profiling. We implemented and tested EVScout2.0 over a set of real-world measurements considering over 7500 charging sessions from a total of 137 EVs. In particular, numerical results show the superiority of EVScout2.0 with respect to the previous version. EVScout2.0 can profile EVs, attaining a maximum of recall and precision. To the best of the authors’ knowledge, these results set a new benchmark for upcoming privacy research for large datasets of EVs.
I Introduction
EVs (Electric Vehicles) represent one of the technologies enabling a long-term solution for the mitigation of petroleum consumption and the consequent reduced emissions amount. Multiple countries already started providing financial incentives to facilitate the purchasing and widespread of EVs ownership [1]. The EV global forecast expects a compound annual growth rate of over the next ten years, with a total EV sales reaching up to million by [2]. Among the factors abating the adoption of EVs, consumers’ concerns regard the availability of charging infrastructures [2]. In fact, while gas stations are widely deployed both in cities and rural areas, EVSEs (Electric Vehicle Supply Equipments) are not deployed in a sufficient number or, in some areas, are not present at all. Although charging stations may be deployed at house premises, the absence of publicly available EVSEs represent a limit, as a user is forced to limit the traveling distance to stay close to a charging point. To mitigate this issue and increase the interest towards EVs, current recovery plans envisioned by countries such as Germany and China designate part of their funds to the development of EV charging infrastructures [2]. Furthermore, companies are equipping their parking spots with EVSEs to serve employees EVs. For instance, United States is incentivizing the adoption of EVSEs at companies’ parking spots via the workplace charging challenge [3]. Therefore, in the next years, we expect a significant increase in the number of publicly available EVSEs, allowing users to charge their EV at any time, removing availability concerns.
EVSEs enable the charging process by bringing together multiple technologies. On the one hand, they allow the user to exchange data with the grid, providing means for authorizations towards a central entity to negotiate the service and pay the associated fees. On the other hand, they allow for an exchange of information from the EV to the infrastructure, such that the charging process is conducted by providing safety towards EV’s components. The former communication process (i.e., user to infrastructure) is secured by means of cryptographic procedures as well as secure network protocols. Their use mitigates all the very well-known threats towards the users’ security and privacy given by unprotected communications. However, the latter communication process (i.e., EV to EVSE) is not secure, as signals are exchanged without encryption or aggregation techniques. The signals exchanged during the charging process can hence be exploited as a side-channel to extract information peculiar to each EV, allowing hence for their profiling and successive recognition [4]. This represents a threat towards users’ privacy, as the connection of their EV to an EVSE monitored by a malicious user may lead to tracking their movement as well as information regarding their driving behavior. Since the majority of publicly available EVSEs are deployed without proper physical protection, they can be accessed by anyone and represent hence favorable spots for attackers targeting the charging infrastructure [5]. Therefore, an attacker can easily install devices to collect data regarding the charging process.
In this paper, we propose EVScout2.0, a framework extending EVScout, the work proposed in [4], where we initially showed the feasibility of profiling EVs based on the current exchanged during the charging process. In particular, we extend the proposed framework by developing an enhanced feature extractor, which allows for higher classification scores compared to our previous work. We then exploit a novel TS (time series) for feature extraction, given by the combination of the current and pilots TSs. We will explain the reasoning behind this choice and provide the details on its computation. Furthermore, we consider a larger real-world dataset, comprising up to TSs of the current and pilot signals exchanged by each of the considered EVs, for a total of more than charging session. We perform a thorough evaluation of EVScout2.0, showing its profiling performance considering different training set sizes, as well as different unbalancing in the training-testing datasets. Compared to the work in [4], we provide a more comprehensive analysis of the performance of the attack. In particular, we first show the performance of the novel feature extractor and investigate the performance of EVScout2.0 for a varying number of features. We then compare the performance of the different classifiers that can be exploited by EVScout2.0. Compared to [4] we also extend the number of classifiers and provide an in-depth description of the choice of their hyper-parameters. We then investigate the dependencies of EVScout2.0 on the number of training TSs needed for classifying EVs with sufficient confidence. We show that the attack is already successful considering training examples. We then investigate the battery degradation over time and its impact on EVScout 2.0 performances. Lastly, we show the superiority of EVScout 2.0, comparing its performance with those in [4], both on the old and new datasets.
The contribution of this paper and its improvements with respect to [4] can hence be summarized as follows:
-
•
We propose an enhanced feature extraction framework, which allows for better classification performance compared to [4].
-
•
We propose the use of Delta TS, a novel TS given by the linear combination of the current and pilot TSs. Delta TS allows for the extraction of more significant features compared to those in [4].
-
•
We analyze the performance of EVScout2.0 on a large real-world dataset, comprising more than employable current and pilot time series from EVs. Compared to the dataset in [4], we consider both a larger number of TSs, as well as a larger number of EVs.
-
•
We perform a thorough evaluation of EVScout2.0, showing its performance over different training set sizes, as well as its robustness towards different unbalancing amounts in the training-testing dataset sizes.
-
•
Compared to [4], we analyze the performance of a higher number of classifiers and provide an in depth discussion on the choice of their hyper-parameters. We show that EVScout2.0 is able to profile EVs with precision and recall up to .
-
•
We investigate the battery degradation over time, and show that EVScout2.0 is able to extract features that allow for high classification scores (on average score) in time.
-
•
We compare EVScout2.0 with the framework in [4], showing its superiority both in the old and in the new datasets.
The rest of the paper is organized as follows. In Section II we review the related works. Then, in Section III we present the considered system and threat model in an EV charging infrastructure. In Section IV we describe the features and the steps of EVScout2.0. In Section V we describe the evaluation framework and the new dataset. Then, in Section VI we show the results achieved by EVScout2.0, while in Section VII we proposed some insight on additional analysis related to training set size and battery degradation. In Section VIII we provide a comparison between EVScout2.0 and its previous version EVScout [4], clearly presenting the advantages of the new approach. We discuss some countermeasures to avoid profiling in Section IX and, lastly, we sum up the results and draw the conclusions in Section X.
II Related Works
Power consumption can be exploited as a side-channel for different purposes [6]. For instance, an attacker may implement a laptop user recognition by exploiting the current drawn by a smart wall socket during users’ activity given [7]. The same concept can be exploited for detecting the presence of the user in a smart home, where raw data can be acquired and analyzed to detect for activity and hence users’ presence [8]. Raw power data also provides information regarding the actions a user is performing. For instance, by analyzing raw power data exchanged via a USB cable, an attacker may be able to infer the activity of a user on a smartphone [9] or to obtain information regarding the victim’s browsing activities [10]. The power exchanged during the charging process via USB can also leak more sensitive information, which an attacker can later exploit. For instance, the power analysis may leak information regarding digits composed on a touchscreen, allowing for the deduction of users’ passwords [11].
Regarding EVSEs, security and privacy research and contributions focus on the negotiation phase, as it allows the negotiation of the charging service by sharing personal user’s data. This includes both communications from the EVSE to the power distributor and from the EV to the EVSE. In the former communication scenario, the standards J1772 [12] and CHAdeMO [13] are exploited to regulate the physical standards needed for EV to EVSE connections, together with the signaling required for the charging process. These standards do not employ encryption or privacy measures on the exchanged information. In the latter case, the standard ISO 15118 [14] is exploited to create a secure communication link, implying that both EV and EVSE must be able to encrypt messages. The overall system has been analyzed in literature from a CPS (Cyber-Physical System) security point of view, and several threats have been identified [5, 15]. However, security and privacy analysis should also focus on the charging phase. In fact, the signals exchanged during the charging process create a time series that can be analyzed to extract features that lead to the profiling of vehicles [4]. However, an in-depth analysis of the robustness of these types of attacks is still missing. In particular, the feasibility of the attacks has been shown for a limited dataset, and the requirements of the attacker in terms of the number of samples needed for EV profiling has not been discussed yet.
III System and Threat Model
In this section we introduce the scenario on which we conceived our experiments. In particular, in Section III-A we recall the EV charging system, which represents our system model, then in Section III-B we present the threat model designed for EVScout2.0.
III-A EV Charging System
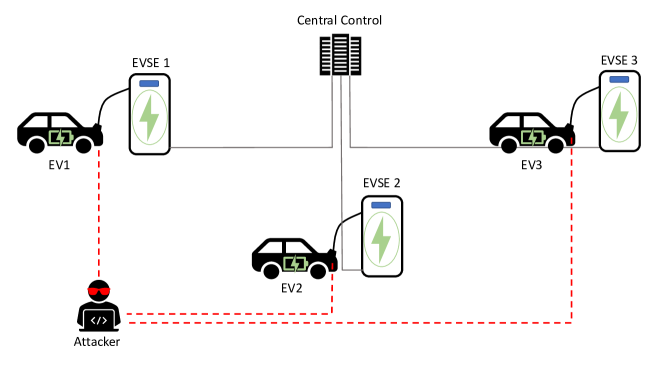
According to the Vehicle-To-Grid (V2G) paradigm [16], the charging infrastructure for EVs is a network where a central controller (power distributor) distributes power based on EVSEs demand while accounting for the maximum supported load by the electric grid. We depicted in Figure 1 the typical architecture of a V2G system. EVSEs in the network may be deployed at different sites, e.g., private customer premises, public stations, or office buildings. Each EV is both physically and logically connected to the grid via the EVSE, which manages communications between the user (i.e., the owner of the EV) and the power distributor. For public charging infrastructures and office stations, multiple EVSEs are connected to the power distributor through a Central Control that copes with the demand of a large number of connected users [5]. EVSEs are typically equipped with communication interfaces (wireless or wired) to allow communication with the user and the grid. Utilizing modules in the EV or smartphone, the user can communicate with the EVSE and, in turn, with the power supplier.
Current implementations of EVSEs are organized in three levels [15, 17]. Level and use a lead connector based on SAE J standard [18], where leads are connected to the grid via relays in the EVSE. The remaining pins, i.e., pilot and proximity lines, are used for signaling. The proximity line indicates whether a good physical connection has been established between the EV and the EVSE, blocking the initiation of the charging process in case devices are not properly attached and preventing hence damages to both the user and the involved devices. The pilot line provides a basic communication means between the EV and the EVSE. The combination of signals collected from all the pins is used to provide the main processing unit of the EVSE information regarding the charging process, allowing for metering used to assess the charging session state. If a problem arises at one of the two sides of the charging process, the EVSE computer hardware will remove power from the adapter to prevent injuries on both sides. Level EVSEs are instead more complex, comprising bigger pins for power delivery and allowing power line communications via the pilot line.
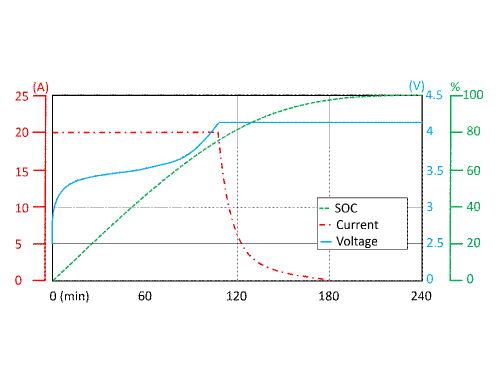
Typical batteries employed for EVs belong to the class of Li-ion (lithium-ion) [19, 20]. Current and voltage values exchanged during the charging process depend on the SoC (State of Charge) of the EV battery and can be divided into two classes: constant current/constant voltage and constant power/constant voltage [21]. In this work, we consider the first class, where the charging process can be further divided into two phases:
-
•
Constant current phase, where the current level is constant while the voltage value increases;
-
•
Constant voltage phase, where voltage is constant whereas current decreases.
The charging process starts with the constant current phase, and this operation mode is kept until the battery’s SoC is below a certain value. After reaching the SoC switching point, the operation mode switches to constant voltage up to the full charge. Typical SoC switching values lie between and of the full charge. An example of a charging profile for an EV’s Li-ion battery is shown in Figure 2. We here remark that constant current and constant voltage phases are mutually exclusive in time, as this will be exploited by EVScout2.0.
III-B Threat Model
We assume a threat model similar to ATM skimming, where the attacker is equipped with a small measuring device that can be connected on one side to the EVSE plug and the other side to the EV plug. This device is used to measure the exchanged current at the connection point between the EV and EVSE, and we assume that it is hard to be noticed by users. Moreover, we assume that the device provides information to the attacker via either i) a wireless communication module or ii) storing the values of interest to be lately collected by the attacker. The attacker has hence access to the TS of the signals exchanged between the EVSE and the EV during the charging phase. These values are hence recorded for each pin of the EV charger. In this paper, we assume that the attacker trains a different classifier for each target EV. Therefore, in order to properly train the classifier, a sufficient number of TSs shall be collected for every single EV. The attack is hence divided into i) collection phase, where the attacker collects data regarding a target EV, and ii) exploitation phase, where the attacker exploits the previously computed features to discriminate between different EVs based on the observed time series. To speed up the collection process, the attacker plugs a collector device in each EVSE, such that signals can be simultaneously recorded from multiple sessions. The target EV may be plugged to different EVSEs in successive charging sessions, e.g., in the parking spaces at workplaces or shopping malls the victim often visits. Therefore, by deploying multiple collecting devices at different EVSEs, the attacker has access to multiple charging sessions of the same EV and exploits them to build a training set for feature characterization and extraction. Due to the deployment of multiple measuring devices at different EVSEs, the collected data is generated from the charging sessions of multiple EVs. Therefore, the attacker is able to simultaneously build a training set for multiple EV.
Our threat model is based on the fact that the majority of publicly available EVSEs are deployed without proper physical security and hence can be accessed by any malicious actor [5]. In this case, since there is no access regulation to the EVSEs, the attacker can freely attach the measuring devices. The attack is further facilitated by the fact that typical users are not going to modify the charging system, even though they may notice something unfamiliar. Therefore, the attacker not only may be represented by the company running the EVSEs network, but can also be anyone interested in obtaining information on users’ consumes and locations. On the other hand, we notice that the EVSE devices can be routinely checked by the staff of the running company. Therefore, we argue that the most successful attacks may involve collusion in two different scenarios:
-
•
Collusion with the running company; the attacker agrees with the staff of the running company on a certain reward they may obtain, not reporting the problem to the central office and not detaching the measuring devices.
-
•
Collusion with the EVSE builders; the attacker agrees on a reward to the EVSE builders if measuring devices are natively built-in in the EVSE plug. This guarantees that the users or the staff of the running company are unable to notice and detach the measuring device.
To build a set with sufficient features, we assume that the attacker collects the TS of the exchanged current values and the TS of the pilot signals. Notice that, in order to retrieve this data, the attacker does not need to perform elaborate network intrusion schemes, as signals are exchanged outside the network. Furthermore, notice that the attacker is not modifying in any way the charging process. Hence, the system cannot automatically detect the attacker’s presence via intrusion/anomaly detection techniques.
Figure 1 shows the assumed system and threat model. In detail, multiple EVSEs communicate with the Central Control, which provides coordination information as well as power distribution. A single EV is connected to each EVSE. As previously mentioned, the attacker gets access to the time series of the physical quantities exchanged by multiple EVs during the charging phase and exploits them for profiling. Noticing that if the attacker can remotely access the current exchanged in different network nodes, it can also locate users, we see how profiling may also lead to user tracking. The knowledge of the physical signal features associated with each EV (and hence the owning user) can also be exploited for impersonation attacks. Considering EVSEs which are automated based on the specific user needs, an attacker could steal assets from a target user by generating a signal with the same physical features such that the EVSE recognizes the attacker as the victim. Scenarios in which this may harm the target user include billing and misbehaving users exclusion from the system. Therefore, the motivation behind the attack can be multiple. As an illustrative example, consider advertising: the attacker has both information on a certain user’s typical movements and the amount of energy he/she consumes regularly. This information can be sold to EVSE owners, which will target their advertisement to the profiled user according to its demand. Notice that, although a single classifier is trained for each EV, the attacker collects information regarding multiple EVs, such that more than a single classifier can be implemented with the gathered data. Therefore, the attacker can also sell information about collective use of the EVSE charging stations by EVs to EVSE companies. Although profiling can be implemented using cameras, this would not allow for collecting energy traces, therefore losing some of the information available with the proposed attack. Such information can be obtained utilizing EVScout2.0. The possibility of tracking a user gives a further threat. In fact, thanks to EVScout2.0, a malicious user can detect the presence of a target user in a certain place and time based on the fact that her EV is connected to a particular EVSE. Although an attacker may implement this attack through cameras, the envisioned device used to gather the data needed for EVScout2.0 is less noticeable and less detectable by the running company’s staff.
IV EVScout2.0
In this section we describe the EVScout2.0 analysis methodology. We propose a high-level description of the attack configuration in Section IV-A. Then we describe the preprocessing we apply to the dataset. Starting from Section IV-B, we present the concept of tails and outline the method we designed to extract them automatically. To improve the performance with respect to the solution in [4], we propose to exploit Delta TS, i.e., the TS given by the combination of the current and pilot TSs. In Section IV-C we present Delta TS, providing both the motivation behind our choice and the means to compute it. Lastly, in Section IV-D, we describe the novel and automatic feature extraction technique we employ in EVScout2.0.
IV-A Attack Description
As previously stated, in the context of EVs charging infrastructures, users’ data is authenticated and secured. However, physical signals are generally not supposed to implement security measures and therefore can easily be exploited by malicious users. Since the exchanged current during the charging phase is a user’s generated data, it comprises features and recurrent behaviors that can be exploited for profiling attacks. EVScout2.0 identifies and extracts those physical features which are representative of every single EV, such that we can assert with sufficient confidence if and when a specific user is connected to the charging grid.
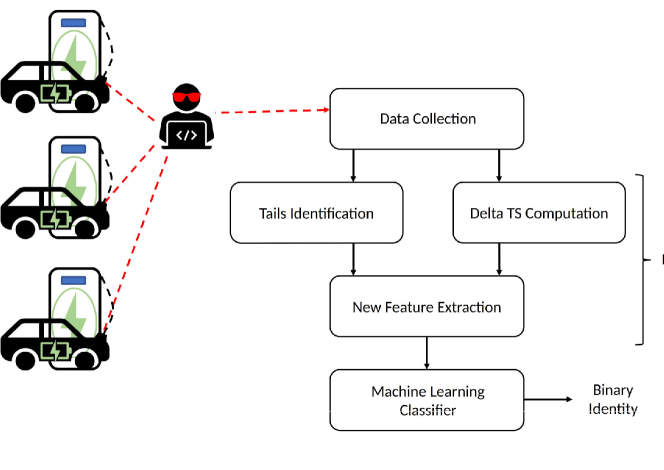
Figure 3 shows the block diagram of EVScout2.0’s steps. EVScout2.0 starts with data collection. To profile EVs the attacker must collect multiple charging sessions for each target EV. We will discuss this requirement in Section VII-A, assessing the number of training examples the attacker needs to collect to profile an EV with sufficient confidence. Once collected the charging TSs (i.e., the dataset), EVScout2.0 automatically computes the features that characterize each EV. To this aim, in the following, we propose a strategy to exploit the behavior of the batteries during the charging process. In particular, as proposed in EVScout [4], assuming that the attacker has access only to the ampere-based electrical quantities, we exploit the current behavior during the constant voltage phase. Leveraging the nomenclature in [23], we name the current TS during the constant voltage phase as tail. In Section IV-B we describe how EVScout2.0 extracts the tails.
Notice that the choice of exploiting tails is due to the assumption that the attacker has only access to the ampere-based TS. If the attacker has access to voltage values, the corresponding features can not be extracted from the tail, as the tail corresponds to the constant voltage phase. Therefore features extracted from voltage values during constant voltage may be under-representative of the battery’s behavior. If the attacker has access to both current and voltage TS, current features can be extracted from tails, whereas voltage features can be extracted during the constant current phase.
By noticing that each battery follows the current limits imposed by the pilot differently, we generate a further TS to be exploited to extract more features. Together with the tail, in EVScout2.0 we exploit the Delta TS, i.e., the TS given by the punctual difference between the current TS and the pilot TS during the constant current phase. Delta TS hence includes all the data from the beginning of the TS up to the beginning of the tail. We believe that this derived TS uniquely characterizes the behavior of each specific EV as we will explain in Section IV-C.
IV-B Tail Identification
Charging sessions are not necessarily comprehensive of the constant voltage phase, as a user may need to leave before the full charge is reached. In [23] the authors presented a framework to cluster similar charging behavior basing on the charging tail. We exploit this portion of the TS to perform more detailed profiling. Since EVScout2.0 exploits the tails during the constant voltage phase, we exploit the algorithm we proposed in [4] to identify whether the considered session includes a constant voltage phase. The presence of a tail implies that the session terminates with full SoC, and eventually zero-current exchanged between EV and EVSE. Tails, however, can not be uniquely identified by the presence of zeros in the current TS, as this may be due to idle phases during the power scheduling process at the grid side. Furthermore, scheduling may cause shot noise in the TS also after full SoC, leading to spikes in the TS. Therefore, we designed a suitable tail reconnaissance algorithm.
To mitigate the aforementioned effects of scheduling and to highlight the trends in the considered TS, we propose to apply a suitable filter. In particular, we filter both the current TS and the pilot TS with a length moving average filter. Given time instant and denoting the electric current value at time as , the output value of the moving average filter at time is given by
| (1) |
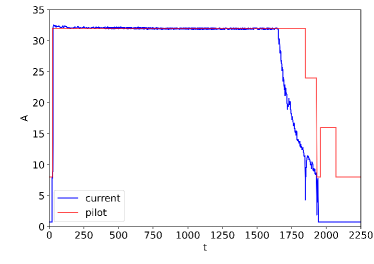
The effects of the moving average filter are shown in Figure 4. We see that, with respect to the non-filtered current TS in Figure 4(a), the current TS in Figure 4(b) has a smoother behavior as the filter removes most of the noise and scheduling artifacts. Notice that different filter implementations can be considered, e.g., low pass filter. However, a low pass filter requires a more accurate design, and it also leads to ringing effects, which may be misleading for trend, and hence tail identification.
If the filter has a sufficient length, its effects also include spikes removal. This eases the identification of tails in the TS, as we can rely on the presence of steady zero values when the full charge is reached. In detail, if the current TS assumes zero values from up to its end, then we can assume that full SoC has been reached. Tails are characterized by a descending trend in the TS, as shown from the current behavior during the constant voltage phase in Figure 2 and verified in Figure 4. By forward analysis of the current TS, it is difficult to identify the time instant corresponding to the beginning of the tail, as this would imply the analysis of the overall TS. Therefore, we propose to proceed backward from the point where full SoC is obtained. Proceeding from backward, we identify the tail by accounting for the number of samples in the current TS reporting an ascending trend. Notice that, even though scheduling and noise could affect the trend of the TS, its effects are mitigated by the moving average filter (see Figure 4(b)). A perfectly backward-ascending trend is given by a negative difference between the values at time and , i.e., . However, we notice that tails do not always exhibit a perfectly backward-ascending trend. In fact, if the non-filtered TS is affected by heavy noise, its effects are still visible after filtering. Therefore, we relax the concept of perfect backward-ascending trend including samples for which , with being a small positive value. Furthermore, we also allow for short descending trends by accounting for consecutive segments for which . If this is the case for consecutive samples, the trend is considered fully descending and hence discarded.

The steps of the tail extraction algorithm are shown in Algorithm 1. We denote as the set of EV indexes. Notice that each current TS is associated with a unique pilot TS. We denote as and the sets of the current and pilot TS associated with ID , respectively. We assume that the two sets are ordered such that the current and pilot TS associated to a certain charging session are associated with the same index in the two sets. Therefore, we define set , whose elements are the couples of current and pilot time series respectively taken from sets and . For each TS , we compute the filtered current and pilot TS, respectively denoted as and , and we search for the steady zero values instant . If is found, we proceed by identifying the number of samples of the tail. Given our definition of backward ascending trend, we compute the number of samples for which . As short descending trends are also allowed, we account for the number of consecutive descending samples, and if it exceeds we stop the counter. However, if an ascending segment is found after a descending samples series, the counter is reset. Given the number of tail’s samples, the tail is obtained from the filtered current TS, starting from up to . The tail associated to the pilot TS is analogously obtained, starting from up to . Both current and pilot TS are eventually added respectively to the set and of current and pilot TS tails associated with EV ID .
IV-C Delta TS computation
Aside from current tails, we compute another TS to be used for extracting features for the classifiers. Since different batteries’ charging sessions have different charging parameters, the maximum current which can be absorbed is variable. Furthermore, pushed by advanced charging algorithms [24], during some periods, the EV can be forced into charging at a lower current, e.g., to deal with peak leveling during busy hours. However, as visible in Figure 4, generally, the battery does not charge at the exact amount of energy expected from the pilot signal. Furthermore, the absorbed current often exhibits some small variations around the maximum current deliverable by the charging column. This is particularly true when considering the behavior of the two TS is the time preceding the tail. In order to capture these changes, we compute Delta TS, i.e., the TS given by the combination of the current TS and the control pilot TS during the constant current phase (i.e., the period preceding the tail).
To compute Delta TS, we calculate the difference between the current and pilot TSs at each time instant during the constant current phase. While the pilot TS generally is not affected by noise, the current TS instead exhibits some tiny positive and negative spikes, as shown in Figure 4(a). While the tails generally follow a decreasing trend, the values assumed by the TSs before the tail (i.e., the ones used to compute the Delta TS) are generally more constant. Since the moving median filter provides better performance in removing noise and spikes when the data in the neighborhood of the peak are quite constant [25], we use it instead of the moving average filter used in Section IV-B.
Given time instant , we denote the electric current value at as and the correspondent pilot value as . The resulting point at time in the Delta TS can be expressed as:
| (2) |
where represents the array of values of the TS from to , is the filter length, and is the median value of array (i.e., the middle value separating the grater and lower halves of ).
IV-D Improved Feature Extraction
Segmentation represents a classical approach for feature extraction in TSs [26, 27, 7]. Unfortunately, since the TSs we consider here are generally short with no stationary components, segmentation is not a viable solution. Therefore, we do not further process tails before extracting features. In our previous work [4], we computed mean, mode, median, max value, standard deviation, auto-correlation, length of the tail, and the slope of the linear approximation for each tail. Furthermore, we used as a feature the total kW delivered and the overall session time duration, leading to a total of features considering both pilot and current TSs independently. Instead, in this work, we adopted a more sophisticated feature extraction process that can extract several more features.
We analyze different widely used feature extraction tools which can automatically extract features from a given TS [28, 29, 26]. We use Time Series Feature Extraction based on Scalable Hypothesis tests (tsfresh) [30], which is available as a Python package easily integrable with other tools such as Scikit-learn [31]. tsfresh exploits the power of TSs characterization methods to extract hundreds of features from a TS. Moreover, it contains functions to slightly reduce the number of features to remove the less meaningful ones. We use tsfresh to extract features from the current tails and the delta current-pilot TSs. It is worth mentioning that, with respect to the previous work [4], we decided not to employ features extracted from the tails of the control pilot TS since the pilot tail is generally based on the optimization algorithm [24] and not on the behavior of the battery. For example, even if the battery has reached its maximum SoC, the control pilot could remain at a high value if the grid has energy available. In the same way, if many vehicles start requesting energy, the control pilot will reduce its value independently of the SoC of our target EV. Furthermore, we removed the needs on the duration of the charge and the total energy absorbed by the battery (kW) since they can depend on the user behavior and the SoC of the battery at the beginning of the charging process.
Since tsfresh can generate around features for each TS, we removed those that are not relevant for our classification problem. To reduce the number of features, hereinafter denoted as , we select the most significant ones by using SelectKBest of Scikit-learn [31] with the chi2 function, which is suitable for classification purposes. Since the chi-squared measures the dependence between stochastic variables, we can highlight and then select only the features that offer more information for the classification. We employ this strategy with respect to other more complex methods such as Random Forest feature reduction since SelectKBest can achieve approximately the same results with lower computational complexity.
V Evaluation Framework Description
In the following, we present the experiments we use to test EVScout2.0. In particular, in Section V-A and Section V-B we describe respectively the ACN Infrastructure and Dataset on which we based our analysis. We then explain how the new version of the dataset differs from the one in the previous work. Then, in Section V-C we outline the machine learning classifiers we use to profile EVs.
V-A The ACN Infrastructure and Dataset
In order to test EVScout2.0, we exploit the ACN (Adaptive Charging Network) proposed in [24]. It consists of level EVSEs connected with a central controller that regulates power exchanges in the grid. Employing an online optimization framework, the ACN allows adapting the power exchanged in the grid, satisfying users’ power demand while coping with the grid’s capacity limits. The dataset comprises charging sessions from actually deployed ACNs, each reporting user-specific measurements such as the arrival and departure time, the kw/h delivered, current and pilot TSs collected between the EV connection and disconnection time. Notice that, although the user may have planned for a full recharge during the selected period, this may not be reflected in the TS. In fact, due to the variable number of connected EVs, the upper power limit of the grid, and the premature departure of the user, the battery may not be fully charged at disconnection time. Notice also that, in the ACN dataset, not all TS are sampled with the same period. However, we avoid upsampling with the filtering because it can introduce statistical features that are not representative of the analyzed battery. Each user in the dataset is identified by a unique ID, which is associated with the owned EV.
V-B New Dataset
Like in our previous work [4], we decided to use the ACN dataset. However, since the dataset was recently enlarged, we expanded the number of EVs considered from to . To generate the dataset, we selected all the available EVs up to June 18, 2021, from the caltech site (one of the three locations available in the dataset). We also excluded by default EVs without charges and charges without any EV assigned (i.e., anonymous charges). To download the dataset, we employ the Python APIs provided by the ACN Dataset [24]. The number of charges associated with each EV ranges from one to over . However, not all the charges contain a tail to be analyzed. We therefore remove the corresponding TSs and hence EVs. We consider all the EVs with more than employable charging processes associated. We made this choice to be able to effectively use cross-validation even for those EVs with a small number of charges. After this cleanup, EVs remains in the dataset, resulting in a dataset more than six times bigger than the one used to test EVScout in [4].
V-C Classification Algorithms Comparison
The first step of EVScout2.0 is to build a suitable dataset to be exploited for profiling, as explained in Section V-B. It is worth mentioning that the dataset does not provide any information regarding the make and model of the analyzed EVs. Since the energy behavior highly depends on the chemical reactions of the single battery, we think that EVScout2.0 could be able to distinguish EVs of the same model. Furthermore, the batteries employed by the analyzed EVs all belong to the same class, i.e., constant current/constant voltage. However, since both classes discussed in Section III show particular behaviors in time, we believe that our attack could be easily extended to the constant power/constant voltage class. The effectiveness of EVScout2.0 in these cases will be investigated in future works.
For each session, EVScout2.0 first identifies whether a tail is present and discards all the other sessions. Then it builds a feature vector for each tail, associating it with the ID of its corresponding EV. We test EVScout2.0 across all EVs in the dataset by averaging the performance obtained with every single classifier. In particular, we implement a binary classifier for each EV, and we associate each feature vector of the target EV with label , otherwise with label . The overall performance of the obtained classifiers is averaged considering randomly created training and testing sets, except RF (Random Forest) and ADA (ADA Boost) classifiers for which, for timing reasons, we consider iterations. The overall performances of EVScout2.0 are obtained by averaging the results obtained for each ID’s classifier.
Let us denote as the ratio between the number of feature vectors associated with the target EV and the number of feature vectors associated with other EVs. Hence, measures the amount of unbalancing in the considered dataset. In order to further assess the performance of EVScout2.0, each classifier is tested for multiple values. Regardless of the value , the of the dataset has been used for training and the remaining for testing, unless otherwise specified. As the number of feature vectors of a single EV is smaller than the overall number of feature vectors, when considering small values, the set of feature vectors associated with other EVs is randomly created from the overall set. Another value that can lead to different results is the number of features employed in the classification. Since our feature extraction strategy returns about features, using them all can lead to overfitting. We show in the next sections how different values affect the classification performance and provide a justification for the choice of a suitable value that provides a good threshold to balance classification performance and overfitting.
VI EVScout2.0 Performance: Vehicle Profiling
We first assess the performance of EVScout2.0 in terms of profiling every vehicle based on its charging behavior. To this aim, we leveraged and compared different common machine learning algorithms for classification. We describe in Section VI-A the exploited classifiers and provide a discussion on their hyper-parameters setting. Then, in Section VI-B, we present the results obtained via EVScout2.0 with the different classifiers.
VI-A Classification Algorithms
Once features have been identified and selected, EVScout2.0 feeds them to a binary machine learning classifier. The profiling task can be formulated as a supervised classification problem, where a two-class classifier is trained with both features from the target EV and features from all other EVs. In particular, we assume that a classifier whose input is the features vector from the target EV shall return output value , otherwise it shall return output value .
We evaluate our pipeline by using and comparing six different common machine learning models, namely:
Hyper-parameters optimization is obtained via grid search with cross-validation. Table I indicates the different parameters employed in the grid search for each model. The training set is suitably divided into training and validation sets, which we test on a grid of possible hyper-parameters. Notice that all six classifiers are standard machine learning algorithms without deep architectures. Although deep learning automates the feature extraction process, a large number of samples shall be used to train deep architectures effectively. The use of non-deep structures allows us to show the feasibility of EVScout2.0 over our currently available dataset. The same motivation resides behind the choice of binary classifiers. In fact, a single multi-class classifier can be designed to have a single class for each EV. However, multi-class classifiers require a larger dataset for training purposes compared to binary classifiers. Although we consider a larger dataset with respect to our previous work [4], it is not big enough to provide interesting results with deep models or a multi-class scenario.
| Model | Parameter | Values |
| SVM | kernel | [‘rbf’] |
| regularization (c) | ||
| gamma () | ||
| kNN | n_neighbors | |
| weights | [‘uniform’, ‘distance’] | |
| metric | [‘euclidean’, ‘manhattan’] | |
| DT | criterion | [‘gini’, ‘entropy’] |
| max_depth | ||
| LR | max_iter | |
| regularization (c) | ||
| RF | n_estimators | |
| max_depth | ||
| ADA | n_estimators |
VI-B Profiling Results
We exploit the implementation of the classification algorithms in [31]. Results are assessed in terms of precision , recall , and . We present numerical results assessing the validity of EVScout2.0 as a function of , the amount of unbalancing in the dataset. Since traditional performance measures such as may be misleading when considering highly unbalanced datasets, the geometric mean (G-Mean) between recall and specificity has been proposed as a suitable performance metric [38]. Therefore, we consider G-Mean as a proper indicator of the validity of EVScout2.0 for large values. By denoting as , , and respectively the number of true positive, true negative, false-positive and false-negative outcomes, we can express the recall as , and specificity as . G-Mean is hence obtained as .
Since the tail extraction process is automated, the number of extracted tails also depends on the parameter values. Basing on our previous work [4], we set (i.e., the size of the moving average filter) to , which was the best value in terms of classification scores. We used the same value for the median filter to maintain coherence in the TSs since, albeit the necessary differences, the two filters are quite similar.
We employed the implemented versions of the classifiers provided by the Scikit-Learn Python library [31]. For each model, we employed a GridSearchCV to tune the model using grid search with cross-validation. In the following, we present an analysis of the results with respect to different parameters and values.
VI-B1 Number of Features NoF
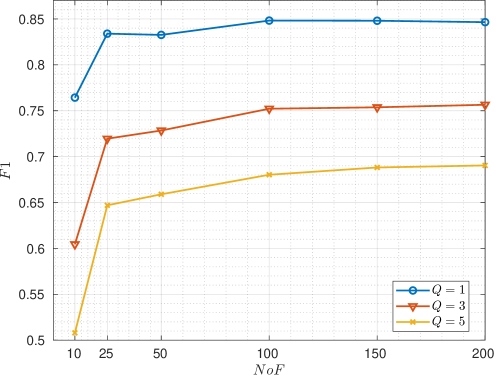
Firstly, we provide an analysis of the scores based on the number of features maintained after the feature extraction phase. In Figure 5 we plot the scores for different ratios using the same model (kNN (k-Nearest Neighbors)) but varying the numbers of features from to . We can see a significant increase in the score going from to features, especially for higher ratios . From features up, the increase is instead negligible. For this reason, we selected for the other experiments in this paper, unless otherwise specified.
VI-B2 Unbalance of the Dataset Q
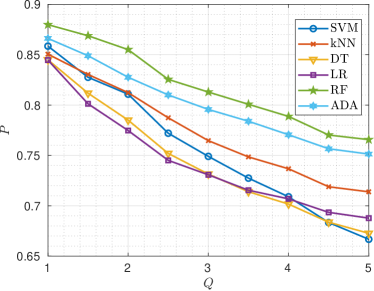
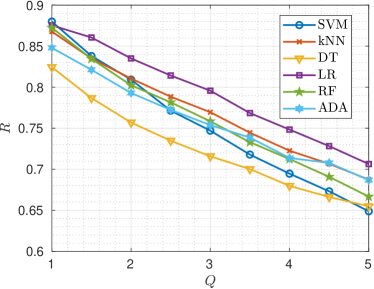
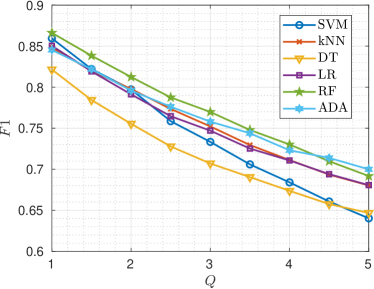
To understand how our models deal with the unbalance of the dataset (i.e., the ratio between the number of feature vectors associated with the target EV and the number of feature vectors associated with other EVs), we test all the six models against different values of . We test values ranging from (i.e., the same number of feature vectors for target and for the other EVs) to (i.e., five times more features vectors not related to the target EV).
Figure 6 shows the results obtained by EVScout2.0 for different values. It is possible to notice how all the scores decrease with for all six models. As the number of considered EVs increases with , the chance of two users having the same EV model or having EVs with similar charging profiles increases. This is reflected in a worsening of classifiers’ performance. With no unbalancing (i.e., ), we reach the highest precision of with the RF classifier. On the other hand, almost all the classifiers reached at least in recall, with the exception of DT (Decision Tree) which has the lower performances almost for every indicator. We notice that the RF classifier is the most resistant to changes in if we look at the precision, while LR (Logistic Regression) offers the best recall scores. If instead we look at both the scores, even if the absolute values are generally lower, kNN and ADA seem to be the most resistant to higher . Furthermore, we can observe that for the maximum , precision and recall are respectively (with RF) and (with LR), meaning that EVs can still be profiled with sufficient confidence.
As for the other scores, also degrades for increasing values of for all the models. We can see that RF is the best one for almost all the ratios , while for the highest two (i.e., and ) ADA performed slightly better. However, this is not the case in terms of G-Mean, confirming its validity for unbalanced datasets. In particular, ADA presents a large variance in terms of G-Mean, a sign that is not a suitable algorithm for highly unbalanced datasets. Other algorithms, such as RF, kNN, and LR are instead able to maintain high values of G-Mean for every value of . This shows that profiling can be achieved with good results irrespective of the amount of unbalancing in the dataset, i.e., a single user can still be profiled based on its charging profile also in largely populated networks.
However, all this consideration must be taken into account when designing EVScout2.0. If the dataset distribution is known, the best algorithm for each case can be selected. In particular, RF is advisable for perfectly balanced datasets, LR for highly unbalanced datasets. Instead, if the dataset is unknown and a resilient model is needed, kNN can be a good choice. In fact, we employed kNN in many experiments hereinafter, also thanks to its fast training time with respect to other models such as RF or ADA.
VII EVScout2.0 Performance: Additional Performance Analysis
In addition to the classification-based analyses, we included additional scenarios based on the training set characteristics. Since the data conditions may be different in a real-world scenario, in the following, we propose an analysis taking into consideration different data properties. In particular, in Section VII-A we examine different training set size values to assess the minimum number of charges needed to obtain sufficiently high classification scores. In fact, in a real-world attack, a large number of labeled traces may be challenging to obtain. In Section VII-B, we investigate if and how much the degradation of the Li-ion battery has an impact on the performance of EVScout2.0. This analysis can be useful to understand how a model can still be precise when dealing with natural phenomena like physical battery degradation.
VII-A Training Size Variation
In a real-world scenario, an attacker may be limited by the number of labeled charges she is able to get for a target vehicle. For instance, the attacker may not want to leave its malicious device in the field too much to reduce the possibility of being detected. To simulate this scenario, we analyze the performance of EVScout2.0 while varying the train set size. We avoid using as target EVs with less than charges with tails, while to create the group with the others EVs we employed the whole dataset. As a testing set, we always use the last of the available charges. For the training set, we set fixed values from the to the of the min number of charges for each EV (i.e., ). In other words, the training set size ranges from to feature vectors for each EV, with steps of charges.
In Figure 7(a) we can see how the decreases while decreasing the training set size. However, we can appreciate a significant fall only for the smallest values of the training set, while for training set sizes bigger than charges the increase is less relevant. Over charges, the performance increase is almost negligible, especially considering the smaller ratios. We can also look at the absolute values of the . It is greater than also for the most unbalanced dataset when using feature vectors, showing discrete classification performance also with small training sets.
Furthermore, we also analyzed the impact of both training set reduction and features reduction. In Figure 7(b) we see the different behavior of the score while varying the number of features and the training set size (we show the data only for for clarity). As expected, there is a clear drop in the performances for the lower training set sizes. However, this can be partially compensated by employing a bigger number of features up to . Over this threshold, the gain is negligible, coherently with what is presented in Section VI-B and Figure 5.
VII-B Battery Degradation Performance
The degradation of a Li-ion battery used in an EV is a topic widely discussed in literature [39]. During a battery life, many aspects can adversely affect its performance depending on the number of charge cycles, aging, operating, and storing conditions. Degradation on EV batteries can lead to a shorter traveling distance and a reduced battery’s available power output [40]. Generally, a battery is considered to be at the end of life when it already lost of its initial capacity. Modern Li-ion batteries should have a five to ten-year calendar life depending on the materials and how they are managed. They should be able to supply between and cycles of charge. However, many behaviors such as keeping the battery at a high SoC or high temperature, or often employing fast chargers, can reduce even more the lifetime of the battery [41, 40].
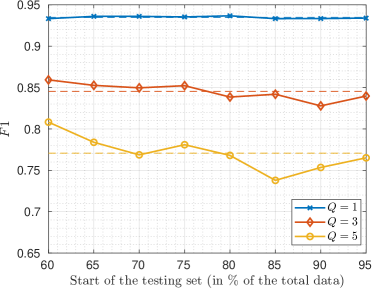
Being aware of this problem, we investigate if the battery degradation affects our profiling model. Since the charge profile of an EV will always be different due to the variation of the physical properties of the battery, we analyzed how the extracted features degrade the performance of EVScout2.0 in time. To test how our model behaves in this context, we selected the EVs with the higher number of charges (i.e., more than charges for each EV) spanning about two years. We train the kNN classifier in the first part of the data, and we then test it over multiple consecutive test set batches. In particular, the training set accounts for the TS measured in a specific period and represents the baseline to measure the successive battery degradation. Each testing set is given by batches of chronologically consecutive TSs, with of the total available testing data. In other words, we considered as each test set a sliding time window of consecutive TSs.
Initially, we train employing only the first of the data for each EV. These results are shown in Figure 8(a) where it is possible to see a small difference in scores while shifting the testing set. However, we cannot blame the physical battery degradation for these results for a series of motivations. Firstly, the reduction is not really important in absolute terms (i.e., less than for ) and can be due to different behaviors of the users in different periods (e.g., detaching the EV before full SoC). Secondly, it is not the monotonous decrease that we would have expected. Instead, the scores seem not to follow any pattern, showing good classification results also in the last steps (i.e., testing set given by more recent TSs). Third, the small size of the training set employed can be a partial motivation for the random behavior of the scores.
In order to remove the train set size as a variable to create strange behavior in the results, we perform a second train using the of the data. By doing so, we obtain a chart with fewer points, as shown in Figure 8(b). In this case, scores are almost constants with tiny variations which are expected in the context.
This demonstrates how EVScout2.0 is able to perform well also considering a time distance of almost two years between the training and the testing data. Although not affected by the small battery degradation that could happen in this time frame, it could still be affected by unusual and unpredictable behaviors of the EVs owners or by the ACN scheduling algorithm, especially when considering highly unbalanced datasets and a small training set. Furthermore, this experiment can be seen as a remark on the need for a big training set as presented in Section VII-A. We will provide more analysis on the degradation as future work, considering datasets that span on more than two years.
VIII EVScout2.0 Performance: Comparison with EVScout
In our previous work [4] we performed experiments similar to those discussed in previous sections but employing a different pipeline, a different feature extraction process, and a smaller dataset composed of only EVs. Since it was one of the first works on the privacy of the EV charging systems, we use the results [4] as a comparison baseline. In particular, we propose two different comparisons: one using EVScout on the new and extended dataset, and one using EVScout2.0 on the dataset employed in [4]. It is worth mentioning that we employed the same dataset used in [4] and not simply the same EVs updated with the new charges.
VIII-A EVScout on the new dataset
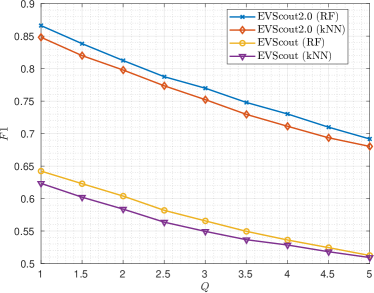
We tested EVScout [4] in our new dataset. To generate results comparable with those presented in this paper for EVScout2.0, we employed the same dataset with valid EVs, even if EV with less than eight charges could also be used in EVScout. We performed the same pre-processing phases, and we assess the performance for . Results are shown in Figure 9(a) for different values of . We can see a clear dominance of EVScout2.0 with respect to its previous version in the new dataset composed by EVs. The difference in the classification performance ranges from about for to more than for .
VIII-B EVScout2.0 on the previous dataset
Furthermore, we test our new algorithm EVScout2.0 on the same dataset employed for the testing of EVScout. Since EVScout2.0 needs at least charging session comprising tails for each EV, we have to discard four EVs, resulting in a total of EVs. We show the results of this experiment in Figure 9(b). Even if the enhancement is less pronounced with respect to the new dataset scenario, we can see a clear improvement in the performance of EVScout2.0 with respect to its previous version, especially considering high unbalancing .

IX Possible Countermeasures
In order to deal with information leakage from smart meters, [42] proposes to obfuscate the communication between user and supplier through rechargeable batteries. This solution is effective in modifying the demand-response correlation in the measured data. This approach can be leveraged to mitigate the effects of EVScout2.0, where the EV’s battery drains current from a secondary battery which communicates with the EVSE, masquerading the original battery’s tail behavior. However, this approach incurs a higher implementation cost at both EV and EVSE sides, as the number of involved batteries doubles. Furthermore, the attacker may be able to extract features from the secondary battery and hence still be able to perform profiling. A similar concept is exploited in [43], where noise is added to smart meters data via an adversarial learning framework. This idea can be exploited to mitigate the effects of EVScout2.0, by adding a suitable amount of noise to the current required by the EV’s battery during the tail phase. However, this would imply redesigning how EVSEs manage the current required by EVs, as the added noise may mislead both the attacker and the EVSE. The risk is, therefore, that the recharging process’s efficiency drops. Other non-technical countermeasures are also possible. For instance, EV owners can be educated to check the presence of suspicious devices attached to the EVSE. Furthermore, running companies should often inspect their equipment for illegitimate devices and install closed-circuit TV to detect the presence of such devices. Different solutions can hence be adopted to prevent user profiling. However, research should design proper countermeasures to ease the spreading of privacy-preserving EVs and EVSEs.
X Conclusions
EVs security is a novel topic that is rising many novel challenges in the protection of such systems. As we demonstrated, introducing a charging system that utilizes personal information can lead to privacy leakage and profiling attacks. In this paper, we extended our previous work proposing EVScout2.0. In particular, we extended the work in [4] by employing a bigger dataset, a novel feature extraction technique, and compared more algorithms for the classification task. We also show how real-world constraints such as limited training test size and battery degradation over time impact the classification quality. With respect to the previous work, we employed a bigger dataset going from to EVs. We employed six different models capable of reaching precision and recall of for the unbalanced datasets, while still offering good results (precision , recall ) with high unbalanced datasets. Furthermore, we evaluate the performance loss generated by a training set size reduction, showing how EVScout2.0 can reach good performances even with a small training set. In addition, we assess that the proposed algorithm is capable of correctly identifying EVs even if the model is trained with data two years early. Finally, we showed that EVScout2.0 is capable of attaining good classification performance, even in challenging scenarios such as highly imbalanced datasets or small training set, proving to be a viable and effective solution for EV profiling.
References
- [1] N. Wang, L. Tang, and H. Pan, “A global comparison and assessment of incentive policy on electric vehicle promotion,” Sustainable Cities and Society, vol. 44, pp. 597–603, 2019.
- [2] Deloitte, “Electric vehicles: setting a course for 2030,” in https://www2.deloitte.com/us/en/insights/focus/future-of-mobility/electric-vehicle-trends-2030.html, Jul. 2020.
- [3] U.S.D.O.E., “EV everywhere grand challenge: Road to success,” U. S. Department of Energy, Tech. Rep., Jan. 2014.
- [4] A. Brighente, M. Conti, and I. Sadaf, “Tell me how you re-charge, i will tell you where you drove to: Electric vehicles profiling based on charging-current demand,” Accepted for publication in Proc. of 26th European Symposium on Research in Computer Security (ESORICS) 2021, 2021.
- [5] J. Antoun, M. E. Kabir, B. Moussa, R. Atallah, and C. Assi, “A detailed security assessment of the EV charging ecosystem,” IEEE Network, Feb. 2020.
- [6] H. Liu, R. Spolaor, F. Turrin, R. Bonafede, and M. Conti, “Usb powered devices: A survey of side-channel threats and countermeasures,” High-Confidence Computing, p. 100007, 2021. [Online]. Available: https://www.sciencedirect.com/science/article/pii/S2667295221000088
- [7] M. Conti, M. Nati, E. Rotundo, and R. Spolaor, “Mind the plug! laptop-user recognition through power consumption,” in Proceedings of the 2nd ACM International Workshop on IoT Privacy, Trust, and Security, 2016, pp. 37–44.
- [8] A. Molina-Markham, P. Shenoy, K. Fu, E. Cecchet, and D. Irwin, “Private memoirs of a smart meter,” in Proceedings of the 2nd ACM workshop on embedded sensing systems for energy-efficiency in building, Nov. 2010, pp. 61–66.
- [9] R. Spolaor, L. Abudahi, V. Moonsamy, M. Conti, and R. Poovendran, “No free charge theorem: A covert channel via usb charging cable on mobile devices,” in International Conference on Applied Cryptography and Network Security. Springer, Jul. 2017, pp. 83–102.
- [10] Q. Yang, P. Gasti, G. Zhou, A. Farajidavar, and K. S. Balagani, “On inferring browsing activity on smartphones via usb power analysis side-channel,” IEEE Transactions on Information Forensics and Security, vol. 12, no. 5, pp. 1056–1066, Dec. 2016.
- [11] P. Cronin, X. Gao, C. Yang, and H. Wang, “Charger-surfing: Exploiting a power line side-channel for smartphone information leakage,” in 30th USENIX Security Symposium (USENIX Security 21), 2021.
- [12] S. Std, “J1772,” Sae electric vehicle conductive charge coupler, 2001.
- [13] T. Anegawa, “Characteristics of chademo quick charging system,” World Electric Vehicle Journal, vol. 4, no. 4, pp. 818–822, 2010.
- [14] M. Mültin, “Iso 15118 as the enabler of vehicle-to-grid applications,” in 2018 International Conference of Electrical and Electronic Technologies for Automotive. IEEE, 2018, pp. 1–6.
- [15] R. Gottumukkala, R. Merchant, A. Tauzin, K. Leon, A. Roche, and P. Darby, “Cyber-physical system security of vehicle charging stations,” in Proc. of IEEE Green Technologies Conference (GreenTech), Apr. 2019, pp. 1–5.
- [16] W. Kempton, J. Tomic, and S. Letendre, “Vehicle-to-Grid Power: Battery, Hybrid, and Fuel Cell Vehicles as Resources for Distributed Electric Power in California,” IEEE Transactions on Smart Grid, 2001. [Online]. Available: https://cloudfront.escholarship.org/dist/prd/content/qt0qp6s4mb/qt0qp6s4mb.pdf
- [17] L. Wang, Z. Qin, T. Slangen, P. Bauer, and T. Van Wijk, “Grid impact of electric vehicle fast charging stations: Trends, standards, issues and mitigation measures-an overview,” IEEE Open Journal of Power Electronics, 2021.
- [18] C. Troepfer, “SAE electric vehicle conductive charge coupler, SAE J1772,” Society of Automotive Engineers, Tech. Rep., 2009.
- [19] Y.-s. Bai and C.-n. Zhang, “Experiments study on fast charge technology for lithium-ion electric vehicle batteries,” in 2014 IEEE Conference and Expo Transportation Electrification Asia-Pacific (ITEC Asia-Pacific). IEEE, 2014, pp. 1–6.
- [20] H. Wu, G. K. H. Pang, K. L. Choy, and H. Y. Lam, “An optimization model for electric vehicle battery charging at a battery swapping station,” IEEE Transactions on Vehicular Technology, vol. 67, no. 2, pp. 881–895, 2017.
- [21] F. Marra, G. Y. Yang, C. Træholt, E. Larsen, C. N. Rasmussen, and S. You, “Demand profile study of battery electric vehicle under different charging options,” in 2012 IEEE Power and Energy Society General Meeting. IEEE, Nov. 2012, pp. 1–7.
- [22] ThunderSky, “Instruction manual for LFP/LCP/LMP lithium power battery,” Thunder Sky, Tech. Rep., 2007.
- [23] C. Sun, T. Li, S. H. Low, and V. O. Li, “Classification of electric vehicle charging time series with selective clustering,” Electric Power Systems Research, vol. 189, p. 106695, Dec. 2020.
- [24] Z. J. Lee, T. Li, and S. H. Low, “ACN-Data: Analysis and applications of an open EV charging dataset,” e-Energy 2019 - Proceedings of the 10th ACM International Conference on Future Energy Systems, pp. 139–149, 2019.
- [25] N.Rajesh Kumar and J.Uday Kumar, “A Spatial Mean and Median Filter For Noise Removal in Digital Images,” International Journal of Advanced Research in Electrical, Electronics and Instrumentation Engineering, vol. 4, no. 1, pp. 246–253, 2015.
- [26] H. Deng, G. Runger, E. Tuv, and M. Vladimir, “A time series forest for classification and feature extraction,” Information Sciences, vol. 239, pp. 142–153, 2013.
- [27] M. Christ, A. W. Kempa-Liehr, and M. Feindt, “Distributed and parallel time series feature extraction for industrial big data applications,” arXiv preprint arXiv:1610.07717, May 2016.
- [28] M. Barandas, D. Folgado, L. Fernandes, S. Santos, M. Abreu, P. Bota, H. Liu, T. Schultz, and H. Gamboa, “Tsfel: Time series feature extraction library,” SoftwareX, vol. 11, p. 100456, 2020.
- [29] F. Mörchen, “Time series feature extraction for data mining using dwt and dft,” 2003.
- [30] M. Christ, N. Braun, J. Neuffer, and A. W. Kempa-Liehr, “Time Series FeatuRe Extraction on basis of Scalable Hypothesis tests (tsfresh – A Python package),” Neurocomputing, vol. 307, pp. 72–77, 2018. [Online]. Available: https://www.sciencedirect.com/science/article/pii/S0925231218304843
- [31] F. Pedregosa, G. Varoquaux, A. Gramfort, V. Michel, B. Thirion, O. Grisel, M. Blondel, P. Prettenhofer, R. Weiss, V. Dubourg, J. Vanderplas, A. Passos, D. Cournapeau, M. Brucher, M. Perrot, and E. Duchesnay, “Scikit-learn: Machine learning in Python,” Journal of Machine Learning Research, vol. 12, pp. 2825–2830, 2011.
- [32] J. A. Suykens and J. Vandewalle, “Least squares support vector machine classifiers,” Neural processing letters, vol. 9, no. 3, pp. 293–300, 1999.
- [33] G. Guo, H. Wang, D. Bell, Y. Bi, and K. Greer, “Knn model-based approach in classification,” in OTM Confederated International Conferences” On the Move to Meaningful Internet Systems”. Springer, 2003, pp. 986–996.
- [34] L. Breiman, J. Friedman, C. J. Stone, and R. A. Olshen, Classification and regression trees. CRC press, 1984.
- [35] D. W. Hosmer Jr, S. Lemeshow, and R. X. Sturdivant, Applied logistic regression. John Wiley & Sons, 2013, vol. 398.
- [36] L. Breiman, “Random forests,” Machine learning, vol. 45, no. 1, pp. 5–32, 2001.
- [37] Y. Freund and R. E. Schapire, “A decision-theoretic generalization of on-line learning and an application to boosting,” Journal of computer and system sciences, vol. 55, no. 1, pp. 119–139, 1997.
- [38] C. Ferri, J. Hernández-Orallo, and R. Modroiu, “An experimental comparison of performance measures for classification,” Pattern Recognition Letters, vol. 30, no. 1, pp. 27–38, 2009.
- [39] S. Pelletier, O. Jabali, G. Laporte, and M. Veneroni, “Battery degradation and behaviour for electric vehicles: Review and numerical analyses of several models,” Transportation Research Part B: Methodological, vol. 103, pp. 158–187, 2017.
- [40] A. Barré, B. Deguilhem, S. Grolleau, M. Gérard, F. Suard, and D. Riu, “A review on lithium-ion battery ageing mechanisms and estimations for automotive applications,” Journal of Power Sources, vol. 241, pp. 680–689, 2013. [Online]. Available: http://dx.doi.org/10.1016/j.jpowsour.2013.05.040
- [41] J. Vetter, P. Novák, M. R. Wagner, C. Veit, K.-C. Möller, J. O. Besenhard, M. Winter, M. Wohlfahrt-Mehrens, C. Vogler, and A. Hammouche, “Ageing mechanisms in lithium-ion batteries,” Journal of Power Sources, vol. 147, no. 1, pp. 269–281, 2005. [Online]. Available: https://www.sciencedirect.com/science/article/pii/S0378775305000832
- [42] G. Kalogridis, C. Efthymiou, S. Z. Denic, T. A. Lewis, and R. Cepeda, “Privacy for smart meters: Towards undetectable appliance load signatures,” in 2010 First IEEE International Conference on Smart Grid Communications. IEEE, 2010, pp. 232–237.
- [43] M. Shateri, F. Messina, P. Piantanida, and F. Labeau, “Real-time privacy-preserving data release for smart meters,” IEEE Transactions on Smart Grid, vol. 11, no. 6, pp. 5174–5183, 2020.