Refining the E+A Galaxy: A Spatially Resolved Spectrophotometric Sample of Nearby Post-Starburst Systems in SDSS-IV MaNGA (MPL-5)
Abstract
Post-starburst galaxies are crucial to disentangling the effect of star formation and quenching on galaxy demographics. They comprise, however, a heterogeneous population of objects, described in numerous ways. To obtain a well-defined and uncontaminated sample, we take advantage of spatially-resolved spectroscopy to construct an unambiguous sample of E+A galaxies - post-starburst systems with no observed ongoing star formation. Using data from the Mapping Nearby Galaxies at Apache Point Observatory (MaNGA) Survey, in the fourth generation of the Sloan Digital Sky Survey (SDSS-IV), we have identified 30 E+A galaxies that lie within the green valley of color–stellar mass space. We first identified E+A candidates by their central, single-fiber spectra and (u-r) color from SDSS DR15, and then further required each galaxy to exhibit E+A properties throughout the entirety of the system to 3 effective radii. We describe our selection criteria in detail, note common pitfalls in E+A identification, and introduce the basic characteristics of the sample. We will use this E+A sample, which has been assembled with stringent criteria and thus re-establishes a well-defined sub-population within the broader category of post-starburst galaxies, to study the evolution of galaxies and their stellar populations in the time just after star formation within them is fully quenched.
1 Introduction
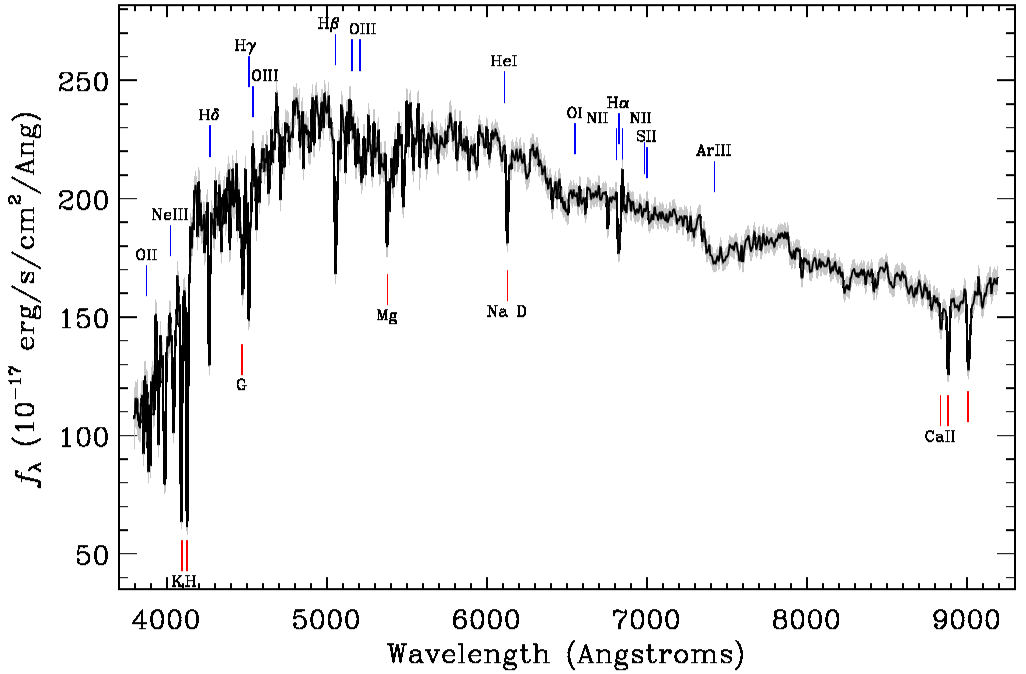
E+A galaxies are systems whose star formation has been completely quenched for approximately years, and whose spectra contain the earmarks of an intermediate age stellar population. As their name implies, the spectra of E+A galaxies resemble those of early-type galaxies, but have a bluer continuum than a typical elliptical, as well as strong stellar hydrogen Balmer absorption lines indicating the substantial presence of A-type stars. Notably, 6563 Å and [O II] 3727 Å emission lines, the primary indicators at optical wavelengths of ongoing star formation, are absent or weak in E+A galaxies.
Although the term “E+A galaxy” did not appear in the literature for several years afterward (Kollatschny & Fricke, 1989; Newberry et al., 1990; Oegerle et al., 1991), these objects were first recognized as post-starburst systems in distant galaxy clusters in the 1980s (Dressler & Gunn, 1982, 1983; Sharples et al., 1985). It was subsequently shown (Lavery & Henry, 1988; Caldwell et al., 1993, 1999) that E+A galaxies appeared in lower-redshift galaxy clusters too; meanwhile, the discovery of an archetypal E+A galaxy in the field at 0.088 (Oegerle et al., 1991; Liu et al., 2007) was soon followed by systematic studies of low-redshift E+A field galaxies, which showed that a large fraction of them were merging or interacting systems(Liu & Kennicutt, 1995a, b; Zabludoff et al., 1996).
Extensive stellar population synthesis work revealed that these uncommon objects, which comprise less than of the galaxy population overall, may represent valuable milestones in the galaxy lifecycle (Charlot & Silk, 1994; Liu & Green, 1996; Barger et al., 1996; Liu et al., 2007; Wild et al., 2009; Pawlik et al., 2018; French et al., 2018a). E+A galaxies have experienced significant evolution in the relatively recent past, and are therefore still harboring important information about how galaxies grow and evolve. Large galaxy surveys (e.g., Zabludoff et al. 1996; Blake et al. 2004; Goto 2007; Yang et al. 2015) have since yielded E+As at . In particular, Goto (2007), curated a sample of 564 E+As selected from SDSS DR5, which became the standard catalog for many years.
These rare galaxies have garnered substantial scientific attention as potential sites of AGN feedback and enhanced stellar tidal disruption (Guillochon et al., 2014; Mockler et al., 2019; Baron et al., 2018; French et al., 2018b, e.g.). To this end, multiwavelength work has been done to better understand the global SED and to quantify the interstellar medium, neighbor frequency and AGN fraction (e.g. Quillen et al., 1999; Galaz, 2000; Yamauchi et al., 2008; Nielsen et al., 2012; Zwaan et al., 2013; Alatalo et al., 2016a, b; Klitsch et al., 2017; Ardila et al., 2018; Wei et al., 2018; Smercina et al., 2018; Li et al., 2019). Integral field spectroscopy (IFS) has further been applied to study the kinematics of E+A galaxies (Goto et al., 2008; Pracy et al., 2013, 2014) as well as the spatial distribution of post-starburst substructure (Chen et al., 2019).
Over these several decades of work, the original nomenclature, E+A galaxy, has grown to represent a wide range of post-starburst systems. This expansion of meaning is largely understandable, simply because our understanding of galaxy evolution has grown; star formation quenching is thought to be a complex and lengthy process, resulting in a broad set of observed phenomena. In an attempt to organize the taxonomy of E+As, many groups, such as Goto (2007), Wilkinson et al. (2015), Meusinger et al. (2016), and Chen et al. (2019) to name a few, have identified sub-categories of post-starbursts in an attempt to refine category classifications, carefully comparing the characteristics of each subgroup. Compounding the challenge of refining such a definition, post-starburst systems in general and E+A galaxies in particular are usually identified only by the equivalent widths of small-aperture spectra; since the quenching of star formation in any given galaxy can exhibit great spatial variation (Chen et al., 2019), mapping the spectral properties over the galaxy is likely to be key to ensure apples-to-apples comparisons of similar galaxy types.
In this paper, we seek to refine and clarify the E+A galaxy class by invoking its original observational intent: a galaxy that, throughout its spatial extent, exhibits a bluer-than-usual, early-type spectrum, has no ongoing star formation, and contains strong hydrogen Balmer absorption. We use the Mapping Nearby Galaxies at Apache Point Observatory (MaNGA) IFS Survey (Law et al., 2016a, 2015a; Westfall et al., 2019; Belfiore et al., 2019; Gunn et al., 2006; Bundy et al., 2015; Drory et al., 2015a; Law et al., 2015b; Yan et al., 2016a, b; Law et al., 2016b; Wake et al., 2017), which has observed 10,000 nearby galaxies chosen to ensure a statistically representative galaxy population, as our parent sample. MaNGA provides a detailed view of the content, kinematics, history, and dynamics of galaxies across their entire face, and also generates a sample unbiased by galaxy size, mass, morphology, or environment (Yan et al., 2015, 2016c; Drory et al., 2015b; Smee et al., 2013). From the 2,777 galaxies available in the 5th Product Launch (MPL-5) of the MaNGA survey in the fourth generation of the Sloan Digital Sky Survey (SDSS-IV), Data Release 15 (DR15) (Blanton et al., 2017; Aguado et al., 2019), we identify a sample of objects that retain E+A characteristics throughout the majority of the galaxy. This carefully curated and confirmed set of E+A galaxies can serve as the basis of a series of investigations of galaxy evolution – in particular, studies of what may be the last stage of transition between actively star-forming and fully quenched galaxies.
| MaNGA ID | PLATE-IFU | RA | DEC | z | Mass | g-r | u-r | Morph | ||
|---|---|---|---|---|---|---|---|---|---|---|
| J2000 deg | J2000 deg | mag | mag | arcsec | ||||||
| Bluer in the center | 12-98126 | 7443-12701 | 230.5075 | 43.5323 | 0.021 | 9.96 | 0.58 | 2.07 | 3.82 | E? |
| 1-201180 | 8145-6102 | 116.5535 | 26.9230 | 0.016 | 9.28 | 0.61 | 2.28 | 5.20 | E | |
| 1-235582 | 8326-3704 | 214.8502 | 45.9008 | 0.039 | 10.08 | 0.63 | 2.2 | 4.02 | SO-a | |
| 1-209078 | 8486-3702 | 235.7749 | 48.3788 | 0.028 | 9.77 | 0.67 | 2.27 | 1.96 | S? | |
| 1-92638 | 8548-1901 | 242.2839 | 47.6361 | 0.019 | 9.69 | 0.64 | 2.26 | 1.33 | N/A | |
| 1-456505 | 8950-3702 | 193.9990 | 27.9551 | 0.027 | 9.84 | 0.62 | 2.14 | 3.73 | E? | |
| 1-456744 | 8950-3704 | 194.3316 | 27.6139 | 0.026 | 9.29 | 0.58 | 2.06 | 3.54 | E? | |
| 1-456309 | 8950-6101 | 194.7694 | 26.9582 | 0.027 | 10.47 | 0.6 | 1.98 | 5.01 | E? | |
| 1-210114 | 8979-1902 | 242.5853 | 41.8549 | 0.040 | 10.84 | 0.63 | 2.24 | 3.33 | SBbc | |
| 1-135235 | 9029-1901⋆ | 246.6681 | 42.0268 | 0.031 | 9.73 | 0.74 | 2.46 | 2.97 | N/A | |
| 1-178823 | 8623-9102 | 311.7638 | 0.4368 | 0.013 | 9.77 | 0.38 | 1.35 | 7.57 | SO-a | |
| Redder in the center | 1-266298 | 8333-1901 | 215.7042 | 42.3956 | 0.026 | 9.43 | 0.72 | 2.45 | 2.13 | N/A |
| 1-489884 | 8338-9102 | 171.2515 | 22.5142 | 0.049 | 10.41 | 0.69 | 2.33 | 1.69 | E? | |
| 1-29809 | 8655-1902† | 358.4688 | -0.0987 | 0.022 | 9.55 | 0.71 | 2.37 | 2.71 | E?⋄ | |
| 1-456380 | 8934-3704 | 194.1990 | 27.4209 | 0.026 | 9.914 | 0.69 | 2.27 | 3.59 | SO | |
| Normal Progression | 12-49536 | 7443-1902 | 231.9911 | 42.9712 | 0.076 | 9.69 | 0.67 | 2.19 | 4.36 | SO-a |
| 1-24124 | 7991-3703 | 258.5303 | 57.4774 | 0.024 | 9.671 | 0.68 | 2.31 | 3.64 | SBc | |
| 1-37034 | 8077-1901 | 41.3789 | 0.9206 | 0.024 | 9.76 | 0.75 | 2.42 | 3.06 | E | |
| 1-109112 | 8078-1901 | 41.3609 | 0.9101 | 0.025 | 9.76 | 0.77 | 2.51 | 2.13 | E | |
| 1-38374 | 8082-3704 | 50.8886 | -0.4385 | 0.039 | 9.956 | 0.65 | 2.22 | 2.71 | SO-a | |
| 1-560826 | 8315-3703† | 236.1657 | 38.4254 | 0.027 | 10.63 | 0.69 | 2.42 | 4.76 | E? | |
| 1-90984 | 8553-3701 | 233.4915 | 56.8473 | 0.011 | 9.18 | 0.65 | 2.17 | 3.70 | E | |
| 1-90176 | 8553-6101 | 233.3523 | 56.6088 | 0.012 | 9.28 | 0.69 | 2.33 | 4.57 | Sm | |
| 1-95093 | 8588-3704 | 250.9693 | 39.9834 | 0.030 | 10.54 | 0.7 | 2.38 | 4.26 | Sa | |
| 1-456935 | 8931-12705 | 195.0063 | 27.7312 | 0.027 | 9.78 | 0.66 | 2.17 | 6.31 | E?⋄ | |
| 1-456434 | 8931-3701 | 192.7884 | 27.4068 | 0.023 | 9.54 | 0.6 | 2.12 | 4.75 | E? | |
| 1-457004 | 8934-9101 | 196.2637 | 27.5370 | 0.022 | 9.38 | 0.57 | 2.00 | 6.28 | Sc | |
| 1-230177 | 8942-6101⋆ | 124.8979 | 26.3627 | 0.020 | 9.60 | 0.71 | 2.3 | 5.11 | E-SO⋄ | |
| 1-456635 | 8949-3701 | 195.0840 | 27.8435 | 0.026 | 9.59 | 0.68 | 2.25 | 3.59 | E-SO | |
| 1-264510 | 9041-1902⋆ | 237.0254 | 29.2023 | 0.033 | 10.21 | 0.70 | 2.38 | 2.54 | N/A |
2 Initial Sample Selection
Our goal in this paper is to take advantage of the extra diagnostic power of an IFS survey to construct a rigorously defined sample of E+A galaxies. To begin our process, we determined our initial candidate pool using single-fiber spectra from SDSS DR15 in order to be able to compare our results with traditional classification methods. Those galaxy spectra were obtained through circular fiber-optic apertures 3 arcseconds in diameter located at the center of each galaxy.
Crucially, our sample selection strategy was very expansive at the outset. If the original criteria to include an object were too stringent, a large portion of any potential E+A sample could be eliminated from the start. Additionally, as we wished to examine the post-starburst galaxy population as a whole to refine the definition of E+A galaxies in particular, it was important to include objects with emission lines other than H, in case non-thermal ionization or active galactic nuclei were present even though star formation has been quenched.
With this in mind, our initial criteria for identifying E+A galaxy candidates from the SDSS DR15, single-fiber spectra were as follows:
-
1.
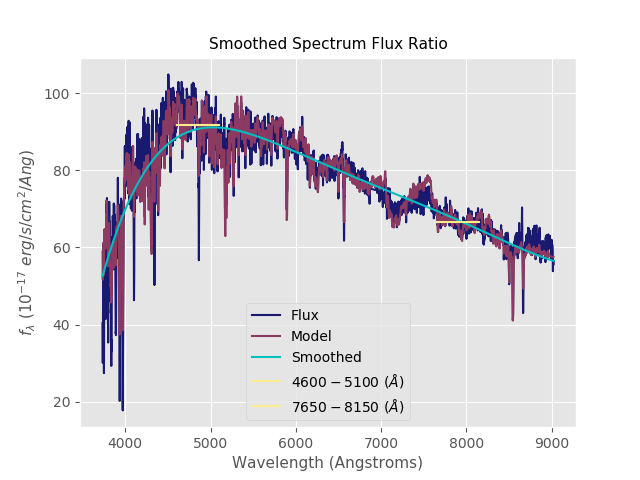
A blue slope in the continuum flux between 4700 Å and 8000 Å, such that .
-
2.
A 4000 break 1.5 to indicate a stellar population not dominated by hot, young stars.
-
3.
No H emission line flux (We allow [NII] 6548, 6583 Å emission).
-
4.
Weak to absent [OII] 3727 Å emission, typically with less than 5 Å equivalent width 111 We want to emphasize the typical stated in this item, as our galaxies [OII] equivalent width values range from -0.95 to -15.04 Å.
-
5.
Strong hydrogen Balmer absorption lines (H, H, H) of at least 2 Å equivalent width - a value corresponding to the “H-strong” galaxies of Barger et al. (1996).
Initially, the single-fiber spectra for all 2,777 galaxies in the MPL-5 were individually visually inspected. Objects that showed some initial correspondence with these five criteria were then further measured manually to confirm emission line and absorption line equivalent widths, primarily using the splot tool in IRAF 222IRAF is distributed by the NOIRLab (formerly the National Optical Astronomy Observatories) which is operated by the Association of Universities for Research in Astronomy, Inc. (AURA) under cooperative agreement with the National Science Foundation.. These visual and manual steps turned out to be crucial in our E+A candidate identifications. As we discuss later, they significantly distinguish our final E+A galaxy sample from other samples selected by more automated methods, as they helped us avoid model-dependent systematic errors in our selection process.
In all, 42 E+A candidates had single-fiber central spectra that satisfied all five criteria. See Figure 1 for a prototypical single-fiber spectrum of these candidates, and Table 1 for the final sample’s galaxy demographics. Figure 2 illustrates the method we used to measure the continuum flux ratio criterion, fitting a spline-smoothed continuum and then comparing the median fluxes in two 500 Å bands at 4700 Å and 8000 Å respectively. The visual inspection of the single-fiber spectra particularly helps us to discern redder galaxies with stronger Balmer lines (sometimes called “k+a” galaxies, whose spectra is that of an older population, dominated by K-giants within a strong A-type stellar population) which can be very difficult to distinguish from E+As using only algorithmic methods.
| WHAN | ||||
|---|---|---|---|---|
| MaNGA-ID | PLATE-IFU | SF | AGN | OLD STARS |
| 12-98126 | 7443-12701 | 6.62% | 20.75% | 72.64% |
| 12-49536 | 7443-1902 | 0.39% | 0.00% | 99.61% |
| 1-24124 | 7991-3703 | 1.29% | 8.13% | 90.57% |
| 1-37034 | 8077-1901 | 0.00% | 0.00% | 100% |
| 1-109112 | 8078-1901 | 0.00% | 0.00% | 100% |
| 1-38374 | 8082-3704 | 0.00% | 4.21% | 95.79% |
| 1-201180 | 8145-6102 | 1.79% | 10.54% | 87.67% |
| 1-560826 | 8315-3703 | 0.14% | 0.43% | 99.42% |
| 1-235582 | 8326-3704 | 0.79% | 1.78% | 97.44% |
| 1-266298 | 8333-1901 | 0.00% | 0.00% | 100% |
| 1-489884 | 8338-9102 | 2.84% | 21.70% | 75.46% |
| 1-209078 | 8486-3702 | 9.43% | 22.55% | 68.02% |
| 1-92638 | 8548-1901 | 1.37% | 6.85% | 91.78% |
| 1-90984 | 8553-3701 | 0.00% | 0.21% | 99.79% |
| 1-90176 | 8553-6101 | 0.00% | 0.91% | 99.09% |
| 1-95093 | 8588-3704 | 0.28% | 0.42% | 99.29% |
| 1-178823 | 8623-9102 | 0.41% | 1.35% | 98.24% |
| 1-29809 | 8655-1902 | 5.45% | 0.78% | 93.77% |
| 1-456935 | 8931-12705 | 2.03% | 15.25% | 82.72% |
| 1-456434 | 8931-3701 | 0.00% | 1.34% | 98.66% |
| 1-456380 | 8934-3704 | 4.44% | 12.13% | 83.43% |
| 1-457004 | 8934-9101 | 4.44% | 6.67% | 79.89% |
| 1-230177 | 8942-6101 | 4.68% | 5.83% | 89.48% |
| 1-456635 | 8949-3701 | 3.15% | 7.21% | 89.64% |
| 1-456505 | 8950-3702 | 5.23% | 1.53% | 93.25% |
| 1-456744 | 8950-3704 | 3.67% | 17.85% | 78.48% |
| 1-456309 | 8950-6101 | 2.94% | 16.91% | 80.15% |
| 1-210114 | 8979-1902 | 0.00% | 0.00% | 100% |
| 1-135235 | 9029-1901 | 0.00% | 0.00% | 100% |
| 1-264510 | 9041-1902 | 1.18% | 1.57% | 97.25% |
3 Final Sample Selection: MaNGA IFS
We next used the integral field spectroscopic data from MaNGA to test the identifications of these E+A candidates found using the central single-fiber spectra. The primary software tool we used to examine these galaxies was Marvin 2.0 (Cherinka et al., 2018), a software pipeline integrated with the SDSS Skyserver that is designed to search, access, and visualize MaNGA data.
To begin, as a consistency check with our SDSS DR15 single fiber spectra measurements, we used MaNGA data to generate a single composite central spectrum by summing and averaging the spaxels of each galaxy’s MaNGA map within one effective radius () of the center of each candidate galaxy. We also collected the non-parametric equivalent widths supplied in 25 Å intervals by the MaNGA Data Analysis Pipeline (DAP), to create, for each galaxy, spatially resolved ionization maps at the wavelengths of 11 well-known optical emission lines (see Figure 4). We compared the MaNGA results to our by-hand EW values measured with splot, and confirmed broad consistency between the two sets of values.
We then applied the MaNGA data to complete our E+A galaxy selection process. This happened in two ways: checking if the spectrophotometry of each galaxy was the same throughout the galaxy, and conducting emission-line diagnostics over the entire galaxy to confirm the lack of star formation. Our multi-parameter selection criteria also allowed us to determine that the nuclear line emission in these E+As is most likely caused by weak AGN rather than centrally concentrated star formation.
3.1 Spectrophotometry vs. Radius
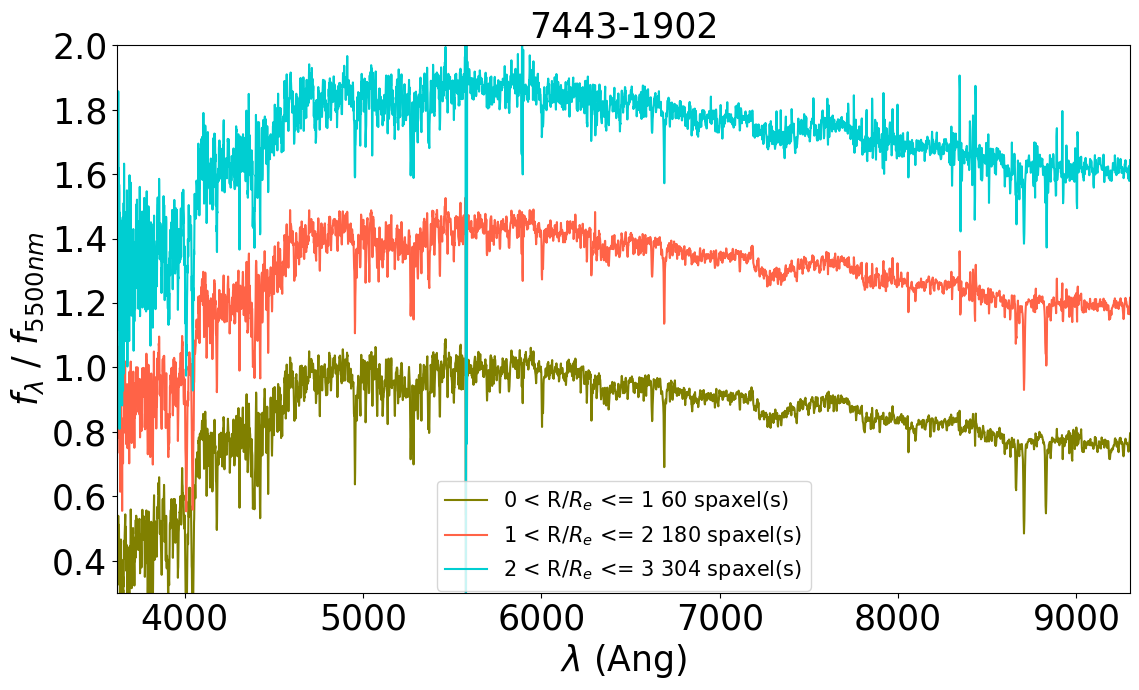
To ensure that a candidate galaxy’s spectra satisfied our E+A criteria throughout the galaxy, while also increasing the signal-to-noise ratio, we summed the spaxels in three annular regions: from 0-1, 1-2 and 2-3 (See Figure 5 for an example). The spaxels in each region were summed to create a single spectrum; then, the three spectra were each normalized to unity at 5500 Å and overlaid to examine the spectrophotometric differences between the three regions.
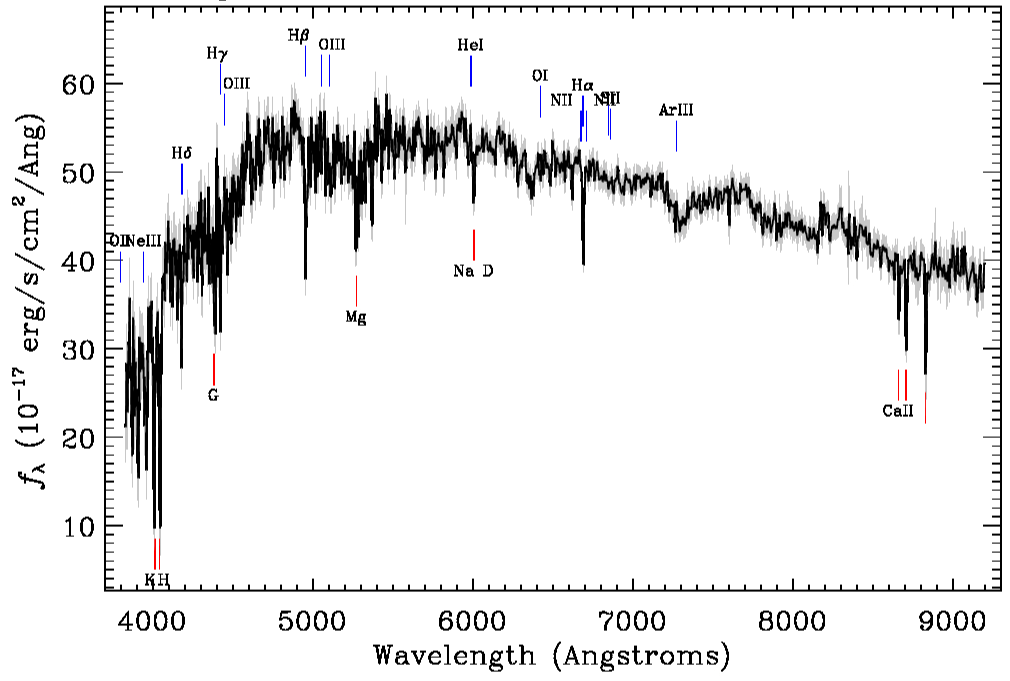
An example of this process with the summed spectra of one galaxy, 8082-3704, is presented in Figure 3. A comparison to the single-fiber spectrum of the galaxy confirms the same characteristic E + A shape in all three apertures. By contrast, the bottom panel of Figure 6 shows another of our E+A candidates, 8077-12704, where the spectra of the three apertures clearly differ. The former object fulfilled this criterion of being an E+A galaxy by our refined definition, while the latter object did not.
3.2 WHAN Diagrams
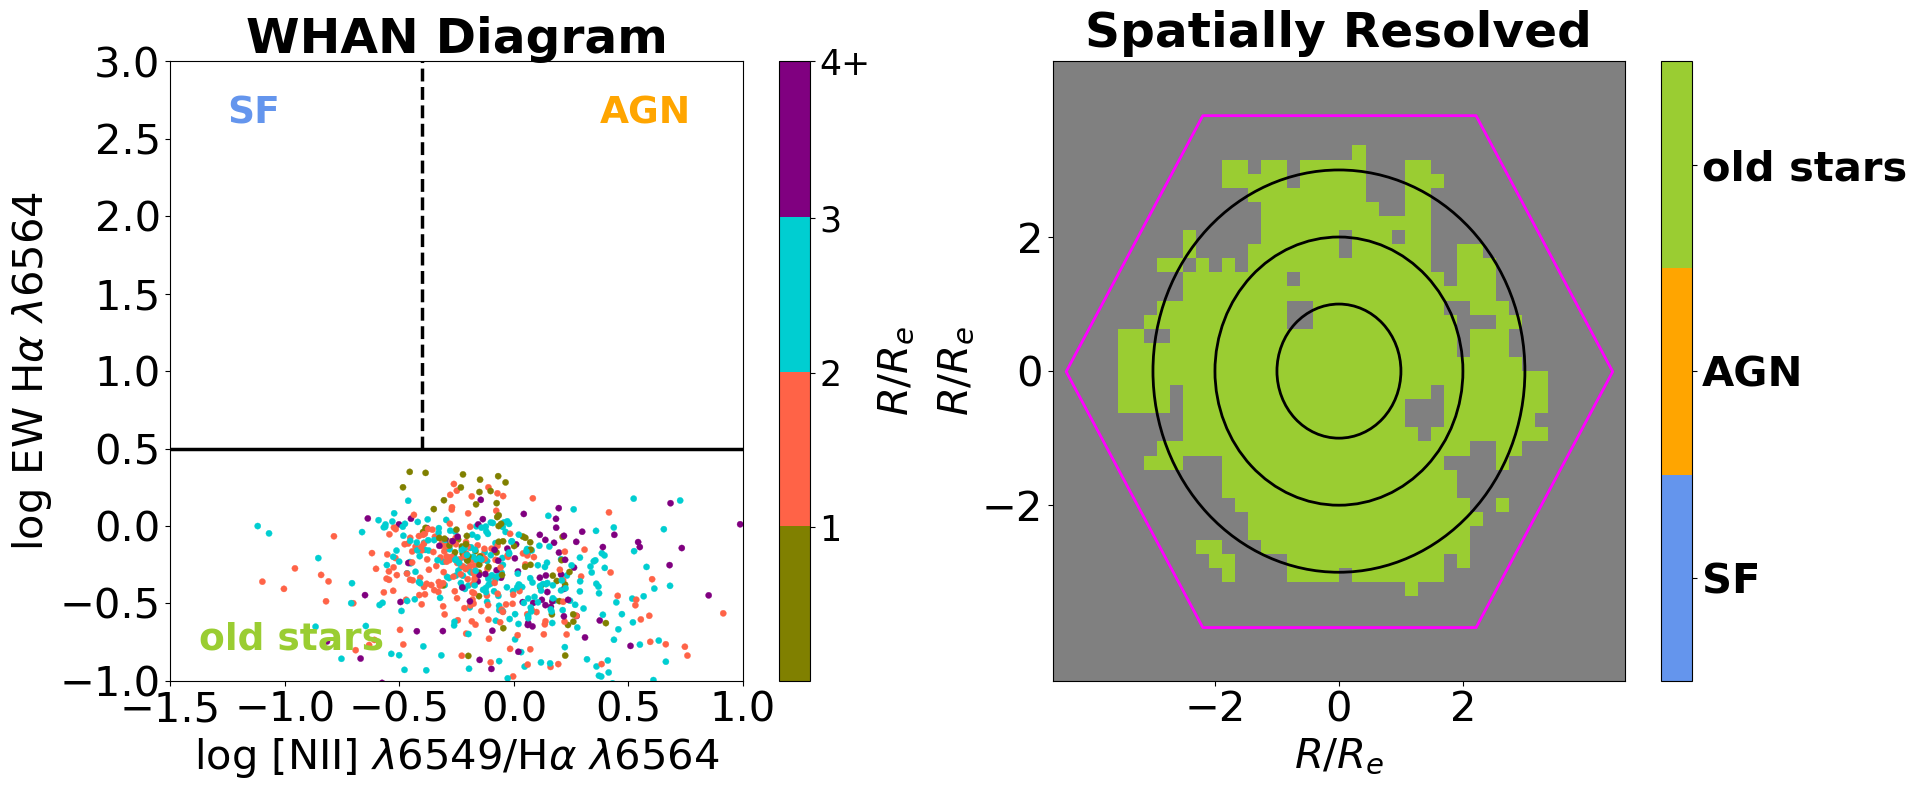
Following the approach of Belfiore et al. (2015), we plotted spectral line ratios of each spaxel to see how they differ from the single-fiber data, as shown in Figure 5 (left). Specifically, we created BPT (Baldwin-Phillips-Terlevich (Baldwin et al., 1981) diagrams, which we found to be only somewhat useful as the [OIII], H, and [SII] lines in the sample are weak. We also generated WHAN (log EW H / (log [NII]/H)) diagrams in an effort to delineate the regions of the galaxies that would be considered old stars, AGN or star forming. Belfiore et al. (2015) classifies three regions for the WHAN diagram 333This method is slightly refined from the Cid Fernandes et al. (2011) version that included five categories, two of which would fall into our “old stars” region as Retired Galaxies, and Passive Galaxies.:
(1) Old Stars if EW(H) 3Å.
(2) AGN if EW(H) 3Å and [NII]/H -0.1
(3) Star Forming if EW(H) 6Å and [NII]/H -0.1
The WHAN diagrams confirm that these galaxies have no current star formation, with, on average, each galaxy having defined more than 90% of the spaxels as an old stellar population (See Figure 5 and Table 2). This is because H emission is necessarily low for E + A classification, and is the vertical axis for WHAN diagrams. Because H emission is possibly the most reliable proxy for ongoing star formation, it gives us confidence that these galaxies are post-starburst.
The use of these WHAN diagrams confirms the classification of our E+As, across the entirety of the galaxy. Only being able to view a single-fiber region of the galaxy leaves us open for classification mistakes, and outlier data that would muddle the sample. This is evident in Figure 6, which shows the analysis of the galaxy 8077-12704. While its single-fiber spectrum meets the specified criteria we outlined before, this galaxy only retains its E+A properties at the very center, as shown in its WHAN diagram. Only 3.19% of the spaxels in the MaNGA map are considered “old stars” whereas 93.9% is highly star forming. Preliminarily, using Marvin’s interactive “Spectrum in Spaxel” tool, we were able to see that at both two and three , the strong Balmer absorption lines disappear, and are replaced with intense H emission, losing all semblance of E+A classification. The three summed spaxel spectra in the 0-1, 1-2 and 2-3 apertures, as clearly seen in Figure 3, have different continuum shapes from one other. Once completed, we were able to note that the spectra did not overlay well; the difference was not as stark as Marvin’s interactive spectrum due to our normalization factors, but it was still clearly off by enough that we could confidently say it should not be a part of our sample, and did not meet the specified criteria. This galaxy, had it been included in our sample, would have dramatically skewed results.
3.3 Final Sample: 30 Galaxies
By applying these two MaNGA-enabled criteria to our 42 candidates, 12 of these candidates were rejected because it was demonstrated either that they were star-forming, or had an inconclusive star-formation history in spaxels beyond their central regions. (As seen below, these twelve rejected candidates provide useful data points in our efforts to understand more clearly the interplay between classification requirements for E+A galaxies.) We were left with a confident final sample of 30 E+A galaxies that fit all seven of our E+A classification criteria – 5 for one-dimensional spectra, and 2 for the integral field spectra.
4 Color and Mass
The constraint on the 4700 Å to 8000 Å continuum flux ratios for the E+A galaxies we identified naturally leads to an SDSS color of roughly . Consequently, our sample is almost entirely comprised of galaxies residing in a region of color-mass and color-magnitude space known as the “green valley” (Wild et al., 2009; Schawinski et al., 2014). It has been suggested (Schawinski et al., 2014) that this region does not host a uniform population, but rather of two overlapping populations - that of bluish early-type galaxies and of reddish late-type galaxies. Do E+As, then, represent a distinct galaxy evolutionary stage, or are they just coincidental stragglers in and around the green valley? Put another way, while our criteria provides a sort of red upper bound to E+A galaxies, does it follow that a blue lower bound also exists for E+As? To test this question, we overlaid our E+A galaxy sample on color-magnitude and color-mass diagrams of galaxies in the local universe to see where they fall in these spaces.
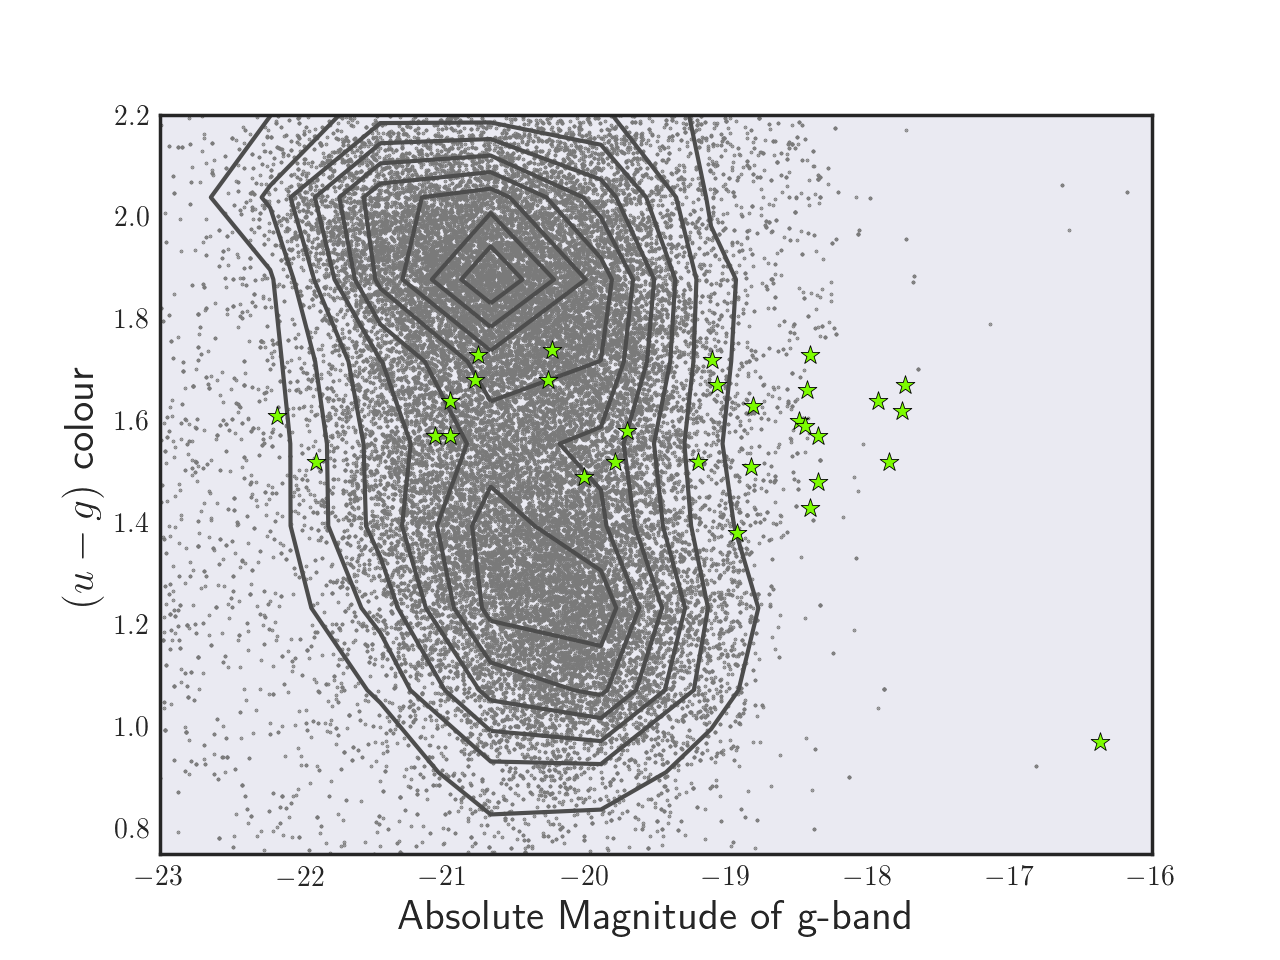
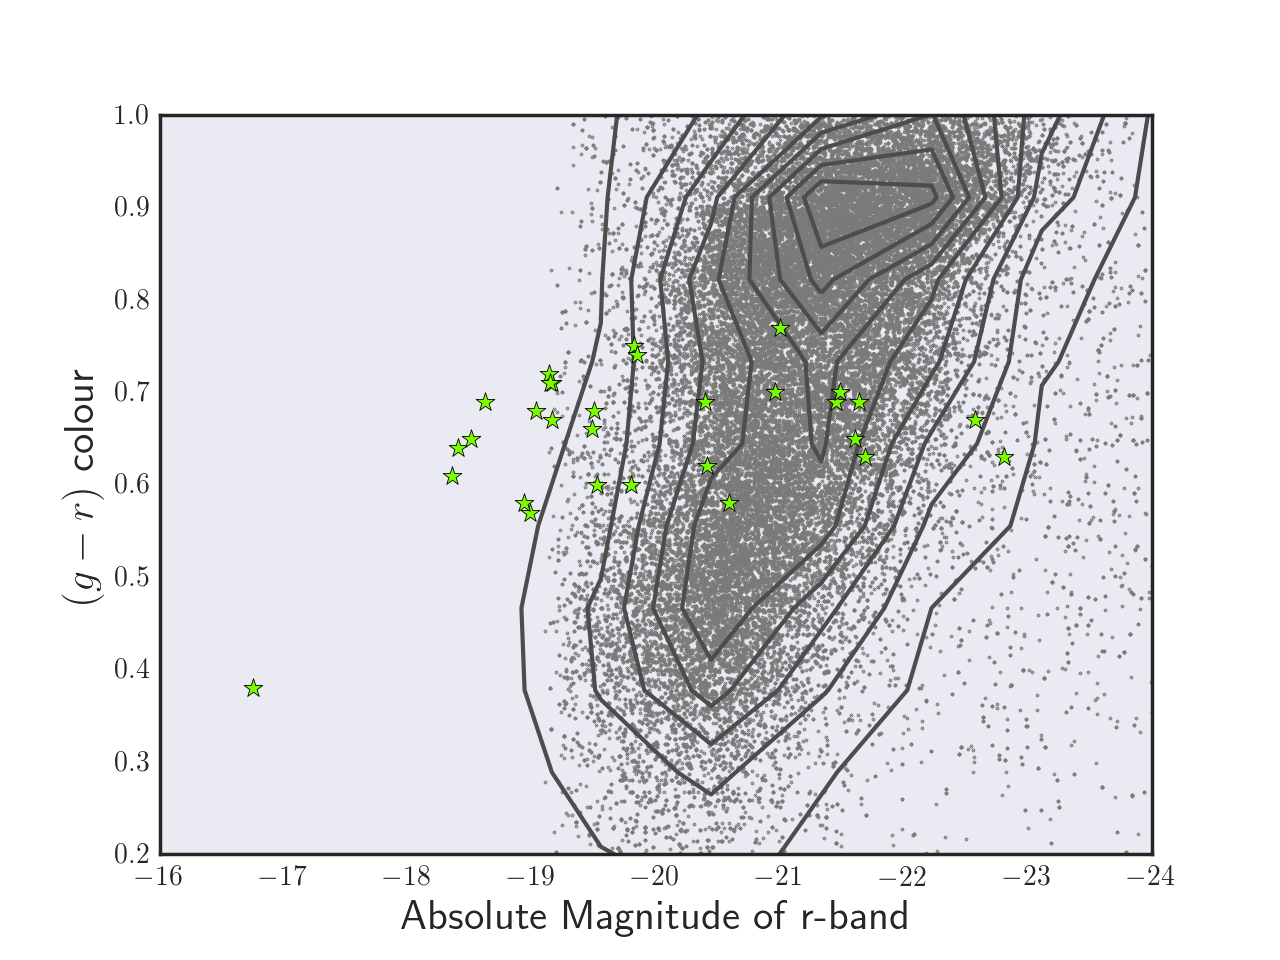
Our color-magnitude diagrams were created by taking a random sample of 50,000 galaxies from SDSS DR15 to populate the background, all-galaxies space. We limited these background galaxies with a z 0.08, a g-band 17.77 mag, an absolute g-band magnitude range of -21 -16, and an absolute r-band magnitude range of -22 -14. With such a clean sample of E+A galaxies, we can begin to place this galaxy type within the larger context of galaxy demographics and evolution.
The result is shown in Figure 8. Overwhelmingly, our sample, in both the and the diagrams, span the green valley transition zone. While some of the galaxies do sit more in what is considered the upper blue cloud, or lower red sequence (making special note of the one outlying E+A galaxy that is both very bright and very blue in color, and meets all criteria outlined in this paper), it is clear that these E+A galaxies are in some way transitioning from one evolutionary track to the other.
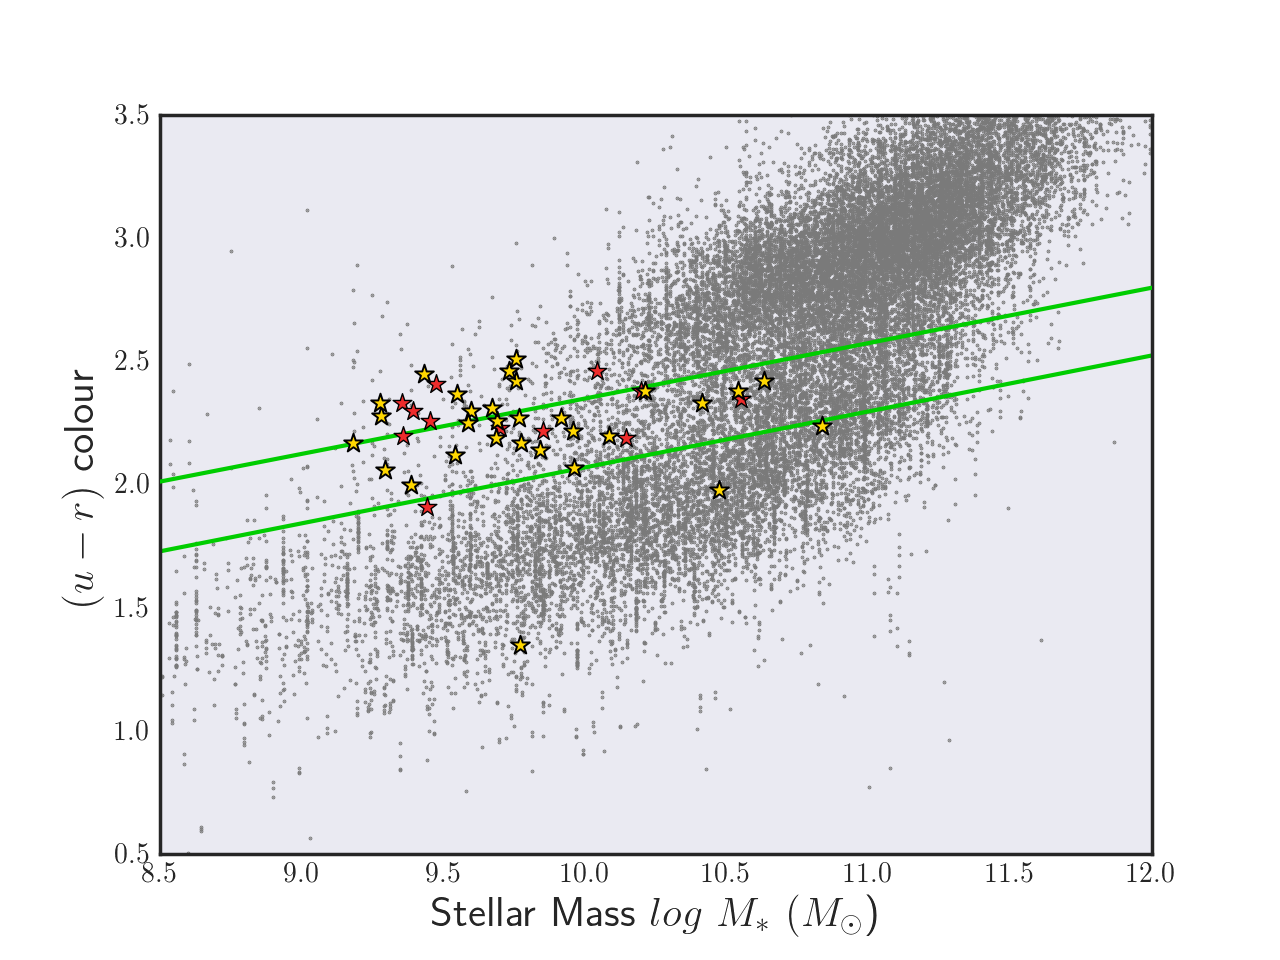
To analyze the color-mass distribution of our E+A galaxy sample, we used the Mendel Mass Catalog (Mendel et al., 2014), which calculates an estimated total mass based on Sérsic photometry with dust-free models, for the background galaxies in Figure 7 444Although there are masses calculated in SDSS MPL-5, the lower systematic uncertainties in the Mendel catalog were preferred. The evolutionary trends we find remain intact when we substituted SDSS-MPL-5 masses.
Figure 7 shows the placement of our sample on a color-mass diagram. Again, these E+A galaxies broadly lay in the green valley, mirroring our color selection effect. Some important distinctions remain, however; to emphasize this, we overplot the final E+A galaxy sample (green stars) with E+A candidates that were excluded because they failed to meet our criteria throughout the entirety of the galaxy (pink stars). Both the green and pink stars occupy roughly the same color-mass space, but ultimately not all were considered E+A galaxies.
Figures 8 and 7 demonstrate that, although our E+A galaxies lie mostly in the green valley range, not all green valley galaxies are E+As. Had we built our E+A sample only using single-fiber spectra and the colors provided by SDSS, we would have significant contamination from non-E+As. Furthermore, the E+A galaxy that sits very low in the blue cloud, 8623-1902, would definitely have been excluded, despite the evidence that it may be a dwarf quenched by AGN feedback; (see Penny et al. (2017); Marinelli et al. (2020)). The location of a galaxy in certain regions of color-color space has been used in past studies to narrow the search parameters for E+A galaxies; as we can see, such a color-color cutoff technique does not yield a complete and uncontaminated E+A sample.
5 Morphology
Although the “E” in the name “E+A galaxy” has occasionally been confused to designate an elliptical galaxy instead of a spectral shape, morphology is not a defining feature of an E+A galaxy. we noted a broad morphological distribution among our sample. Using morphological information listed in HyperLEDA (Makarov et al., 2014), we determine that of the 25 galaxies with morphologies in the database, seven are classified as S0 with possible hints of a bar, six are spirals (mix of both barred and non-barred), four are ellipticals, and eight are indeterminate “E-S0”.
The connections between S0 morphology and star formation quenching have been the subject of considerable study, especially in the context of S0 formation via galaxy-galaxy interactions and mergers (see, e.g., (Eliche-Moral et al., 2018) and references therein). Although our results do indicate a slight preponderance of early-type galaxies, the broad overall distribution of morphologies underlines the secondary, less deterministic role that galaxy shape plays in the making of an E+A galaxy.
Depending on whether or not a galaxy is classified as early-type or late-type, Schawinski et al. 2014 posit that the different morphological types of galaxies across the color-mass plane are concentrated in their designated sections. In this model, most early-types reside in the red sequence, with about 10% of the galaxies reaching the blue cloud, representing a rapid transition between stages; late-type galaxies, meanwhile, form a continuous population with no transition zone at all, going directly from the blue cloud to the red sequence without going through a transitional phase. If this were the case, no E+A galaxy could ever be a late-type galaxy. However, Smethurst et al. 2015 has shown that the green valley is indeed a transitional population between the red sequence and blue cloud, regardless of morphology. Our work supports this picture, as we have at least 4 late-type galaxies, one being a very clear barred spiral, amongst our final sample of 30. Our E+A galaxies are not just blue ellipticals or red spirals; rather, they comprise an evolutionary population in their own right, with their own distinct spectral signature.
6 Discussion
6.1 E+A Galaxy Sample Comparison
As our primary goal is to refine the definition of an E+A galaxy, and then produce a sample of E+As that fit the refined definition, it is important to compare our results to studies that used other techniques to find E+As. Altogether, we compare to four studies. Goto (2007) is used as a standard for identifying E+As, and three post-starburst studies conducted by Wilkinson et al. (2017), Meusinger et al. (2016), and Chen et al. (2019) lend themselves well to comparison, as they employ the the SDSS pipeline. Furthermore, Wilkinson et al. (2017) and Meusinger et al. (2016) explicitly define an E+A sample, while Chen et al. (2019) also uses MaNGA data.
| PYRAF | SDSS | ||||||||||
|---|---|---|---|---|---|---|---|---|---|---|---|
| MaNGA-ID | PLATE-IFU | H | H | H | H | [OII] | H | H | H | H | [OII] |
| 1-210114 | 8979-1902 | 1.95 | 4.79 | 3.41 | 4.54 | -2.43 | -0.88 | 0.09 | 0.28 | 0.52 | -0.43 |
| 1-109112 | 8078-1901 | 1.99 | 2.06 | 2.18 | 3.27 | -2.22 | -0.07 | 0.05 | 0.04 | 0.27 | 0.11 |
| 1-38166 | 8081-3702 | -1.51 | 4.87 | 2.01 | 3.08 | -1.11 | -2.89 | -0.47 | -0.24 | -0.12 | -5.86 |
The following are the E+A definitions from each paper:
-
1.
Goto 2007 required EW [OII] -2.5 Å, EW H -3 Å and EW H 5 Å in SDSS single-fiber spectra from the DR5 catalog, resulting in a catalog of 564 galaxies.
- 2.
-
3.
Meusinger et al. 2016 used similar spectral index limits as Wilkinson et al. 2017, but allowed for a larger EW H and EW [OII] range of -5 Å and -3 Å respectively. They identified 2,665 E+A galaxies under these initial parameters, and 916 galaxies when they lowered their EW parameters to match that of Goto (2007), yielding 0.3% of their mipmapped sample.
-
4.
Chen et al. 2019 required an EW H 3 Å as well, but set their EW H 10 Å from the MaNGA database, and required at least six spaxels. They did not include an [OII] criterion. Their “central post-starburst” sub-category contained 31 objects.
To better understand the effects of the selection criteria, we subjected our candidate galaxies to the same algorithms each of these studies with the equivalent width measurements for each galaxy listed in the SDSS galSpecLine catalog. We caution that the emission line catalogs for SDSS contain significant systematic errors and misaligned measurements, especially of weaker spectral features. Indeed, none of our E+A candidates would have satisfied any of the above studies had we used the SDSS EW values.
We found that our E+A sample has no objects in common with the Goto (2007) catalog. In particular, although many of our candidates pass the [OII] and H criteria, none of our sample has H 5 Å. Only two galaxies in Goto (2007) were observed by MaNGA. Of those two, 8083-9101 is a galaxy interaction, and is therefore rejected; furthermore, the minor galaxy in that interaction exhibits a k+a spectrum with strong H emission, and would have been rejected as well. The second, 8555-3701, was rejected during our initial search through the MaNGA catalog for having too red a continuum shape that indicates it is more of a transition between E+A and k+a. While we can confidently say these two systems are indeed post-starburst, they do not meet our more stringent criteria for an E+A galaxy.
We found that our E+A sample has no objects in common with the Wilkinson et al. (2017) catalog. However, it appears that 3 of our E+A galaxies would have appeared in the Wilkinson et al. (2017) catalog; reanalysis of the EWs revealed that the SDSS DR7 database was in error. These common galaxies are listed in Table 3, along with their stated and recalculated EW measurements. We believe that although the biggest reason our samples differ is due to our requirement on the continuum shape, we caution that reliance on SDSS spectral values may skew such a sample.
Meusinger et al. 2016 used a combination of artificial neural network algorithms, SDSS fits data, and EW measurements to cull their sample from 1 million galaxies. They went further by doing a visual inspection of each returned spectra to eliminate all artifact contamination, leaving only 0.26% of their original objects. We found that our E+A sample has no objects in common with the Meusinger et al. (2016) catalog, primarily due to their H 3 Årequirement. However, 7 galaxies in our sample do indeed satisfy these criteria; notably these 7 have erroneous SDSS EWs, and we speculate that this excluded them from their catalog at the onset.
Of these four studies, we had the best chance of overlapping with the Chen et al. (2019) sample because was also selected from MaNGA and used more inclusive criteria for than the other studies. They required at least six spaxels with EW H 3 Å and EW H 10 Å. They further subdivided the 74 objects that fit those criteria into different groups; broadly, their group of “central post-starburst” objects were selected in the same way as our sample, as we started with the requirement that the spectrum in each galaxy’s central region have E+A characteristics.
We found that of the 31 galaxies in the Chen et al. (2019) central post-starburst subsample, 10 were in our list of 42 candidates. This rate of correspondence is much higher than that of the other three studies, yet still not a majority match to their entire sample. We think the main discrepancy can be attributed to our requirement that no less than 70% of the galaxy be classified as post-starburst, which could have been in excess of 900 spaxels per galaxy rather than their six spaxel limit. We note, however, that 12 of our candidate galaxies do satisfy the criteria set forth by Chen et al. 2019, and we attribute this very small discrepancy to erroneous EW measurements.
As it turned out, there was little overlap between our final sample and those of the other four studies. Even after reanalyzing the EWs, at most only 28% of our sample of candidate galaxies would have made it into one of these four samples. The greatest overlap was with Chen et al. (2019). Considering that they also used MaNGA as their parent galaxy sample, that is still somewhat surprisingly low. As for the Goto 2007, Meusinger et al. 2016 and Wilkinson et al. 2017 samples, our final lists of E+A galaxies did not overlap at all.
A major contributor to this discrepancy is our lower limit of 2 Å EW of Balmer absorption, which is consistent with earlier definitions of E+A galaxies in high-redshift clusters (e.g., Barger et al. 1996) but less stringent than the limit of these four surveys.
The most important difference, however, is that all four of these sample sets based their values of spectral indices on the spectral fits provided in the SDSS database. Our analyses of individual E+A galaxies in our final sample (e.g.,Marinelli et al. 2020) showed that those fits frequently failed to measure accurately the equivalent widths of the Balmer absorption lines. One likely reason for this is that spectral synthesis models do very well with typical galaxy spectra, but are not well-equipped to fit E+A galaxies whose Balmer absorption lines are unusually deep, thus underestimating them significantly. Like us, Chen et al. 2019 and Meusinger et al. 2016 used visual inspection to confirm their galaxies– but only on the galaxies returned by their searches, which may have been biased by this systematic effect.
6.2 E+A Galaxies in IFS
The detailed, multi-step process that we used to obtain our sample represents a significant refinement of how an E+A galaxy is defined. By rigorously distinguishing E+A galaxies as a well-defined subset of the heterogeneous population of post-starburst galaxy systems overall, we can use E+As as tracers of galaxy evolution with much greater precision, and investigate the critical process of star formation quenching in its final stages.
With the added diagnostic power of the MaNGA IFS data, we have already noticed some spatially dependent properties of our E+A galaxy sample that bear further investigation. For example, we noticed several defining features among the galaxies, allowing us to classify them into sub-samples (as shown in Table 1). 12 objects in the final sample showed almost identical spectra and colors from 0 to 3 , aligning perfectly with the characteristics we defined in section 2. 11 of them were significantly bluer in the center than at 2-3 , while the opposite was true in 4 others that were redder in the center, and bluer at 2-3 . 3 galaxies exhibited significant forbidden line emission ([OII], [NII], and [SII]) in the central MaNGA aperture that did not appear in their SDSS DR15 single-fiber spectra. Finally, 3 of the galaxies had a significantly higher flux in the annular aperture from 1-2 than in their central or outer apertures. Further investigation of these traits and what they imply about E+A galaxy evolution will be explained in a forthcoming paper.
Perhaps the most important improvement that MaNGA has allowed in our E+A identifications is that we have been able to confirm that star formation has ceased in our E+As even if some emission lines are present in the spectrum. In particular, whereas automation-dependent searches for E+As almost always exclude galaxies with significant H + [NII] emission, we have been able to include E+A galaxies that have [NII] emission lines, but no H emission sandwiched between them (Two galaxies in our final sample, in fact, showed very significant line emission). As a result, we do not exclude the study of weak or nearly-dormant nuclear activity in our E+As. We are further able to combine that information with the spatially resolved information that integral field spectra provide, such as stellar age and metallicity gradients, gas distribution, and stellar and gas dynamics; in E+A galaxies, that means we can probe not only star formation duty cycles and stellar populations, but also AGN duty cycles, AGN feedback and the starburst-AGN connection in each E+A galaxy’s recent history. These topics will be explored in detail in upcoming papers.
7 Conclusions
We set out to refine a specific set of criteria to be used in the identification of E+A galaxies in the following way:
-
1.
We mined MaNGA’s MPL-5 sample and selected E+A candidates by their single fiber spectrum housed in the SDSS DR15. We looked for galaxies that presented with strong Balmer absorption lines, with an EW 2 Å, No H emission, low to no [OII] emission, a S/N 10, and a significant A-type continuum. We further require that overwhelming majority of spaxels exhibit the same E+A criterion throughout the disk.
-
2.
Using the IFS data from MaNGA, we summed spaxel spectra in annuli of 1, 2, and 3 effective radii to ensure each annular spectrum passed our E+A criteria. This was diagnostic of a dominant E+A spectrum throughout the galaxy.
-
3.
We created spatially resolved WHAN diagrams of each galaxy to confirm an old stellar population. Through this method, we were able to exclude two galaxies that exhibited E+A properties only in the central region, but were highly star forming elsewhere. Overwhelmingly, of the spaxels in the final E+A sample were post-starburst.
-
4.
Almost all galaxies in our sample have a color between 2 and 2.5, and masses , which places almost all of our sample in the green valley.
-
5.
Using HyperLEDA for morphology, we find a rich range of morphologies, with over half being S0.
-
6.
Our final sample of 30 galaxies represents a well-defined population of post-starburst objects, with specific criteria to define them as E+A. The properties of these galaxies in terms of active galactic nuclei, spatial ionization maps, and their diagnostic role in galaxy evolution, will be further explored in future work.
Acknowledgements
This work was supported by the National Science Foundation via Grant No.: 1460939 to the Physical Sciences REU program at the American Museum of Natural History, by the Alfred P. Sloan Foundation via the SDSS-IV Faculty and Student Team (FAST) initiative, ARC Agreement No.SSP483, and by the NSF via Grant AST-1460860, both to the CUNY College of Staten Island, and the CUNY College of Staten Island Academic Affairs Office for the initial work done in the summer of 2016. Funding for the Sloan Digital Sky Survey IV has been provided by the Alfred P. Sloan Foundation, the U.S. Department of Energy Office of Science, and the Participating Institutions. SDSS-IV acknowledges support and resources from the Center for High-Performance Computing at the University of Utah. The SDSS web site is www.sdss.org.
SDSS-IV is managed by the Astrophysical Research Consortium for the Participating Institutions of the SDSS Collaboration including the Brazilian Participation Group, the Carnegie Institution for Science, Carnegie Mellon University, the Chilean Participation Group, the French Participation Group, Harvard-Smithsonian Center for Astrophysics, Instituto de Astrofísica de Canarias, The Johns Hopkins University, Kavli Institute for the Physics and Mathematics of the Universe (IPMU) / University of Tokyo, the Korean Participation Group, Lawrence Berkeley National Laboratory, Leibniz Institut für Astrophysik Potsdam (AIP), Max-Planck-Institut für Astronomie (MPIA Heidelberg), Max-Planck-Institut für Astrophysik (MPA Garching), Max-Planck-Institut für Extraterrestrische Physik (MPE), National Astronomical Observatories of China, New Mexico State University, New York University, University of Notre Dame, Observatário Nacional / MCTI, The Ohio State University, Pennsylvania State University, Shanghai Astronomical Observatory, United Kingdom Participation Group, Universidad Nacional Autónoma de México, University of Arizona, University of Colorado Boulder, University of Oxford, University of Portsmouth, University of Utah, University of Virginia, University of Washington, University of Wisconsin, Vanderbilt University, and Yale University.
We would also like to acknowledge the undergraduate student collaboration MOONJAM: Julia Falcone, Olivia James, Allen Liu, Nicole Wallack, and Muhammad Wally for their dedication in finding a complete sample of E+A galaxies, by eye, in MaNGA. Finally, a special acknowledgement to The Fisk-Vanderbilt Master’s to PhD Program, Sam Dunham of Vanderbilt University, Dr. Andrew Johnson of Oxbridge Academy, Eric Vandernoot of Florida Atlantic University, and Shaun Greene for scientific advisement and support throughout this project.
References
- Aguado et al. (2019) Aguado, D. S., Ahumada, R., Almeida, A., et al. 2019, ApJS, 240, 23, doi: 10.3847/1538-4365/aaf651
- Alatalo et al. (2016a) Alatalo, K., Cales, S. L., Rich, J. A., et al. 2016a, ApJS, 224, 38, doi: 10.3847/0067-0049/224/2/38
- Alatalo et al. (2016b) Alatalo, K., Lisenfeld, U., Lanz, L., et al. 2016b, ApJ, 827, 106, doi: 10.3847/0004-637X/827/2/106
- Ardila et al. (2018) Ardila, F., Alatalo, K., Lanz, L., et al. 2018, ApJ, 863, 28, doi: 10.3847/1538-4357/aad0a3
- Baldwin et al. (1981) Baldwin, J. A., Phillips, M. M., & Terlevich, R. 1981, PASP, 93, 5, doi: 10.1086/130766
- Barger et al. (1996) Barger, A. J., Aragon-Salamanca, A., Ellis, R. S., et al. 1996, MNRAS, 279, 1, doi: 10.1093/mnras/279.1.1
- Baron et al. (2018) Baron, D., Netzer, H., Prochaska, J. X., et al. 2018, MNRAS, 480, 3993, doi: 10.1093/mnras/sty2113
- Belfiore et al. (2015) Belfiore, F., Maiolino, R., Bundy, K., et al. 2015, MNRAS, 449, 867, doi: 10.1093/mnras/stv296
- Belfiore et al. (2019) Belfiore, F., Westfall, K. B., Schaefer, A., et al. 2019, AJ, 158, 160, doi: 10.3847/1538-3881/ab3e4e
- Blake et al. (2004) Blake, C., Pracy, M. B., Couch, W. J., et al. 2004, MNRAS, 355, 713, doi: 10.1111/j.1365-2966.2004.08351.x
- Blanton et al. (2017) Blanton, M. R., Bershady, M. A., Abolfathi, B., et al. 2017, AJ, 154, 28, doi: 10.3847/1538-3881/aa7567
- Bundy et al. (2015) Bundy, K., Bershady, M. A., Law, D. R., et al. 2015, ApJ, 798, 7, doi: 10.1088/0004-637X/798/1/7
- Bundy et al. (2015) Bundy, K., Bershady, M. A., Law, D. R., et al. 2015, The Astrophysical Journal (ApJ), 798, 24
- Caldwell et al. (1999) Caldwell, N., Rose, J. A., & Dendy, K. 1999, AJ, 117, 140, doi: 10.1086/300679
- Caldwell et al. (1993) Caldwell, N., Rose, J. A., Sharples, R. M., Ellis, R. S., & Bower, R. G. 1993, AJ, 106, 473, doi: 10.1086/116656
- Charlot & Silk (1994) Charlot, S., & Silk, J. 1994, ApJ, 432, 453, doi: 10.1086/174584
- Chen et al. (2019) Chen, Y.-M., Shi, Y., Wild, V., et al. 2019, MNRAS, 489, 5709, doi: 10.1093/mnras/stz2494
- Cherinka et al. (2018) Cherinka, B., Sánchez-Gallego, J., Andrews, B., & Brownstein, J. 2018, sdss/marvin: Marvin Beta 2.2.0, doi: 10.5281/zenodo.1146705
- Cid Fernandes et al. (2011) Cid Fernandes, R., Stasińska, G., Mateus, A., & Vale Asari, N. 2011, MNRAS, 413, 1687, doi: 10.1111/j.1365-2966.2011.18244.x
- Dressler & Gunn (1982) Dressler, A., & Gunn, J. E. 1982, ApJ, 263, 533, doi: 10.1086/160524
- Dressler & Gunn (1983) —. 1983, ApJ, 270, 7, doi: 10.1086/161093
- Drory et al. (2015a) Drory, N., MacDonald, N., Bershady, M. A., et al. 2015a, AJ, 149, 77, doi: 10.1088/0004-6256/149/2/77
- Drory et al. (2015b) —. 2015b, AJ, 149, 77, doi: 10.1088/0004-6256/149/2/77
- Eliche-Moral et al. (2018) Eliche-Moral, M. C., Rodríguez-Pérez, C., Borlaff, A., Querejeta, M., & Tapia, T. 2018, A&A, 617, A113, doi: 10.1051/0004-6361/201832911
- French et al. (2018a) French, K. D., Yang, Y., Zabludoff, A. I., & Tremonti, C. A. 2018a, ApJ, 862, 2, doi: 10.3847/1538-4357/aacb2d
- French et al. (2018b) French, K. D., Zabludoff, A. I., Yoon, I., et al. 2018b, ApJ, 861, 123, doi: 10.3847/1538-4357/aac8de
- Galaz (2000) Galaz, G. 2000, AJ, 119, 2118, doi: 10.1086/301334
- Goto (2007) Goto, T. 2007, Monthly Notices of the Royal Astronomical Society (MNRAS), 381, 187
- Goto et al. (2008) Goto, T., Kawai, A., Shimono, A., et al. 2008, MNRAS, 386, 1355, doi: 10.1111/j.1365-2966.2008.12916.x
- Guillochon et al. (2014) Guillochon, J., Manukian, H., & Ramirez-Ruiz, E. 2014, ApJ, 783, 23, doi: 10.1088/0004-637X/783/1/23
- Gunn et al. (2006) Gunn, J. E., Siegmund, W. A., Mannery, E. J., et al. 2006, AJ, 131, 2332, doi: 10.1086/500975
- Klitsch et al. (2017) Klitsch, A., Zwaan, M. A., Kuntschner, H., et al. 2017, A&A, 600, A80, doi: 10.1051/0004-6361/201527922
- Kollatschny & Fricke (1989) Kollatschny, W., & Fricke, K. J. 1989, in IAU Symposium, Vol. 134, Active Galactic Nuclei, ed. D. E. Osterbrock & J. S. Miller, 449
- Lavery & Henry (1988) Lavery, R. J., & Henry, J. P. 1988, ApJ, 330, 596, doi: 10.1086/166496
- Law et al. (2015a) Law, D. R., Yan, R., Bershady, M. A., et al. 2015a, AJ, 150, 19, doi: 10.1088/0004-6256/150/1/19
- Law et al. (2015b) —. 2015b, AJ, 150, 19, doi: 10.1088/0004-6256/150/1/19
- Law et al. (2016a) Law, D. R., Cherinka, B., Yan, R., et al. 2016a, AJ, 152, 83, doi: 10.3847/0004-6256/152/4/83
- Law et al. (2016b) —. 2016b, AJ, 152, 83, doi: 10.3847/0004-6256/152/4/83
- Li et al. (2019) Li, Z., French, K. D., Zabludoff, A. I., & Ho, L. C. 2019, ApJ, 879, 131, doi: 10.3847/1538-4357/ab1f68
- Liu & Green (1996) Liu, C. T., & Green, R. F. 1996, ApJ, 458, L63, doi: 10.1086/309925
- Liu et al. (2007) Liu, C. T., Hooper, E. J., O’Neil, K., et al. 2007, ApJ, 658, 249, doi: 10.1086/511328
- Liu & Kennicutt (1995a) Liu, C. T., & Kennicutt, Robert C., J. 1995a, ApJS, 100, 325, doi: 10.1086/192222
- Liu & Kennicutt (1995b) —. 1995b, ApJ, 450, 547, doi: 10.1086/176165
- Makarov et al. (2014) Makarov, D., Prugniel, P., Terekhova, N., Courtois, H., & Vauglin, I. 2014, A&A, 570, A13, doi: 10.1051/0004-6361/201423496
- Marinelli et al. (2020) Marinelli, M., Greene, O., Riffel, R. A., Rowlands, K., & Liu, C. T. 2020, Research Notes of the American Astronomical Society, 4, 110, doi: 10.3847/2515-5172/aba595
- Mendel et al. (2014) Mendel, J. T., Simard, L., Palmer, M., Ellison, S. L., & Patton, D. R. 2014, ApJS, 210, 3, doi: 10.1088/0067-0049/210/1/3
- Meusinger et al. (2016) Meusinger, H., Bruenecke, J., Schalldach, P., & in der, A. A. 2016, VizieR Online Data Catalog, 359
- Mockler et al. (2019) Mockler, B., Guillochon, J., & Ramirez-Ruiz, E. 2019, ApJ, 872, 151, doi: 10.3847/1538-4357/ab010f
- Newberry et al. (1990) Newberry, M. V., Boroson, T. A., & Kirshner, R. P. 1990, ApJ, 350, 585, doi: 10.1086/168413
- Nielsen et al. (2012) Nielsen, D. M., Ridgway, S. E., De Propris, R., & Goto, T. 2012, ApJ, 761, L16, doi: 10.1088/2041-8205/761/2/L16
- Oegerle et al. (1991) Oegerle, W. R., Hill, J. M., & Hoessel, J. G. 1991, ApJ, 381, L9, doi: 10.1086/186184
- Pawlik et al. (2018) Pawlik, M. M., Taj Aldeen, L., Wild, V., et al. 2018, MNRAS, 477, 1708, doi: 10.1093/mnras/sty589
- Penny et al. (2017) Penny, S. J., Masters, K. L., Smethurst, R., et al. 2017, doi: 10.1093/mnras/sty202
- Pracy et al. (2014) Pracy, M. B., Owers, M. S., Zwaan, M., et al. 2014, MNRAS, 443, 388, doi: 10.1093/mnras/stu1103
- Pracy et al. (2013) Pracy, M. B., Croom, S., Sadler, E., et al. 2013, MNRAS, 432, 3131, doi: 10.1093/mnras/stt666
- Quillen et al. (1999) Quillen, A. C., Rieke, G. H., Rieke, M. J., Caldwell, N., & Engelbracht, C. W. 1999, ApJ, 518, 632, doi: 10.1086/307307
- Schawinski et al. (2014) Schawinski, K., Urry, C. M., Simmons, B. D., et al. 2014, MNRAS, 440, 889, doi: 10.1093/mnras/stu327
- Sharples et al. (1985) Sharples, R. M., Ellis, R. S., Couch, W. J., & Gray, P. M. 1985, MNRAS, 212, 687, doi: 10.1093/mnras/212.3.687
- Smee et al. (2013) Smee, S. A., Gunn, J. E., Uomoto, A., et al. 2013, AJ, 146, 32, doi: 10.1088/0004-6256/146/2/32
- Smercina et al. (2018) Smercina, A., Smith, J. D. T., Dale, D. A., et al. 2018, ApJ, 855, 51, doi: 10.3847/1538-4357/aaafcd
- Smethurst et al. (2015) Smethurst, R. J., Lintott, C. J., Simmons, B. D., et al. 2015, MNRAS, 450, 435, doi: 10.1093/mnras/stv161
- Wake et al. (2017) Wake, D. A., Bundy, K., Diamond-Stanic, A. M., et al. 2017, AJ, 154, 86, doi: 10.3847/1538-3881/aa7ecc
- Wei et al. (2018) Wei, P., Gu, Y., Brotherton, M. S., Shi, Y., & Chen, Y. 2018, ApJ, 857, 27, doi: 10.3847/1538-4357/aab499
- Westfall et al. (2019) Westfall, K. B., Cappellari, M., Bershady, M. A., et al. 2019, AJ, 158, 231, doi: 10.3847/1538-3881/ab44a2
- Wild et al. (2009) Wild, V., JakobWalcher, C., Johansson, P. H., et al. 2009, Monthly Notices of the Royal Astronomical Society (MNRAS), 395, 144–159
- Wilkinson et al. (2017) Wilkinson, C. L., Pimbblet, K. A., & Stott, J. P. 2017, MNRAS, 472, 1447, doi: 10.1093/mnras/stx2034
- Wilkinson et al. (2015) Wilkinson, D. M., Maraston, C., Thomas, D., et al. 2015, Monthly Notices of the Royal Astronomical Society (MNRAS), 449, 328
- Yamauchi et al. (2008) Yamauchi, C., Yagi, M., & Goto, T. 2008, MNRAS, 390, 383, doi: 10.1111/j.1365-2966.2008.13756.x
- Yan et al. (2015) Yan, R., Sánchez-Gallego, J. R., Zhang, K., et al. 2015, Physics and Astronomy Faculty Publications, 332
- Yan et al. (2016a) Yan, R., Tremonti, C., Bershady, M. A., et al. 2016a, AJ, 151, 8, doi: 10.3847/0004-6256/151/1/8
- Yan et al. (2016b) Yan, R., Bundy, K., Law, D. R., et al. 2016b, AJ, 152, 197, doi: 10.3847/0004-6256/152/6/197
- Yan et al. (2016c) Yan, R., Tremonti, C., Bershady, M. A., et al. 2016c, AJ, 151, 8, doi: 10.3847/0004-6256/151/1/8
- Yang et al. (2015) Yang, H.-F., Luo, A.-L., Chen, X.-Y., et al. 2015, Research in Astronomy and Astrophysics (RAA), 15, 1414–1423
- Zabludoff et al. (1996) Zabludoff, A. I., Zaritsky, D., Lin, H., et al. 1996, ApJ, 466, 104, doi: 10.1086/177495
- Zwaan et al. (2013) Zwaan, M. A., Kuntschner, H., Pracy, M. B., & Couch, W. J. 2013, MNRAS, 432, 492, doi: 10.1093/mnras/stt496
Appendix A SPECTRAL SYNTHESIS DIAGRAMS
The following appendix provides, for each galaxy in our sample, the visual image gathered from Marvin, the single-fiber spectrum from SDSS, and the diagnostic and spatially resolved WHAN diagrams and normalized summed spaxel spectrum created by this team– each identified by the galaxy’s MaNGA ID and PLATE-IFU. We would also like to note how that we are, for a future paper, investigating the likelihood that the ionization ratios present in the WHAN diagrams of the galaxies are produced by shocks or AGN.
[MaNGA ID: 12-98126 — PLATE-IFU: 7443-12701]
![[Uncaptioned image]](/html/2106.15613/assets/7443-12701vis.png)
![[Uncaptioned image]](/html/2106.15613/assets/7443-12701.png)
![[Uncaptioned image]](/html/2106.15613/assets/7443-12701_WHAN.png)
![[Uncaptioned image]](/html/2106.15613/assets/7443-12701_Sharing_Normed_ReSpectra.png)
[MaNGA ID: 12-49536 — PLATE-IFU: 7443-1902]
![[Uncaptioned image]](/html/2106.15613/assets/7443-1902vis.png)
![[Uncaptioned image]](/html/2106.15613/assets/7443-1902.png)
![[Uncaptioned image]](/html/2106.15613/assets/7443-1902_WHAN.png)
![[Uncaptioned image]](/html/2106.15613/assets/7443-1902_Sharing_Normed_ReSpectra.png)
[MaNGA ID: 1-24124 — PLATE-IFU: 7991-3703]
![[Uncaptioned image]](/html/2106.15613/assets/7991-3703vis.png)
![[Uncaptioned image]](/html/2106.15613/assets/7991-3703.png)
![[Uncaptioned image]](/html/2106.15613/assets/7991-3703_WHAN.png)
![[Uncaptioned image]](/html/2106.15613/assets/7991-3703_Sharing_Normed_ReSpectra.png)
[MaNGA ID: 1-37034 — PLATE-IFU: 8077-1901]
![[Uncaptioned image]](/html/2106.15613/assets/8077-1901vis.png)
![[Uncaptioned image]](/html/2106.15613/assets/8077-1901.png)
![[Uncaptioned image]](/html/2106.15613/assets/8077-1901_WHAN.png)
![[Uncaptioned image]](/html/2106.15613/assets/8077-1901_Sharing_Normed_ReSpectra.png)
[MaNGA ID: 1-109112 — PLATE-IFU: 8078-1901]
![[Uncaptioned image]](/html/2106.15613/assets/8078-1901vis.png)
![[Uncaptioned image]](/html/2106.15613/assets/8078-1901.png)
![[Uncaptioned image]](/html/2106.15613/assets/8078-1901_WHAN.png)
![[Uncaptioned image]](/html/2106.15613/assets/8078-1901_Sharing_Normed_ReSpectra.png)
[MaNGA ID: 1-38374 — PLATE-IFU: 8082-3704]
![[Uncaptioned image]](/html/2106.15613/assets/8082-3704vis.png)
![[Uncaptioned image]](/html/2106.15613/assets/8082-3704.png)
![[Uncaptioned image]](/html/2106.15613/assets/8082-3704_WHAN.png)
![[Uncaptioned image]](/html/2106.15613/assets/8082-3704_Sharing_Normed_ReSpectra.png)
[MaNGA ID: 1-201180 — PLATE-IFU: 8145-6102]
![[Uncaptioned image]](/html/2106.15613/assets/8145-6102vis.png)
![[Uncaptioned image]](/html/2106.15613/assets/8145-6102.png)
![[Uncaptioned image]](/html/2106.15613/assets/8145-6102_WHAN.png)
![[Uncaptioned image]](/html/2106.15613/assets/8145-6102_Sharing_Normed_ReSpectra.png)
[MaNGA ID: 1-560826 — PLATE-IFU: 8315-3703]
![[Uncaptioned image]](/html/2106.15613/assets/8315-3703vis.png)
![[Uncaptioned image]](/html/2106.15613/assets/8315-3703.png)
![[Uncaptioned image]](/html/2106.15613/assets/8315-3703_Sharing_Normed_ReSpectra.png)
[MaNGA ID: 1-235582 — PLATE-IFU: 8326-3704]
![[Uncaptioned image]](/html/2106.15613/assets/8326-3704vis.png)
![[Uncaptioned image]](/html/2106.15613/assets/8326-3704.png)
![[Uncaptioned image]](/html/2106.15613/assets/8326-3704_WHAN.png)
![[Uncaptioned image]](/html/2106.15613/assets/8326-3704_Sharing_Normed_ReSpectra.png)
[MaNGA ID: 1-266298 — PLATE-IFU: 8333-1901]
![[Uncaptioned image]](/html/2106.15613/assets/8333-1901vis.png)
![[Uncaptioned image]](/html/2106.15613/assets/8333-1901.png)
![[Uncaptioned image]](/html/2106.15613/assets/8333-1901_WHAN.png)
![[Uncaptioned image]](/html/2106.15613/assets/8333-1901_Sharing_Normed_ReSpectra.png)
[MaNGA ID: 1-489884 — PLATE-IFU: 8338-9102]
![[Uncaptioned image]](/html/2106.15613/assets/8338-9102vis.png)
![[Uncaptioned image]](/html/2106.15613/assets/8338-9102.png)
![[Uncaptioned image]](/html/2106.15613/assets/8338-9102_WHAN.png)
![[Uncaptioned image]](/html/2106.15613/assets/8338-9102_Sharing_Normed_ReSpectra.png)
[MaNGA ID: 1-209078 — PLATE-IFU: 8486-3702]
![[Uncaptioned image]](/html/2106.15613/assets/8486-3702vis.png)
![[Uncaptioned image]](/html/2106.15613/assets/8486-3702.png)
![[Uncaptioned image]](/html/2106.15613/assets/8486-3702_WHAN.png)
![[Uncaptioned image]](/html/2106.15613/assets/8486-3702_Sharing_Normed_ReSpectra.png)
[MaNGA ID: 1-92638 — PLATE-IFU: 8548-1901]
![[Uncaptioned image]](/html/2106.15613/assets/8548-1901vis.png)
![[Uncaptioned image]](/html/2106.15613/assets/8548-1901.png)
![[Uncaptioned image]](/html/2106.15613/assets/8548-1901_WHAN.png)
![[Uncaptioned image]](/html/2106.15613/assets/8548-1901_Sharing_Normed_ReSpectra.png)
[MaNGA ID: 1-90984 — PLATE-IFU: 8553-3701]
![[Uncaptioned image]](/html/2106.15613/assets/8553-3701vis.png)
![[Uncaptioned image]](/html/2106.15613/assets/8553-3701.png)
![[Uncaptioned image]](/html/2106.15613/assets/8553-3701_WHAN.png)
![[Uncaptioned image]](/html/2106.15613/assets/8553-3701_Sharing_Normed_ReSpectra.png)
[MaNGA ID: 1-90176 — PLATE-IFU: 8553-6101]
![[Uncaptioned image]](/html/2106.15613/assets/8553-6101vis.png)
![[Uncaptioned image]](/html/2106.15613/assets/8553-6101.png)
![[Uncaptioned image]](/html/2106.15613/assets/8553-6101_WHAN.png)
![[Uncaptioned image]](/html/2106.15613/assets/8553-6101_Sharing_Normed_ReSpectra.png)
[MaNGA ID: 1-95093 — PLATE-IFU: 8588-3704]
![[Uncaptioned image]](/html/2106.15613/assets/8588-3704vis.png)
![[Uncaptioned image]](/html/2106.15613/assets/8588-3704.png)
![[Uncaptioned image]](/html/2106.15613/assets/8588-3704_WHAN.png)
![[Uncaptioned image]](/html/2106.15613/assets/8588-3704_Sharing_Normed_ReSpectra.png)
[MaNGA ID: 1-178823 — PLATE-IFU: 8623-9102]
![[Uncaptioned image]](/html/2106.15613/assets/8623-9102vis.png)
![[Uncaptioned image]](/html/2106.15613/assets/8623-9102.png)
![[Uncaptioned image]](/html/2106.15613/assets/8623-9102_WHAN.png)
![[Uncaptioned image]](/html/2106.15613/assets/8623-9102_Sharing_Normed_ReSpectra.png)
[MaNGA ID: 1-29809 — PLATE-IFU: 8655-1902]
![[Uncaptioned image]](/html/2106.15613/assets/8655-1902vis.png)
![[Uncaptioned image]](/html/2106.15613/assets/8655-1902.png)
![[Uncaptioned image]](/html/2106.15613/assets/8655-1902_WHAN.png)
![[Uncaptioned image]](/html/2106.15613/assets/8655-1902_Sharing_Normed_ReSpectra.png)
[MaNGA ID: 1-456935 — PLATE-IFU: 8931-12705]
![[Uncaptioned image]](/html/2106.15613/assets/8931-12705vis.png)
![[Uncaptioned image]](/html/2106.15613/assets/8931-12705.png)
![[Uncaptioned image]](/html/2106.15613/assets/8931-12705_WHAN.png)
![[Uncaptioned image]](/html/2106.15613/assets/8931-12705_Sharing_Normed_ReSpectra.png)
[MaNGA ID: 1-456434 — PLATE-IFU: 8931-3701]
![[Uncaptioned image]](/html/2106.15613/assets/8931-3701vis.png)
![[Uncaptioned image]](/html/2106.15613/assets/8931-3701.png)
![[Uncaptioned image]](/html/2106.15613/assets/8931-3701_WHAN.png)
![[Uncaptioned image]](/html/2106.15613/assets/8931-3701_Sharing_Normed_ReSpectra.png)
[MaNGA ID: 1-456380 — PLATE-IFU: 8934-3704]
![[Uncaptioned image]](/html/2106.15613/assets/8934-3704vis.png)
![[Uncaptioned image]](/html/2106.15613/assets/8934-3704.png)
![[Uncaptioned image]](/html/2106.15613/assets/8934-3704_WHAN.png)
![[Uncaptioned image]](/html/2106.15613/assets/8934-3704_Sharing_Normed_ReSpectra.png)
[MaNGA ID: 1-457004 — PLATE-IFU: 8934-9101]
![[Uncaptioned image]](/html/2106.15613/assets/8934-9101vis.png)
![[Uncaptioned image]](/html/2106.15613/assets/8934-9101.png)
![[Uncaptioned image]](/html/2106.15613/assets/8934-9101_WHAN.png)
![[Uncaptioned image]](/html/2106.15613/assets/8934-9101_Sharing_Normed_ReSpectra.png)
[MaNGA ID: 1-230177 — PLATE-IFU: 8942-6101]
![[Uncaptioned image]](/html/2106.15613/assets/8942-6101vis.png)
![[Uncaptioned image]](/html/2106.15613/assets/8942-6101.png)
![[Uncaptioned image]](/html/2106.15613/assets/8942-6101_WHAN.png)
![[Uncaptioned image]](/html/2106.15613/assets/8942-6101_Sharing_Normed_ReSpectra.png)
[MaNGA ID: 1-456635 — PLATE-IFU: 8949-3701]
![[Uncaptioned image]](/html/2106.15613/assets/8949-3701vis.png)
![[Uncaptioned image]](/html/2106.15613/assets/8949-3701.png)
![[Uncaptioned image]](/html/2106.15613/assets/8949-3701_WHAN.png)
![[Uncaptioned image]](/html/2106.15613/assets/8949-3701_Sharing_Normed_ReSpectra.png)
[MaNGA ID: 1-456505 — PLATE-IFU: 8950-3702]
![[Uncaptioned image]](/html/2106.15613/assets/8950-3702vis.png)
![[Uncaptioned image]](/html/2106.15613/assets/8950-3702.png)
![[Uncaptioned image]](/html/2106.15613/assets/8950-3702_WHAN.png)
![[Uncaptioned image]](/html/2106.15613/assets/8950-3702_Sharing_Normed_ReSpectra.png)
[MaNGA ID: 1-456744 — PLATE-IFU: 8950-3704]
![[Uncaptioned image]](/html/2106.15613/assets/8950-3704vis.png)
![[Uncaptioned image]](/html/2106.15613/assets/8950-3704.png)
![[Uncaptioned image]](/html/2106.15613/assets/8950-3704_WHAN.png)
![[Uncaptioned image]](/html/2106.15613/assets/8950-3704_Sharing_Normed_ReSpectra.png)
[MaNGA ID: — PLATE-IFU: 8950-6101]
![[Uncaptioned image]](/html/2106.15613/assets/8950-6101vis.png)
![[Uncaptioned image]](/html/2106.15613/assets/8950-6101.png)
![[Uncaptioned image]](/html/2106.15613/assets/8950-6101_WHAN.png)
![[Uncaptioned image]](/html/2106.15613/assets/8950-6101_Sharing_Normed_ReSpectra.png)
[MaNGA ID: 1-210114 — PLATE-IFU: 8979-1902]
![[Uncaptioned image]](/html/2106.15613/assets/8979-1902vis.png)
![[Uncaptioned image]](/html/2106.15613/assets/8979-1902.png)
![[Uncaptioned image]](/html/2106.15613/assets/8979-1902_WHAN.png)
![[Uncaptioned image]](/html/2106.15613/assets/8979-1902_Sharing_Normed_ReSpectra.png)
[MaNGA ID: 1-135235 — PLATE-IFU: 9029-1901]
![[Uncaptioned image]](/html/2106.15613/assets/9029-1901vis.png)
![[Uncaptioned image]](/html/2106.15613/assets/9029-1901.png)
![[Uncaptioned image]](/html/2106.15613/assets/9029-1901_WHAN.png)
![[Uncaptioned image]](/html/2106.15613/assets/9029-1901_Sharing_Normed_ReSpectra.png)
[MaNGA ID: 1-264510 — PLATE-IFU: 9041-1902]
![[Uncaptioned image]](/html/2106.15613/assets/9041-1902vis.png)
![[Uncaptioned image]](/html/2106.15613/assets/9041-1902.png)
![[Uncaptioned image]](/html/2106.15613/assets/9041-1902_WHAN.png)
![[Uncaptioned image]](/html/2106.15613/assets/9041-1902_Sharing_Normed_ReSpectra.png)