Correlation Between Spin and Orbital Dynamics During Laser-Induced Femtosecond Demagnetization
Abstract
Spin and orbital angular momenta are two intrinsic properties of an electron and are responsible for the physics of a solid. How the spin and orbital evolve with respect to each other on several hundred femtoseconds is largely unknown, but it is at the center of laser-induced ultrafast demagnetization. In this paper, we introduce a concept of the spin-orbital correlation diagram, where spin angular momentum is plotted against orbital angular momentum, much like the position-velocity phase diagram in classical mechanics. We use four sets of highly accurate time-resolved x-ray magnetic circular dichroism (TR-XMCD) data to construct four correlation diagrams for iron and cobalt. To our surprise, a pattern emerges. The trace on the correlation diagram for iron is an arc, and at the end of demagnetization, it has a pronounced cusp. The correlation diagram for cobalt is different and appears more linear, but with kinks. We carry out first-principles calculations with two different methods: time-dependent density functional theory (TDDFT) and time-dependent Liouville density functional theory (TDLDFT). These two methods agree that the experimental findings for both Fe and Co are not due to experimental errors. It is the spin-orbit coupling that correlates the spin dynamics to the orbital dynamics. Microscopically, Fe and Co have different orbital occupations, which leads to distinctive correlation diagrams. We believe that this correlation diagram presents a useful tool to better understand spin and orbital dynamics on an ultrafast time scale. A brief discussion on the magnetic anisotropy energy is also provided.
pacs:
75.40.Gb, 78.20.Ls, 75.70.-i, 78.47.J-I Introduction
The last two decades have seen enormous development in laser-induced ultrafast demagnetization on the femtosecond time scale.eschenlohr2021 ; ourbook Beaurepaire et al. eric in their pioneering experiment demonstrated that an ultrashort laser pulse, without an external magnetic field, could demagnetize a ferromagnet within 1 ps. Under optical excitation, the orbital degree of the electron is first excited, but most earlier experiments did not detect orbital dynamics,chen2019 ; siegrist2019 ; tengdin2018 ; kampfrath2011 ; koopmans2010 ; mathias2012 ; wietstruk2011 though theoretically it is long known that both the orbital angular momentum (OAM) and spin angular momentum (SAM) are important.prl00 ; mingsu2015 ; tows2015 ; gariglio2019 Accurate measurements of OAM are recent. The first of such measurement was done by Bartelt et al. bartelt2007 in Fe/Gd multilayers, where they employed time-resolved x-ray magnetic circular dichroism (TR-XMCD) to detect the spin and orbital momenta at Fe’s edge. The orbital moment reduces earlier. Boeglin et al. boeglin2010 employed a circularly-polarized femtosecond x-ray pulse to measure both spin and orbital angular momenta of Co at its edge (between 780 and 800 eV) in a 15-nm Co0.5Pd0.5 film and revealed that spin and orbital show different dynamics. The orbital decreases faster than the spin by 60 fs, and the ratio of orbital-to-spin changes with time. Stamm et al. stamm2010 carried out a difficult measurement of spin and orbital angular momenta of a thin Ni film and found that OAM and SAM reduce within 130 fs, and the spin-orbit interaction increases by . Four years later, Bergeard et al. bergeard2014 employed TR-XMCD to measure both spin and orbital angular momenta in Co but in Co0.8Gd0.2 and Co0.74Tb0.26 films. They also found a difference between spin and orbital dynamics, but this does not mean that spin and orbital dynamics are independent. Instead, they showed the ratio of orbital to spin has a well-defined trace, within the experimental error. However, the data in Co0.74Tb0.26 are much noisier than those in Co0.8Gd0.2. Hennecke et al. hennecke2019 measured OAM and SAM of Fe at the edge in a ferrimagnetic Gd25.3Fe65.4Co9.3 film and found that OAM and SAM decrease equally in magnitude and speed. However, their ratio jumps significantly and does not follow a clear trend, very different from Co.bergeard2014 Up to now, there is no consistent understanding of the interesting experimental features.
In this paper, we introduce the simple concept of a spin-orbital correlation diagram, so even a minute change in OAM and SAM can be caught on the same graph. As a result, time evolutions of the spin and orbital leave a single path on the correlation diagram. We first test this on two sets of experimental data for Fe in two different compounds.bartelt2007 ; hennecke2019 The results are interesting and surprising. The spin-orbital correlation diagram produces a simple picture even when experimental data are noisy. The trace of SAM and of OAM on the diagram is an arc, and close to the end of demagnetization, both have a cusp. These features were evidently unknown to those researchers. Then we apply the correlation diagram to another two sets of data for Co boeglin2010 ; bergeard2014 and find that cobalt’s spin-orbital correlation diagram is very different. It appears more linear and has kinks. When we try the correlation diagram on Ni,stamm2010 the diagram senses a significant experimental uncertainty in the data because of its small OAM. To establish our concept, we carry out two independent first-principles calculations. One is based on time-dependent density functional theory, and the other is based on time-dependent Liouville density functional theory which has an additional self-consistent step. They both show that there is a kink on the spin-orbital correlation diagram for hcp Co. These kinks are from the orbital character change during laser excitation, as shown in the density of states. Then we take another ferromagnetic alloy FeNi3 as an example. Our calculation indeed reproduces the arc and cusp for Fe as observed experimentally. These agreements suggest that it is highly likely that such a correlation between OAM and SAM exists in nature. We believe that the spin-orbital correlation diagram is a useful tool for experimentalists and theoreticians, and presents a new perspective for ultrafast spin and orbital dynamics for future research,
The rest of the paper is arranged as follows. In Sec. II, we present the theoretical formalism on TDDFT and TDLDFT. Section III is devoted to the results. The first part is devoted to the experimental results, and the second part is for the theoretical results. We conclude the paper in Sec. IV.
II Theoretical formalism
We employ two different methods to compute the orbital and spin dynamics, each of which is based on the full-potential augmented plane wave method. This method is among the most accurate methods.
II.1 Time-dependent density functional theory
Since the beginning of time-dependent density functional theory (TDDFT),runge1984 ; burke2005 it has attracted enormous attention around the world. The key idea of TDDFT is that one can simply construct a noninteracting time-dependent single-particle potential that leads to -representable as uniquely determined. There is a similar one-to-one correspondence just like the ground state between and for a given initial many-body state .
The fundamental equation is the time-dependent Kohn-Sham equation,
| (1) |
where is the wavefunction for band . The Hamiltonian consists of
| (2) |
where the first term is the kinetic energy, is the laser vector potential, is the external potential interaction, i.e. crystal potential, is the Hartree potential, is the exchange-correlation potential, and is the spin-orbit coupling. Here, we use the time-dependent density functional theory as implemented in the ELK code.elk A nice feature of this code is that it uses the same method as Wien2k,wien2k so we can compare them easily.
In TDDFT, the charge density is computed by
| (3) |
where the electron occupation is unchanged during time propagation and fixed at the initial state occupation. In other words, if the state is initially occupied, it remains occupied to the end of the simulation. The change in the density is from the wavefunctions. Unoccupied state participation is indirect. If we include no unoccupied state, we have no dynamics, even under laser excitation. These unoccupied states contribute through the dipole or operator in equation (2). For this reason, one has to include a number of unoccupied states in the simulation, even though they do not contribute to . The change in density of states is computed by projecting on to the beginning wavefunction . In general, time propagation in TDDFT for a metallic system is expensive, and the ELK code is no exception. As will be seen below, we have to use an extremely strong and very short laser pulse.
II.2 Time-dependent Liouville density functional theory
An alternative to TDDFT is the time-dependent Liouville density functional theory (TDLDFT) that we developed.jpcm16 ; jpcm17c At each time step , we solve the Kohn-Sham equation self-consistently as the ground state calculation but on a constrained excited state potential,jpcm16
| (4) |
where and are, respectively, the eigenstate and eigenenergy of band and point. is determined by
| (5) |
where is the exchange-correlation potential, . The spin-orbit coupling is included through the second variational principle.wien2k We use the generalized gradient approximation for the exchange-correlation energy functional.
The density is computed from
| (6) |
where is the diagonal element of the density matrix and is also the electron occupation. Our occupation number is not fixed from the beginning, which is the first main difference between TDDFT and TDLDFT. Here is computed by solving the Liouville equation for a short time step ,jpcm16
| (7) |
where is the field-free Hamiltonian, and describes the interaction between the laser field and system. Here p is the electron momentum operator, and is the vector potential of laser. After this time step, we plug the new into equation (6) to generate a new charge density , so we can generate a new potential through equation (5) for equation (4) to start a new round of self-consistent calculation. This self-consistent step is another difference between TDDFT and TDLDFT. In general, the results from both methods are compatible .
III Results and discussions
III.1 Concept of spin-orbital correlation diagram
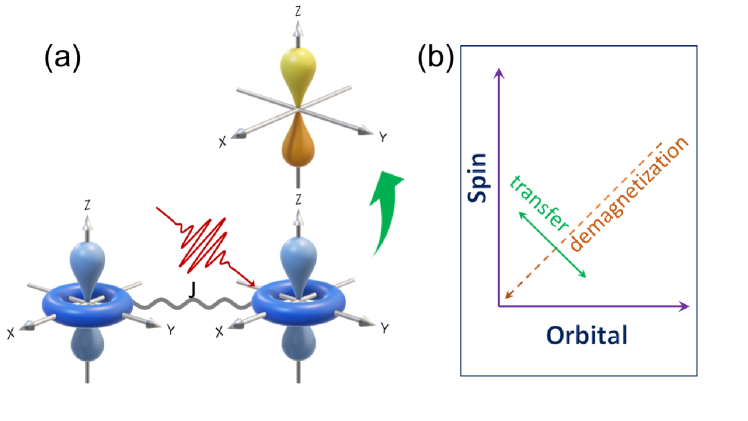
Optical excitation affects the orbital degree of freedom of an electron. Figure 1(a) schematically shows the orbital angular momentum change during a transition from a state to a state. Spins in each orbital are exchange-coupled and are also affected by lattice vibration. It is this entanglement that requires a joint study of both spin and orbital dynamics.oles2004 Figure 1(b) schematically outlines the key concept of the spin-orbital correlation diagram. For pure demagnetization (see the dashed arrow), both spin and orbital moments reduce, so their path has a positive slope. For pure angular momentum exchange (see the double arrow), the path is transverse, with a negative slope. The traditional Landé -factor is connected to the slope in this diagram through provided that the orbital moment is small.pelzl2003 In general, these paths are not straight. An intervention by lattice may distort them. Different experimental results can now be compared quantitatively, without any ambiguity.
In the following, we start from the existing experimental data to build a case that a possible correlation diagram between spin and orbital dynamics exists. Then we present our first-principles results to support this conclusion.
III.2 Experimental evidence
Decades of experimental research produce a significant amount of data for spin moment in various materials. However, most experiments did not measure orbital moments explicitly,chen2019 ; siegrist2019 ; tengdin2018 ; kampfrath2011 ; koopmans2010 ; mathias2012 ; wietstruk2011 and those which measured orbital moments have a large uncertainty.stamm2010 The situation changed with the more recent investigations.bartelt2007 ; boeglin2010 ; siegrist2019 ; hennecke2019 Bergeard et al. bergeard2014 measured both spin and orbital moments in Co0.8Gd0.2 accurately, with a much smaller error bar.
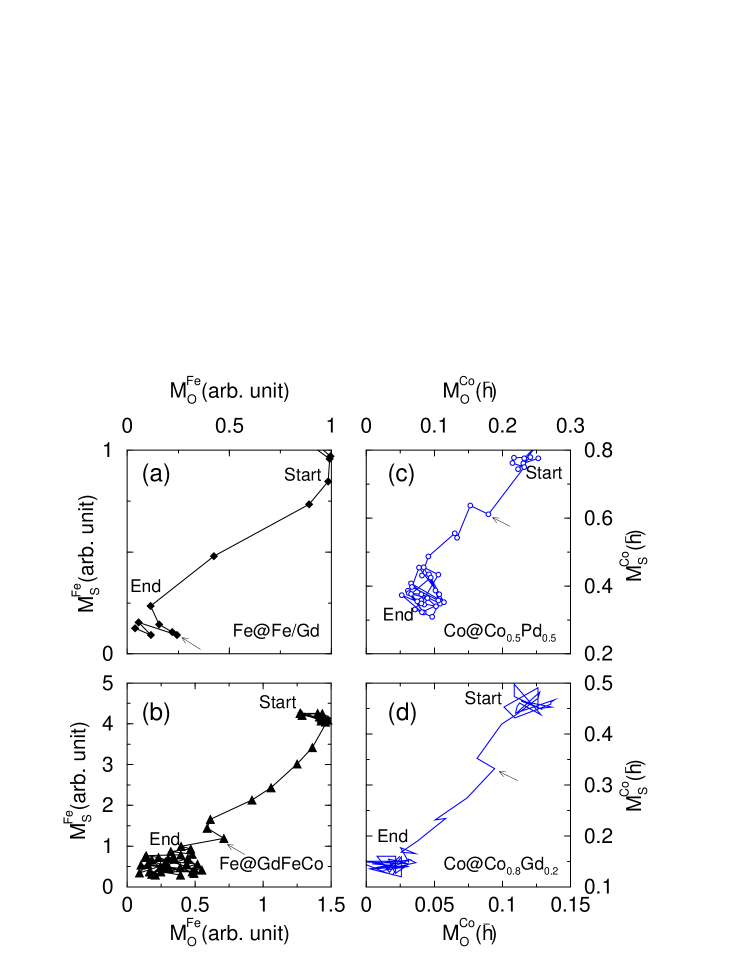
Figure 2 displays four experimental data of Fe and Co from four different materials. All the experimental data points are extracted from the original figures using WebPlotDigitizer.web WebPlotDigitizer is capable of digitizing any data. One only needs to set the and coordinates and the scale, and selects which part of the data needs to be extracted. To demonstrate the accuracy, we plot our extracted data against the original data and find excellent agreement. Figure 2(a) plots the spin moment versus orbital moment of the experiment done by Bartelt et al. bartelt2007 in Fe/Gd multilayers. Although their time resolution was 2 ps, their pump pulse duration was only 60 fs, which is comparable to our theoretical and other experimental durations. In addition, their time delay between the pump and probe pulses was only 200 fs, as estimated from their data points. For these two reasons, we do not expect that their limited time resolution has a big effect on the comparison with our theory and other experiments. A major effect could be be that their limited time resolution may smear out some details of the spin-orbital correlation. The starting time is at the upper right corner, and the ending time is at the lower left corner. This shows that the spin and orbital moments both reduce with time. But the spin-orbital trace in the correlation diagram is not linear, and in fact it forms an arc, with a cusp at the end of demagnetization, as highlighted by an arrow. This points out that there is a phase slip between the spin and orbital dynamics. Naturally, all experiments have errors, so we want to see whether these features survive in a different material. Figure 2(b) shows the spin-orbital correlation diagram for iron but in GdFeCo.hennecke2019 is an important material for all-optical spin switching.stanciu2007 Structurally, it is amorphous, quite different from Fe/Gd multilayers, yet the spin-orbital correlation diagram is very similar to that in Fe/Gd multilayers. One also sees the trace is an arc, though it curves upward and has a cusp close to the end of demagnetization. Nevertheless, these similarities could be simply coincident, so further experimental investigation on iron is necessary.
To see whether a similar pattern emerges in other elements, we plot two additional sets of experimental data but for cobalt. Figure 2(c) shows the spin-orbital correlation diagram for Co in .boeglin2010 Different from the above two experiments which uses the arbitrary units, Boeglin et al. provided the units () for SAM and OAM, which is very convenient for theoretical investigations. The spin-orbital trace for Co is qualitatively different from that for Fe. It appears more linear, but has kinks (see the arrow in the figure). When we plot the data from,bergeard2014 we notice a similar kink in (see figure 2(d)). The entire spin-orbital correlation diagram is similar. The experimental error in the figure is still slightly too big to make a conclusive statement, but these qualitative features are interesting. We next examine theoretically whether this correlation really exists.
III.3 Physical insights
Before we present our first-principles result, we would like to have a basic understanding of why the spin and orbital do not evolve with time independently. First of all, because of spin-orbit coupling, L is coupled to S through , where is the spin-orbit coupling. There is a torque on L due to S, and vice verse.
We consider a band state , which is a linear combination of orthonormalized orbitals ,mingsu2015
| (8) |
where is a spin state (spin up and spin down ), and is the time-dependent coefficient. Here we assume that the magnetic orbital quantum number is still a good quantum number for this example. The orbital and spin angular momenta are
| (9) | |||||
| (10) |
where is replaced by diagonal elements of the density matrix (occupation). One notices that the spin and orbital angular momenta share the same density matrix, but whether the spin and orbital change similarly or not sensitively depends on how and change with time. And this in turn depends on spin-orbit coupling. Equation (9) further reveals that the orbital is prone to the occupation change. Each occupation at has a counterpart at . Because they appear simultaneously in the same summation, this renders the orbital change more radical. By contrast, the spin term is insensitive to this rapid change in since does not appear in the summation explicitly, so the spin change is smoother. To directly understand the above experimental features, we carry out numerical calculations.
III.4 First-principles results
III.4.1 TDDFT results
To confirm the above experimental findings, we use the ELK code elk ; dewhurst2016 to carry out the time-dependent density functional calculation. However, a direct calculation in the time domain with the same magnetic material as the experimental study is difficult because of the complexity of the systems. For instance, GdFeCo is amorphous, which poses a serious challenge. However, from the above discussion, it is clear that the spin-orbital correlation diagram is highly element specific, where the same element in different compounds behaves similarly. We start with hcp Co.
The ELK code uses the full-potential augmented plane wave method, with the same basis functions as the Wien2k code.wien2k The ELK code solves the time-dependent Kohn-Sham equation in the real time domain. Both spin and orbital angular momenta are computed. Because a calculation with the same experimental laser parameter is extremely time consuming, here we employ an ultrashort, ultrastrong laser pulse. The frequency of the photon energy of our laser pulse is 0.03 a.u. (atomic unit), and the duration is 120 a.u. (atomic unit) or 2.9 fs. The vector potential amplitude is 250 a.u. (atomic unit), which corresponds to 137 mJ/cm2. 1 a.u. of the vector potential is or Vs/m. To convert the vector potential amplitude in a.u. to , we have , which is much stronger than we use below (). The -mesh is , which is also smaller than the mesh used below ().
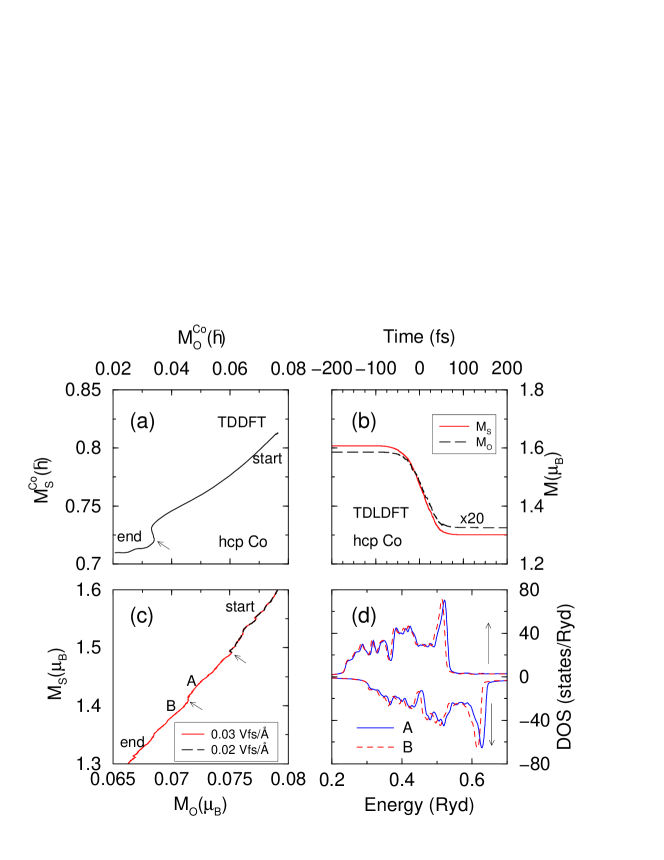
Our TDDFT results are shown in figure 3(a). The results start from the upper right corner and end at the lower left corner. A similar kink is found in the spin-orbital correlation diagram. This qualitatively agrees with the experimental findings in figures 2(c) and (d), but this result alone is not enough to prove the existence of the spin-orbital correlation.
III.4.2 TDLDFT results
We employ the time-dependent Liouville density functional theory with more realistic experimental laser pulses. We use a 60-fs pulse of eV and amplitude of 0.03 , more than 4 orders of magnitude smaller than our TDDFT pulse. Such a weak laser should induce a weaker kink. We plot the spin (solid line) and orbital (dashed line) moments as a function of time in figure 3(b). The result for the orbital moment is multiplied by 20 to have an easy view. One notices that both moments decrease similarly, but the orbital moment has multiple small steps along the path. This shows that the orbital moment is much more susceptible to the orbital character change (see equation (9)). To amplify the orbital change, in figure 3(c) we plot the spin-orbital correlation diagram. The data (solid line) starts from the upper right corner. The small steps in figure 3(b) now produce distinctive kinks, highlighted by arrows. A weaker laser field of 0.02 leads to a smaller kink (dashed line) that overlaps with the early portion of the trace of a strong field. These kinks are indeed smaller.
To understand how the state occupation affects the orbital moment change in Co as predicted by equation (9), we choose two points, A and B, in figure 3(c) before and after the second kink. We compute the density of states (DOS) at these two points. Figure 3(d) compares the majority DOS (positive axis) with the minority DOS (negative axis). We see that the majority and minority channels both have a significant change. There is a shift toward the lower energy at B with respect to A as time evolves. This shift is larger in the minority channel. This sudden change alters the orbital character of the states that contribute to the orbital moment and subsequently leads to the kink in the spin-orbital correlation diagram.
We now apply the same concept of the spin-orbital correlation diagram to FeNi3. Figure 4(a) shows that the spin-orbital trace for Fe in FeNi3 is an arc, similar to the experimental findings in figures 2(a) and 2(b). Interestingly, a cusp is also found in our theory (figure 4(a)). In other words, these key features are found in two experiments bartelt2007 ; hennecke2019 and our theory. This gives us confidence that the spin-orbital correlation diagram reveals a crucial connection between SAM and OAM. In figure 4(b), we plot the spin-orbital correlation diagram for Ni in FeNi3. One notices that the trace is linear. The experimental result from a prior study stamm2010 is very noisy (not shown), probably because the small orbital moment leads to a much larger error bar. If we compare our results among Fe, Co and Ni, we find that when there are more orbitals unoccupied, the orbital change is more radical as seen in Fe. But once they are filled up, there is not much room for change, so the spin-orbital trace in the correlation diagram is smoother. This demonstrates that our proposed spin-orbital diagram is element specific. We strongly believe that by looking into various magnetic systems, one may find the spin-orbital correlation diagram developed here useful for future experimental and theoretical investigations. For instance, the magnetic anisotropy energy (MAE) is directly related to the orbital and spin moments through ,bruno1989 as already noted before.boeglin2010 ; stamm2010 ; bergeard2014 Before laser excitation, treating as a perturbation, we have the MAE
| (11) |
where is the ground state and is the excited state, and and are their respective energies. And the orbital moment is
| (12) |
Comparing eq 11 with eq 12, one can see the structures of and are the same. If we choose just one excited state, . States that contribute strongly to or must have a same quantum number. For instance, if has a character, then must have a character, because in , regardless of its component, does not change the orbital angular momentum quantum number but maybe magnetic one if and are involved. Upon laser excitation, must change its by 1, say from a state to a state. This reduces , so both MAE and are reduced as well, which allows spins to deviate from their original preferred directions and induces demagnetization across the sample. This is consistent with our recent finding,mplb21 where spins in excited states tend to be disoriented.
IV Conclusion
We have introduced the concept of the spin-orbital correlation diagram for ultrafast spin and orbital dynamics, where spin angular momentum is plotted against orbital angular momentum. As time evolves, the spin and orbital moments leave a single distinctive trace. First, we use four different experiment data to show that there is strong experimental evidence that spin and orbital motions are correlated. Iron’s correlation diagram in both samples is an arc, with a distinct cusp. Each of these two features is reproduced in our time-dependent first-principles calculations. The experimental Co correlation diagram is different. The spin-orbital trace is more linear, but with a distinctive kink. This is again reproduced by our theoretical calculation. Microscopically, we find that the orbital character change in the density of states in both the spin majority and minority channels is directly responsible for these features found on the correlation diagram. As we go from Fe, Co to Ni, the more orbitals are occupied, so there is little room for orbital character change. This explains why in Ni, the trace in its correlation diagram is highly linear. This demonstrates a high degree of element specificity. This correlation diagram provides a new tool to disentangle complex spin and orbital dynamics for future research.
Acknowledgements.
This work was solely supported by the U.S. Department of Energy under Contract No. DE-FG02-06ER46304. Part of the work was done on Indiana State University’s quantum and obsidian clusters. The research used resources of the National Energy Research Scientific Computing Center, which is supported by the Office of Science of the U.S. Department of Energy under Contract No. DE-AC02-05CH11231. ∗guo-ping.zhang@outlook.com. https://orcid.org/0000-0002-1792-2701References
- (1) Eschenlohr, A. Spin Dynamics At Interfaces On Femtosecond Timescales. J. Phys.: Condens. Matter 2021, 33, 013001.
- (2) Zhang, G. P.; Lefkidis, G.; Murakami, M.; Hübner, W.; George, T. F. Introduction to Ultrafast Phenomena: From Femtosecond Magnetism to High-Harmonic Generation; CRC Press, Taylor & Francis Group: Boca Raton, Florida, 2021.
- (3) Beaurepaire, E.; Merle, J. C.; Daunois, A.; Bigot, J.-Y. Ultrafast Spin Dynamics In Ferromagnetic Nickel. Phys. Rev. Lett. 1996, 76, 4250.
- (4) Chen, J.; Bovensiepen, U.; Eschenlohr, A.; Müller, T.; Elliott, P.; Gross, E. K. U.; Dewhurst, J. K.; Sharma, S. Competing Spin Transfer And Dissipation At Co/Cu(001) Interfaces On Femtosecond Timescales. Phys. Rev. Lett. 2019, 122, 067202.
- (5) Siegrist, F.; Gessner, J. A.; Ossiander, M; Denker, C.; Chang, Y.-P.; Schröder, M. C.; Guggenmos, A.; Cui, Y.; Walowski, J.; Martens, U.; Dewhurst, J. K.; Kleineberg, U.; Münzenberg, M.; Sharma, S; Schultze, M. Light-wave Dynamic Control Of Magnetism. Nature 2019, 571, 240.
- (6) Tengdin, P.; You, W.; Chen, C.; Shi, X; Zusin, D.; Zhang, Y.; Gentry, C.; Blonsky, A; Keller, M.; Oppeneer, P. M.; Kapteyn, H. C.; Tao, Z.; Murnane, M. M. Critical Behavior Within 20 Fs Drives The Out-of-equilibrium Laser-induced Magnetic Phase Transition In Nickel. Sci. Adv. 2018, 4, eaap9744.
- (7) Kampfrath, T.; Sell, A.; Klatt, G.; Pashkin, A.; Mährlein, S.; Dekorsy, T.; Wolf, M.; Fiebig, M.; Leitenstorfer, A.; Huber, R. Coherent Terahertz Control Of Antiferromagnetic Spin Waves. Nat. Photonics 2011, 5, 31.
- (8) Koopmans, B.; Malinowski, G.; Longa, F. Dalla; Steiauf, D.; Fähnle, M.; Roth, T.; Cinchetti, M.; Aeschlimann, M. Explaining The Paradoxical Diversity Of Ultrafast Laser-induced Demagnetization. Nat. Mater. 2010, 9, 259.
- (9) Mathias, S.; La-O-Vorakiat, C.; Grychtol, P; Granitzka, P.; Turgut, E.; Shaw, J. M.; Adam, R.; Nembach, H. T.; Siemens, M. E.; Eich, S.; Schneider, C. M.; Silva, T. J.; M. Aeschlimann; Murnane, M. M.; Kapteyn, H. C. Probing The Timescale Of The Exchange Interaction In A Ferromagnetic Alloy. PNAS 2012, 109, 4792.
- (10) Wietstruk, M.; Melnikov, A.; Stamm, C.; Kachel, T.; Pontius, N.; Sultan, M.; Gahl, C.; Weinelt, M.; Dürr, H. A.; U. Bovensiepen, Hot-electron-driven Enhancement Of Spin-lattice Coupling In Gd And Tb Ferromagnets Observed By Femtosecond X-ray Magnetic Circular Dichroism. Phys. Rev. Lett. 2011, 106, 127401.
- (11) Zhang, G. P.; Hübner, W. Laser-induced Ultrafast Demagnetization In Ferromagnetic Metals. Phys. Rev. Lett. 2000, 85, 3025.
- (12) Si, M. S.; Yang, D. Z.; Xue, D. S.; Zhang, G. P. Femtosecond Magnetism When The Orbital Angular Momentum Is Quenched. SPIN 2015, 5, 1540009.
- (13) Töws, W.; Pastor, G. M. Many-body Theory Of Ultrafast Demagnetization And Angular Momentu Transfer In Ferromagnetic Transition Metals. Phys. Rev. Lett. 2015, 115, 217204.
- (14) Gariglio, S.; Caviglia, A. D.; Triscone, J.-M.; Gabay, M. A Spin-orbit Playground: Surfaces And Interfaces Of Transition Metal Oxides. Rep. Prog. Phys. 2019, 82, 012501.
- (15) Bartelt, A. F.; Comin, A.; Feng, J.; Nasiatka, J. R.; Eimüller, T.; Padmore, H. A.; Young, A. T.; Scholl, A. Element-specific Spin And Orbital Momentum Dynamics Of Fe/Gd Multilayers. Appl. Phys. Lett. 2007, 90, 162503.
- (16) Boeglin, C.; Beaurepaire, E.; Halte, V.; Lopez-Flores, V.; Stamm, C.; Pontius, N.; Dürr, H. A.; Bigot, J.-Y. Distinguishing The Ultrafast Dynamics Of Spin And Orbital Moments In Solids. Nature 2010, 465, 458.
- (17) Stamm, C.; Pontius, N.; Kachel, T.; Wietstruk, M.; Dürr, H. A. Femtosecond X-ray Absorption Spectroscopy Of Spin And Orbital Angular Momentum In Photoexcited Ni Films During Ultrafast Demagnetization. Phys. Rev. B 2010, 81, 104425.
- (18) Bergeard, N.; Lopez-Flores, V.; Halte, V.; Hehn, M.; Stamm, C.; Pontius, N.; Beaurepaire, E.; Boeglin, C. Ultrafast Angular Momentum Transfer In Multisublattice Ferrimagnets. Nat. Commun. 2014, 5, 3466.
- (19) Hennecke, M.; Radu, I.; Abrudan, R.; Kachel, T.; Holldack, K.; Mitzner, R.; Tsukamoto, A.; Eisebitt, S. Angular Momentum Flow During Ultrafast Demagnetization Of A Ferrimagnet. Phys. Rev. Lett. 2019, 122, 157202.
- (20) Runge, E.; Gross, E. K. U. Density-functional Theory For Time-dependent Systems. Phys. Rev. Lett. 1984, 52, 997.
- (21) Burke, K.; Werschnik, J.; Gross, E. K. U. Time-dependent Density Functional Theory: Past, Present, And Future. J. Chem. Phys. 2005, 123, 062206.
- (22) The ELK code, elk.sourceforge.net.
- (23) Blaha, P; Schwarz, K.; Madsen, G. K. H.; Kvasnicka, D.; Luitz, J. WIEN2k, An Augmented Plane Wave + Local Orbitals Program for Calculating Crystal Properties, (Karlheinz Schwarz, Techn. Universität Wien, Austria, 2001).
- (24) Zhang, G. P.; Bai, Y. H.; George, T. F. Ultrafast Reduction Of Exchange Splitting In Ferromagnetic Nickel. J. Phys.: Condens. Matter 2016, 28, 236004.
- (25) Zhang, G. P.; Jenkins, T.; Bennett, M.; Bai, Y. H. Manifestation Of Intra-atomic 5d6s-4f Exchange Coupling In Photoexcited Gadolinium. J. Phys.: Condensed Matter 2017, 29, 495807.
- (26) Oles, A. M.; Horsch, P.; Khaliullin, G. Spin And Orbital Correlations In Spin-orbital Models For Orbitals. J. Mag. Mag. Mater. 2004, 272-276, 440.
- (27) Pelzl, J.; Meckenstock, R.; Spoddig, D.; F. Schreiber; Pflaum, J.; Frait, Z. Spin-orbit-coupling Effects On -value And Damping Factor Of The Ferromagnetic Resonance In Co And Fe Films. J. Phys.: Condens. Matter 2003, 15, S451.
- (28) WebPlotDigitizer, Web Based Tool To Extract Data From Plots, Images, and Maps, https://automeris.io/WebPlotDigitizer/.
- (29) Stanciu, C. D.; Hansteen, F.; Kimel, A. V.; Kirilyuk, A.; Tsukamoto, A.; Itoh, A.; Rasing, Th. All-optical Magnetic Recording With Circularly Polarized Light. Phys. Rev. Lett. 2007, 99, 047601.
- (30) Dewhurst, J. K.; Krieger, K.; Sharma, S.; Gross, E. K. U. An Efficient Algorithm For Time Propagation As Applied To Linearized Augmented Plane Wave Method. Comput. Phys. Commun. 2016, 209, 92.
- (31) Zhang, G. P.; Bai, Y. H.; George, T. F. Spin Berry Points As Crucial For Ultrafast Demagnetization. Mod. Phys. Lett. B 2021, 35, 2150215.
- (32) Bruno, P. Tight-binding Approach To The Orbital Magnetic Moment And Magnetocrystalline Anisotropy Of Transition-metal Monolayers, Phys. Rev. B 1989. 39, 865.