Multipolar Force Fields for Amide-I Spectroscopy from Conformational Dynamics of the Alanine-Trimer
Abstract
The dynamics and spectroscopy of N-methyl-acetamide (NMA) and trialanine in solution is characterized from molecular dynamics (MD) simulations using different energy functions, including a conventional point charge (PC)-based force field, one based on a multipolar (MTP) representation of the electrostatics, and a semiempirical DFT method. For the 1-d infrared spectra, the frequency splitting between the two amide-I groups is 10 cm-1 from the PC, 13 cm-1 from the MTP, and 47 cm-1 from SCC-DFTB simulations, compared with 25 cm-1 from experiment. The frequency trajectory required for determining the frequency fluctuation correlation function (FFCF) is determined from individual (INM) and full normal mode (FNM) analyses of the amide-I vibrations. The spectroscopy, time-zero magnitude of the FFCF , and the static component from simulations using MTP and analysis based on FNM are all consistent with experiments for (Ala)3. Contrary to that, for the analysis excluding mode-mode coupling (INM) the FFCF decays to zero too rapidly and for simulations with a PC-based force field the is too small by a factor of two compared with experiments. Simulations with SCC-DFTB agree better with experiment for these observables than those from PC-based simulations. The conformational ensemble sampled from simulations using PCs is consistent with the literature (including PII, , , and ), whereas that covered by the MTP-based simulations is dominated by PII with some contributions from , . This agrees with and confirms recently reported, Bayesian-refined populations based on 1-dimensional infrared experiments. Full normal mode analysis together with a MTP representation provides a meaningful model to correctly describe the dynamics of hydrated trialanine.
keywords:
2DIR, NMA, Multipoles, MD, Trialanine, Conformational dynamicsCurrent address: Department of Chemistry and Center for Atomic, Molecular and Optical Sciences and Technologies, Indian Institute of Science Education and Research (IISER) Tirupati, Karakambadi Road, Mangalam, Tirupati-517507, Andhra Pradesh, India. \altaffiliationCurrent address: Bernal Institute, University of Limerick, Plassey Park Road, co. Limerick, Castletroy, Ireland \altaffiliationUniversity of Calfornia, Berkeley \altaffiliationVan ’t Hoff Institute for Molecular Sciences and Informatics Institute, University of Amsterdam, Amsterdam 1098 XH, The Netherlands and Max-Planck-Institut für Polymerforschung, Ackermannweg 10, 55128 Mainz, Germany University of Basel]Department of Chemistry, University of Basel, Klingelbergstrasse 80, 4056 Basel, Switzerland \alsoaffiliation[Brown University]Department of Chemistry, Brown University, Providence/RI, USA
1 Introduction
Ultrafast Infrared (IR) spectroscopy is a powerful tool to
characterize the solvent dynamics around chromophores on the pico- and
sub-picosecond time scale. It has also been proven to be a promising
tool for studying the structure and dynamics of proteins, including
protein-folding and protein-ligand
binding.1, 2, 3, 4, 5, 6, 7
The amide-I mode is suitable to probe the structural dynamics and the
conformational ensemble of a solvated molecule, peptide, or
protein.1, 8 Other suitable
vibrational labels9, 10 that absorb in the
spectroscopic window between and cm-1 are
cyanophenylalanine11, nitrile-derivatized amino
acids,12 the sulfhydryl band of
cysteines,13 deuterated carbons,14
non-natural labels consisting of metal-tricarbonyl modified with a
-(CH2)n- linker,15 nitrile
labels,16 cyano17 and
SCN18 groups, or cyanamide.19
Contrary to these other probes the amide-I band characterizes the
inherent dynamics of the system because it does not require mutation
or chemical modification of the molecule considered.
N-methyl acetamide (NMA) is a typical model system for
experimental20, 21, 22, 23, 24, and
computational25, 26, 27, 28 studies
because it is also the fundamental building block to study longer
peptides and proteins. In going from a mono- to a poly-peptide one
essentially moves from NMA to alanine dipeptide, to trialanine and to
larger alanine chains. Therefore, to develop and validate force fields
for the amide probe and to apply them to larger polypeptide chains,
starting from NMA is a meaningful choice. This also allows one to
assess the transferability of the force fields from NMA by using them
for polypeptides and comparing the results with experimental data.
Two-dimensional infrared (2D-IR) spectroscopy provides quantitative
information about the solvent structure and dynamics surrounding a
solute.29 Such techniques are particularly useful to
measure the fast (picosecond) dynamics in condensed-phase systems. The
coupling between inter- and intramolecular degrees of freedom - such
as the hydrogen bonding network in solution, or the conformational
dynamics of biological macromolecules - can be investigated by
monitoring the fluctuation of a fundamental vibrational frequency,
which is the amide-I mode in the present work. Computationally, this
information is accessible from either instantaneous normal modes
(NM),30, 25, 5 the solution of
a reduced-dimensional nuclear Schrödinger
equation,31, 32 or from spectroscopic
maps.33 This frequency trajectory
( or for harmonic or anharmonic vibrations,
respectively) is then used to determine the frequency fluctuation
correlation function which can be directly compared with experimental
measurements.
The linear and non-linear vibrational spectroscopy and conformational
dynamics of trialanine in solution has been investigated from both,
experiments and
computations.34, 35, 36, 37, 38, 39, 40, 41, 42, 43, 44
Computationally, a quantum-classical description of the amide-I
vibrational spectrum of trialanine in D2O probed different
approximations typically made in determining the vibrational
lineshapes. 41 A combined experimental and molecular
dynamical study using non-linear time-resolved spectroscopy on
trialanine found conformational heterogeneity of the
peptide.35 Peptide conformational ensembles were also
studied for trialanine using two-dimensional IR and NMR
spectroscopies.44, 43, 42 Two-dimensional IR
studies probed the subpicosecond dynamics36 and
with isotopically labelled (Ala)3 the dipole-dipole coupling
strength was determined.38 Including such couplings
is often done in models based on spectroscopic maps. In the present
work, NMs are determined from “independent normal modes” (INM) and
from a “full normal mode” (FNM) analysis which allows coupling of
two or several amide-I modes.
The present work is structured as follows. First, the methods used are
introduced. This is followed by an analysis the spectroscopy and
dynamics of solvated, deuterated N-methyl-acetamide with a flexible
solute. Next, the spectroscopy and structural dynamics of trialanine
are discussed. Finally, conclusions are drawn.
2 Computational methods
2.1 Molecular Dynamics Simulations
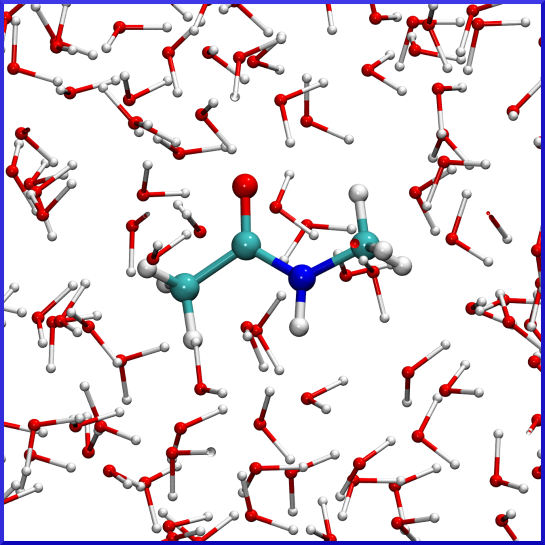
Molecular Dynamics (MD) simulations were carried out for N-deuterated
N-methylacetamide (NMAD, see Figure 1) and trialanine
(Ala)3 in a periodic cubic box of deuterated
TIP3P45 water molecules. The box size was
Å3 and the system consisted of one solute molecule surrounded
by 882 water molecules (for NMAD) and 795 water molecules (for
(Ala)3), respectively. (Ala)3 was fully deuterated and the
positively charged species (i.e. “cationic” with ND and COOD
termini) was investigated.34, 44 To
neutralize the simulation system, one chloride ion was added and
constrained in one corner of the simulation system during MD
simulations.
All MD simulations were performed with the CHARMM program46
with provision for multipolar
interactions.47, 48 Parameters for
NMA are based on CGenFF49 unless stated
otherwise and described in more detail in
Ref. 25. Electrostatic interactions were treated using
Particle-Mesh Ewald (PME)50 with a grid-size
spacing of 1 Å, characteristic reciprocal length Å-1, and interpolation order 4 for long-range
electrostatics. For the Lennard-Jones (LJ) interactions a 12 Å
cut-off and 10 Å switching were used. The simulations were
performed at K and all bonds involving hydrogen atoms were
constrained via the SHAKE algorithm. 51 The
timestep was fs and snapshots were recorded every 10
time steps.
Mixed QM/MM were carried out using Self-consistent charge density
functional tight-binding (SCC-DFTB)52 as implemented in
CHARMM.53 In these simulations, the entire solute
(NMAD or (Ala)3) was treated with SCC-DFTB whereas all water
molecules and the ion (for the solvated (Ala)3 system) were treated
by MM. First the system was minimized and heated to 300 K. A NVT
simulation was carried out at 300 K using the velocity Verlet
integrator with a (shorter) time step of fs for 5
ns. Again, all bonds involving hydrogen atoms were constrained using
SHAKE51 and the treatment of the nonbonded
interactions was that same as that for the PC and MTP simulations
described above.
2.2 Force fields for flexible NMA
Two different electrostatic models for NMA are used in this work. The
first one uses point charges (PCs) based on the CGenFF force
field. The second model is the multipolar MTPW representation
including atomic multipoles up to quadrupoles on heavy atoms for the
entire NMAD molecule.25. The force field parameters for
the CO bond are based on ab initio calculations at the
MP2/6-31G∗∗ level and are readjusted to reproduce the gas phase
amide-I frequency. The Morse parameters are kcal
mol-1, Å-1 and Å.
The parametrization for (Ala)3 uses the CGenFF force
field54 except for the CO-stretch potential which is the same
Morse function used for the -CO group of NMAD and the multipoles on the C-terminal CO atoms as well as outer and
central [CONH] atoms which were also used for [CONH] group of NMAD.
2.3 The Frequency Fluctuation Correlation Function and 1D infrared spectrum
The FFCF, , is obtained from the frequency trajectory according to:
| (1) |
Here, is the instantaneous frequency at time and
is the average frequency and thereby refers to the frequency fluctuation at time . The
instantaneous frequencies are obtained from normal mode
(NM) calculations. For each snapshot of the trajectory, the structure
of the solute (here NMAD and (Ala)3) is minimized while keeping the
solvent frozen. Frequencies are calculated using two different
approaches referred to as “full NM” (FNM) and “independent NM”
(INM) analysis methods. For FNM the normal mode analysis is carried
out for the entire solute. Such an approach includes both, the
frequencies of the labels (“site energies”) and the couplings
between them. On the other hand, INM refers to the normal mode
analysis of the independent amide modes of trialanine while keeping
everything except the [CONH] group fixed and therefore neglects the
couplings between the spectroscopic labels. This approach is
computationally more efficient than scanning along the normal mode and
solving the 1- or even 3-dimensional nuclear Schrödinger
equation.31, 8, 55
The analysis adopted here is also reminiscent of instantaneous normal
modes (NM) which have been shown to perform well for the short-time
dynamics in condensed
phase.56, 57, 58, 59
Furthermore, a direct comparison between instantaneous normal modes,
scanning (“scan”) along the local and normal mode and map-based
frequency trajectories has been recently presented and found that
“NM” and “scan” yield comparable FFCFs and 1d-lineshapes derived
from them.8
The 1D and 2D response functions can be determined from the lineshape function ,20, 60 which is related to the FFCF through
| (2) |
Depending on whether or not the FFCF is fit to a parametrized form, the double integration can be carried out in closed form or needs to be done numerically. In the present case, the functional form fitted to is
| (3) |
with amplitudes and decay times as fitting parameters
and or 3 to make direct comparison with earlier work
on (Ala)3.61 The and are
amplitudes and relaxation times, respectively, and is the
static component which can differ from 0 for situations in which
processes occurring on longer time scales have not equilibrated on the
time scales of the relaxation times .
3 Results
3.1 Spectroscopy of N-methylacetamide
To validate the energy functions and analysis techniques used
subsequently for (Ala)3 first the spectroscopy of NMAD in D2O
from MD simulations with PCs and MTPs for flexible solute were
considered. In addition, QM(SCC-DFTB)/MM simulations were also carried
out. For each of the three cases, snapshots from a 5 ns long
trajectory were analyzed. For every snapshot the frequency,
, was obtained from an instantaneous normal mode
analysis. From this, the FFCFs were determined and fitted to
multi-exponential decay functions along with a static component
() according to Eq. 3 with or .
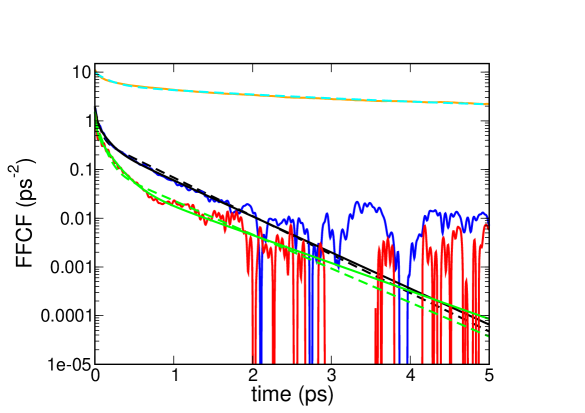
Figure 2 shows the FFCF for NMAD in D2O for the
simulations with PC (red), MTP (blue), and SCC-DFTB (orange)
models. The fits, using two or three time scales, respectively, are
the dashed and solid green, black and cyan lines. The fitting
parameters for the FFCFs are summarized in
Table 1. Figure 2 shows that for the PC, MTP
and SCC-DFTB, two time scales are sufficient to represent the FFCF. Also, for the two force
field models the FFCFs decay to zero on the ps time scale
whereas that from the SCC-DFTB simulations has a static component of
ps-2.
The short time decay for the PC and MTP models range from
0.02 ps to 0.05 ps, consistent with experiments (between 0.01 and 0.1
ps).35, 62 Contrary to that, simulations with
SCC-DFTB yield ps which is at least a factor of two
slower compared with what has been reported from experiments. The long
time scale, , ranges from 0.55 ps to 0.62 ps, compared with
1.0 ps and 1.6 ps from the experiments.35, 62 Earlier
MD simulations reported ps.62 The SCC-DFTB
simulations find a long time scale ps which is longer
than any of the experiments. It is also worthwhile to note that a
two-time scale fit of the FFCF to the frequencies from the MTP
simulation is sufficient and assuming three time scales does not
provide additional information. This is also found from the
experiments.62 The fits with only two time scales are
preferred as with every additional time scale a new process is
associated. For water the sub-picosecond time scale has been
associated with partial water reorientation whereas the process on the
ps time scale is considered to involve full water
reorientation.63
| Model | [ps-2] | [ps] | [ps-2] | [ps] | [ps-2] | [ps] | [ps-2] |
|---|---|---|---|---|---|---|---|
| PC | 0.470 | 0.019 | 0.597 | 0.075 | 0.085 | 0.588 | – |
| PC (bi-exp) | 0.951 | 0.080 | – | – | 0.115 | 0.622 | – |
| MTP | 0.942 | 0.019 | 0.707 | 0.110 | 0.330 | 0.587 | – |
| MTP (bi-exp) | 1.361 | 0.049 | - | - | 0.418 | 0.550 | – |
| SCC-DFTB | 4.488 | 0.183 | – | – | 3.982 | 3.202 | 1.344 |
| sim. 62 | 0.06 | 0.66 | |||||
| exp. 35 | (0.05-0.1) | 1.6 | |||||
| exp. 62 | 0.01 | 1.0 |
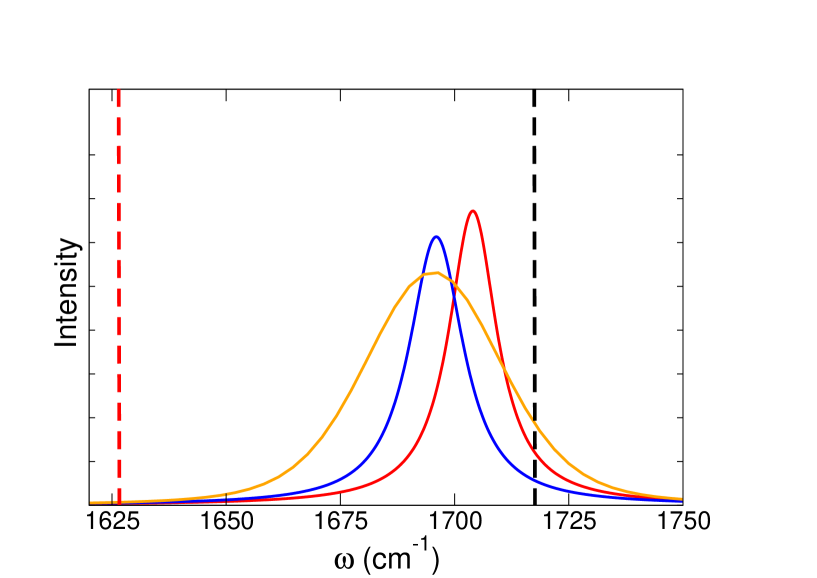
The 1D absorption spectra are calculated from the analytical
integration64, 5 of the lineshape function (see
Eq. 2) with the FFCF () fit to
Eq. 3. A phenomenological broadening for the amide-I
vibration consistent with a lifetime of 0.45 ps was
used.22 The maxima of the 1D lineshape for NMAD in
D2O for PC, MTP and SCC-DFTB models are 1705 cm-1, 1695
cm-1 and 1695 cm-1, respectively, see Figure
3. The gas phase frequency for amide mode of NMAD is
1717 cm-1 and solvent induced red-shift for PC, MTP and SCC-DFTB
models are 12 cm-1, 22 cm-1 and 22 cm-1,
respectively. This compares with an experimental solvent induced
red-shift of 85 cm-1.65 The full width
at half maximum (FWHM) of the calculated 1D absorption spectra (Figure
3) for NMAD in D2O using the PC, MTP, and SCC-DFTB
models are 12.5 cm-1, 14 cm-1, and 35 cm-1, compared
with cm-1 from experiments.61
In summary, the PC and MTP models correctly capture the short and long
time scales compared with experiment with the MTP model performing
somewhat better. Simulations with both force fields correctly find
that the FFCFs decay to zero on the few-picosecond time scale whereas
SCC-DFTB leads to a static component which was not found in the
experiments. For the 1d-infrared spectroscopy, all models find a
solvent-induced red shift which, however, underestimates the
experimentally reported magnitude and the FWHM from MTP is closest to
that observed experimentally.61
3.2 Spectroscopy and Dynamics of Trialanine
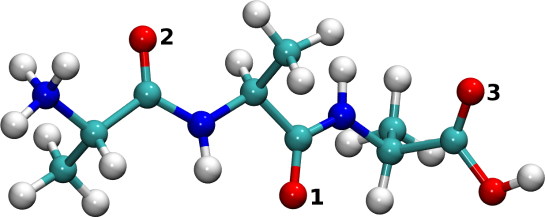
Next, the spectroscopy and dynamics of (Ala)3 (see Figure
4) are considered. Trialanine involves two amide-I
groups (central and outer -CO) and one terminal carboxylic (COOH)
group. For each interaction model, 10 ns MD simulations were performed
for deuterated trialanine in deuterated water using PC, MTP, and
SCC-DFTB (validated for NMAD in D2O). This was preceded by 1 ns of
equilibration and further 100 ps equilibration. The
-CO(OH) group of trialanine is characteristically different from the
amide -CO group. To account for this a slightly modified Morse
() parameter (than what has been used for C=O of NMAD in
D2O) is used for the C-terminal -CO group in the simulations and NM calculations.
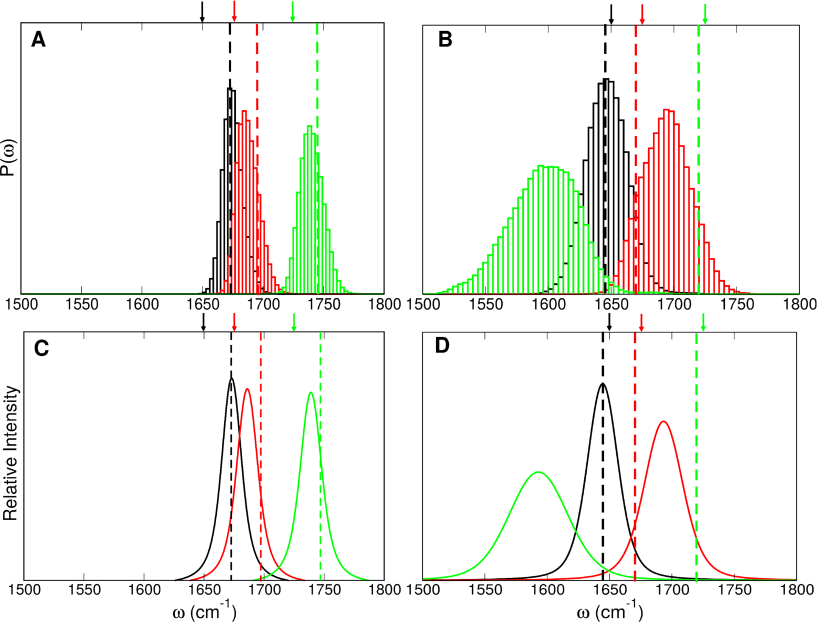
Frequency Distributions: Frequencies for the central and outer
amide as well as terminal CO(OH) are calculated using both, FNM and
INM analyses. The experimentally determined peak positions are at 1650
cm-1, 1675 cm-1 and 1725 cm-1 for the central, outer
and carboxylic -CO, respectively.34 In the
following, results from the FNM analysis are discussed first and then
compared with those obtained from INMs, see Figure
8 and Table 2.
Figures 5A and B show the frequency distribution for the
central (black), outer (red) and terminal (green) carbonyl group from
simulations with the MTP and SCC-DFTB models, respectively. The
down-headed arrows of corresponding color indicate the
experimental34 peak positions of each -CO group and
the vertical dashed lines refer to the shifted experimental peak
position to best overlap with the simulated data for the central
-CO. This is meaningful because for the present work primarily relative positions of the absorption bands are of
interest. Fine-tuning of the Morse parameters to match experimental
line positions would still be possible for the PC and MTP models as an
additional refinement but is not deemed necessary here.
For MTP a constant shift of 22 cm-1 to the blue from the
experimental spectra yielded the best overlap for the central -CO
peak. The computations find a frequency of 1673 cm-1 for the
central -CO (black), followed by the outer -CO at 1686 cm-1
(red), and finally the -CO(OH) group at 1739 cm-1
(green). Although the same force field (MTP and Morse) was used for
the central and outer amide, the different environments experienced by
them leads to a splitting of 13 cm-1. This sensitivity to the
environmental structure and dynamics is consistent with recent
findings for insulin monomer and dimer.8
Nevertheless, the experimentally observed splitting of 25 cm-1 is
still underestimated.34 The simulations with the PC
model also yield the correct ordering for the frequencies of the
central and outer -CO (at 1677 cm-1, 1687 cm-1 ) but the
splitting is somewhat smaller (10 cm-1) than that from the
simulations using MTP.
It is conceivable that further improvements of the
electrostatics67, 68 leads to yet closer
agreement between simulations and experiments. For one,
conformationally dependent multipoles provide an even better
description of the electrostatics as has been found for isolated CO in
Mb.69, 70, 71, 72
Furthermore, including polarizability may lead to additional
improvements.
With SCC-DFTB the central, outer and terminal carbonyl peaks are at
1648 cm-1, 1695 cm-1 and 1598 cm -1 (Figure
5B, D). A constant shift of 5 cm-1 (red) from the
experimental spectra was considered to best overlap the central -CO
peak for the simulations with the SCC-DFTB results. Consistent with
experiment, the frequency of the outer -CO is shifted to the blue ( cm-1) from the central -CO by close to twice the value
reported from experiment ( cm-1).34 For
the carbonyl (COOH) -CO, SCC-DFTB underestimates the frequency by 125
cm-1 compared with experiment. This finding was reproduced from
two independent simulations. Upon visual inspection of the
trajectories it was observed that the COOH unit is typically in an
anti conformation whereas the minimum energy structure is the syn
conformer. To further validate the performance of SCC-DFTB,
simulations for (Ala)3 in the gas phase using the
mio52, 73 and 3ob-freq74 parameter sets were
carried out. With the mio parameters, used for this study, the
frequency distributions of the central and outer -CO label are split
by cm-1 - to be compared with a splitting of 25
cm-1 from experiment in solution - whereas with the 3ob-freq
parametrization - which was refined for thermochemistry, geometries,
and vibrational frequencies in the gas phase - the splitting is 110
cm-1. Hence, it is not expected that a different
parametrization will appreciably improve the findings for simulations
in solution.
Frequency Fluctuation Correlation Function: The frequency
fluctuation correlation function provides information about the
environmental dynamics surrounding a local spectroscopic probe and the
coupling to it. The FFCFs were fitted to a bi-exponential decay with
static component (equation 3) as has also been done
for NMAD.61 The raw data with the corresponding
fits are shown in Figure 6 and the parameters are
summarized in Table 2. FFCFs for each -CO probe of
trialanine using the MTP model (Figure 6A) and from SCC-DFTB
simulations (Figure 6B) for central (black), outer (red), and
terminal (green) -CO are reported.
| Model | Mode | [ps-2] | [ps] | [ps-2] | [ps] | [ps-2] |
|---|---|---|---|---|---|---|
| MTP (FNM) | –CO(central) | 1.348 | 0.038 | 0.274 | 1.337 | 0.723 |
| –CO (outer) | 1.709 | 0.044 | 0.373 | 3.066 | 0.797 | |
| –CO(OH) | 1.804 | 0.067 | 0.568 | 3.184 | 0.620 | |
| MTP (INM) | –CO (central) | 2.250 | 0.057 | 0.662 | 1.043 | 0.087 |
| –CO(outer) | 2.360 | 0.076 | 0.419 | 1.543 | 0.023 | |
| PC (FNM) | –CO (central) | 1.391 | 0.039 | 0.204 | 2.306 | 0.200 |
| –CO (outer) | 1.942 | 0.037 | 0.422 | 4.697 | 0.419 | |
| –CO(OH) | 1.465 | 0.098 | 1.350 | 6.028 | 0.099 | |
| SCC-DFTB (FNM) | -CO(central) | 4.872 | 0.076 | 3.052 | 1.845 | 0.908 |
| -CO (outer) | 4.981 | 0.124 | 6.299 | 1.350 | 0.468 | |
| -CO(OH) | 9.780 | 0.311 | 9.198 | 3.508 | 2.877 |
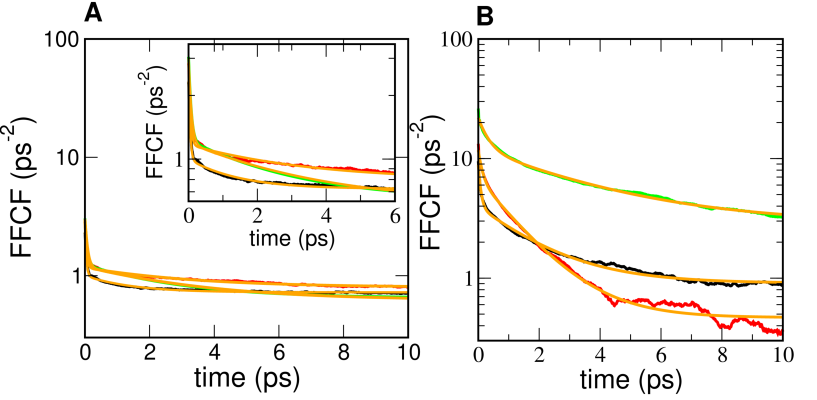
The short
time scale ranges from 0.04 to 0.07 ps whereas the longer one
ranges from 1.3 ps to 3.2 ps. Using PC simulations the decay time
is similar to that from the MTP simulation whereas the long
time scales increase by about a factor of two. The amplitudes (
and ) of the two time scales are comparable for the two
methods. For the simulation with MTPs, the static components for the
central and outer amide are similar in magnitude, on average
ps-2 (which yields ps-1 equivalent to
cm-1), which is in good agreement with the experimentally
reported value35 of cm-1. This
static component appears for (Ala)3 but not for NMA and is
quantitatively captured by using the MTP force field together with the
FNM analysis and consistent with experiment which report that “In
contrast to NMA, the amide I band of trialanine is still notably
inhomogeneous on the 4 ps time scale.”35 For the
simulations with the PC model, the fits to Eq. 3 yield
ps-2 and ps-2 which
is smaller by about a factor of two compared with experiment. Also,
the two static components for the central and outer -CO label differ
by a factor of two.
With SCC-DFTB, the short time decay is considerably slower
(0.1 ps to 0.3 ps) and the longer time scales range from 1.4 ps to 3.5
ps. The short time decay is considerably longer than that reported
from experiment whereas the long time decay for the central and outer
-CO are compatible with ps used for interpreting
experiments on (Ala)3 which was, however, fixed at the value found
for NMA.35 The values of for the central
and outer -CO differ by a factor of two, similar to the results from
the simulations with PCs but on average, they are consistent with the
experimental value.35
The magnitude of (i.e. the FFCF at ) has been reported
to be cm-2 equivalent to 4.30
ps-2.61 This compares with values of 1.65
ps-2, 2.05 ps-2, and 2.39 ps-2 from simulations with
MTP and 8.5 ps-2, 12.78 ps-2, and 23.33 ps-2, from the
SCC-DFTB simulations for the central, outer and CO(OH) groups. Hence,
the MTP simulations underestimate the experimentally reported
amplitude whereas SCC-DFTB simulations overestimate it by about a
factor or two. This was also found for simulations and experiments on
fluoro-acetonitrile.64 The value is a measure of the
interaction strength between the reporter(s) and the
environment. Thus, the present findings suggest that this interaction
is underestimated by the MTP model and overestimated by SCC-DFTB. Such
information can be used to further improve the energy function.
Considering the results on the FFCFs for NMAD and (Ala)3 together
is it noted that only the simulations with MTP are consistent with
experiment in that a) their decay times are close to one another and
b) the fact that the FFCF for NMAD has no static component but that
for (Ala)3 has . It is also of interest to note
that the fast decay time fs of the FFCF observed
in the present simulations is consistent with an experimentally
observed time constant of
fs.36
The associated lineshapes for the three different modes involving the
-CO stretch for trialanine are calculated via 1D Fourier
transformation of the lineshape function as was done for NMAD, see
Figures 5C and D. The FWHM for the 1D-IR spectra are
13 cm-1 for the central -CO, 17 cm-1 for the outer one and
18 cm-1 for the terminal -CO(OH) using the MTP model and
25 cm-1, 32 cm-1, and 50 cm-1 when using the
SCC-DFTB model. Experimentally,61 it was found
that the FWHM for NMAD and (Ala)3 differ little and are
cm-1. Both findings are quite well captured by the MTP
simulations whereas with SCC-DFTB the widths are larger and differ
somewhat more between NMAD and (Ala)3.
Structural Dynamics: To characterize the structural dynamics
afforded by the different energy functions used in the present work,
the distribution of / angles (Ramachandran plot) were
determined from trajectories with the PC, MTP, and SCC-DFTB models,
see Figure 7. This is used to determine whether,
depending on the energy function used, the conformational space
sampled differs. Also, assessing differences in the sampling between
simulations in the gas phase and in solution are of interest. Both,
the conventional map involving the central and outer -CO
labels, and the dihedral angles for the terminal -CO are reported.
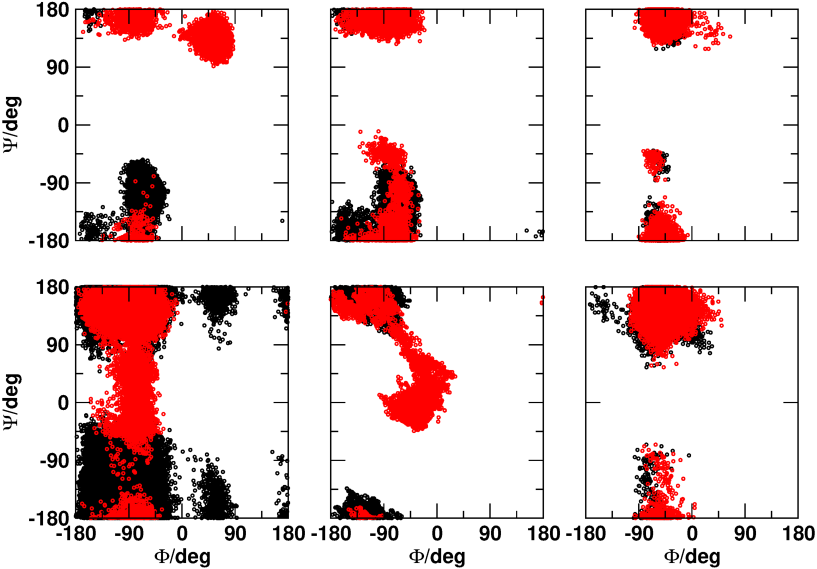
Figure 7 shows the Ramachandran plot for trialanine
from simulations using the PC (left panel), SCC-DFTB (middle panel)
and MTP (right panel) models. The centers for the angles
for the , PII, and conformations
are , ,
, and ,
respectively. From simulations in the gas phase (top) the
distributions for the regular Ramachandran angles from PC and SCC-DFTB
simulations are similar. They both sample , PII, and
structures. For simulations with MTP the densities
are somewhat more shifted towards the PII structures and the
state is sampled as well. For the COOH group (red), the
region for is occupied for simulations with PCs but not with
SCC-DFTB. For simulations with the MTP model the same regions as for
the regular Ramachandran angles are sampled.
The distribution of conformational state population in Figure
7 find increased flexibility of (Ala)3 from
simulations with the PC model compared with those using MTP and
SCC-DFTB both in the gas phase and in water. For the simulations in
water (bottom row in Figure 7), the changes compared
with the gas phase are most pronounced with PCs. In addition to the
, PII, and structures, the poly-Gly
regions are also accessed extensively. Contrary to that, the
differences between the gas and the condensed phase from simulations
with SCC-DFTB and MTP are smaller but nevertheless exhibit increased
flexibility as was found for the simulations with PCs. Using SCC-DFTB
sampling of the and PII structures is extensive
whereas is not sampled at all for the regular
Ramachandran angle (but for the -COOH terminus, see red
distribution). Finally, for MTP, the distributions in the region of
the and PII states broaden and there is also some
limited sampling of the helix. Both, SCC-DFTB and MTP
only sample “allowed” regions in solution whereas PC also accesses
“unusual” (poly-Gly) and “forbidden” regions.
Ramachandran maps have also been reported from simulations using a
range of parametrized, PC-based force fields, including C27, C36, and
C36m together with the TIP3P and SPC/E water
models.44 The distributions found in the present
work, see Figure 7 lower left panel, are consistent
with these maps. Using a Bayesian refinement on the
measured and computed 1d-IR spectra, a consensus 2-dimensional
potential of mean force (PMF) as a function of was
determined. Notably, the refined PMF vis-a-vis experiment
reported in Ref.44 closely resembles the
distribution found from the MTP simulations, see black symbols in
Figure 7 lower right panel.
Table 3 summarizes state populations for ,
PII, and conformations of trialanine
from simulations with PC, MTP, and SCC-DFTB models. A comparison with
several previous studies is also
provided.34, 37, 39, 40, 42, 43, 44
For assigning a particular conformation to one of the 4 states, first
centers (, ) of each of the states were defined as
, ,
, and for
, PII, and conformations,
respectively. If a particular conformation is within
around any of the centers, the conformation is assigned to that
center. If a conformation is outside these bounds, it is not assigned
which is the case for 30 % to 40 % of the structures. Then the
percentage for the population of a particular substate was determined
as the fraction of all assigned conformations. The present simulations
using MTP find dominant population of the PII state (98 %)
with a small fraction of and . Using a PC model,
PII is still most populated, followed by and
. Simulations with SCC-DFTB yield a higher population
of , a smaller fraction for PII and no helical
conformations.
Most previous studies find that the PII state is most
populated, typically followed by structures. The relative
populations range from 66 % to 92 % for PII and 0 to 23 %
for . Fewer studies report population of . One
of the most sophisticated investigations (Bayesian ensemble refinement
against FTIR and 2DIR experimental data)44 report a
% population for PII, % for
and an insignificant population % for . Within error bars, the results from the MTP simulations are
consistent with these findings. It is interesting to note that the
“original” state populations in the work by Tokmakoff et al. were
all derived from MD simulations using PC-based force fields and the
populations are largely independent on the particular choice of the
all-atom FF, see Table S5 in Ref.44 Specifically,
the populations from the C36 parametrization with the TIP3P water
model (as used here, see Table S4 in Ref.44) compare
favourably with the present findings for structures (18%
vs. 20 %), PII (68 % vs. 79 %), and . (6
% vs. 3%). Differences may arise due to slightly different
definitions of the basins to integrate the populations and whether or
not all of the conformations are used for analysis. After Bayesian
refinement the populations are comparable to those from MTP
simulations. In other words, machine learning of the populations based
on the comparison of measured and computed IR spectra has the same
effect as replacement of PCs by MTPs in the present simulations,
lending additional support to the physical relevance afforded by the
anisotropic effects in the electrostatic interactions.
| Conformational State Population | ||||
| PII | ||||
| MTP (this work) | 1% | 98% | 1% | 0 |
| PC (this work) | 18% | 79% | 3% | 1% |
| SCC-DFTB (this work) | 62% | 38% | 0 | 0 |
| Tokmakoff et al. (original) 44,a | % | %) | % | % |
| Tokmakoff et al. (Refined)b | % | % | % | % |
| Woutersen et al.34,c | 0% | 80% | 20% | 0% |
| Mu et al.39 | 42% | 41% | 16% | 0.8% |
| Schweitzer-Stenner 37,d | 16% | 84% | 0% | 0% |
| Graf et al.40,e | 8% | 92% | 0% | 0% |
| Oh et al. 42,f | 12% | 88% | 0% | 0% |
| Xiao et al. 43,g | % | % | % | % |
| Beauchamp et al. 75,h | % | % | % | – |
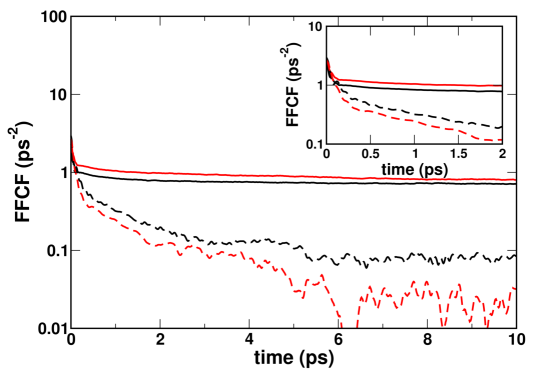
3.3 FFCF from Independent Normal Modes
The amide-I vibrational dynamics encoded in the FFCF contains
information about the solvent dynamics as well as the peptide
conformational dynamics. To better understand the influence of
inter-mode couplings on the conformational dynamics, the instantaneous
normal modes for the central and the outer -CO label were also
determined from normal mode analyses treating the two amide modes
independently. This is then compared with the FFCFs obtained from the
FNM analysis which contains the couplings between the labels.
The FFCFs for the central and the outer -CO from INM (dashed lines)
and from FNM (solid lines) are reported in Figure
8 and the fitting parameters to
Eq. 3 using two time scales are given in Table
2. Without coupling (dashed lines) the FFCFs decay close
to zero on the 10 ps time scale and the magnitude of
decreases by almost one order of magnitude compared with the results
from FNM. Also, the decay times are shorter if the coupling between
the two labels is neglected. As the results from FNM analysis agree
with experiment and those omitting the coupling do not, it is
concluded that the FNM analysis together with a MTP representation of
the electrostatics provides a means to correctly describe the dynamics
of hydrated (Ala)3.
Including couplings between the labels (“sites”) is also important
when working with map-based approaches for 1d- and 2d-IR
spectroscopy.76, 33, 77
Using frequency maps, the site energies, the nearest neighbor coupling
and the transition dipole couplings are usually included in the
excitonic Hamiltonian.33 Such couplings need
to be (re-)introduced in an excitonic Hamiltonian but they are already
partly present in the FNM approach used here, as the above analysis
demonstrates. The molecular dynamics simulations which generate the
conformational ensemble to be analyzed include couplings through the
nuclear dynamics and the FNM analysis preserves these couplings
whereas the INM analysis almost entirely removes them.
Comparing the maxima of the peak positions from the frequency
distributions based on “full NM” and “independent NM” reveals that
the two analyses differ in capturing this coupling. From INM the
frequency distributions peak at 1661.5 cm and 1662 cm-1,
i.e. a splitting of close to zero, whereas from FNM the maxima are at
1670 cm-1 and 1683 cm-1, i.e. a splitting of 13
cm-1. Within a simple two-state Hamiltonian this amounts to a
coupling of cm-1, consistent with
experiments.36
The finite amplitude of is also indicative of the fact that within the explored time scale the system has not exhaustively sampled all available states. In other words, population relaxation is not complete on the 10 ps time scale. This is consistent with an analysis of MD trajectories that determined the FFCF from only sampling the PII conformation (which decays to zero on the ps time scale) compared with the full MD trajectory sampling different substates for which a static contribution remains even after 10 ps.61 This interpretation is also consistent with the fact that NMAD only has one conformational substate and therefore the FFCF decays to zero on the 10 ps time scale.
4 Summary and Conclusion
In summary, the present work provides a comprehensive assessment and
comparison of the dynamics and infrared spectroscopy of NMAD and
(Ala)3 in D2O. Consistent with experiments on (Ala)3 it is
found that with “full normal modes” from simulations using MTPs to
compute the frequency trajectory, the 1d-infrared spectrum for the
outer and central -CO labels are split by 13 cm-1, compared with
25 cm-1 from experiment. With independent normal modes this
splitting is close to zero. Including the site-site couplings in the
NM analysis therefore yields a more quantitative description of the
spectroscopy and dynamics. This splitting is larger (47 cm-1)
in simulations with SCC-DFTB for the solute. The FFCF from FNM has an
initial amplitude of [1.65, 2.05] ps-2 for the central
and outer -CO label, compared with 4.30 ps-2 from experiment and
[8.5, 12.78] ps-2 from simulations with SCC-DFTB. This points
towards somewhat weaker interactions of the -CO labels with the
environment in the MTP simulations and a considerably stronger
interaction in SCC-DFTB. The long-time static component from MTP
simulations with FNM of cm-1 compares well with
that observed experimentally ( cm-1) whereas that
from simulations with PCs is smaller by a factor of two. The MTP
simulations find comparable values for for the central and
outer -CO whereas with SCC-DFTB they differ by about a factor of two
with one of the values % larger than that observed
experimentally and the other one lower by a similar amount, see Table
2.
Overall, simulations for (Ala)3 with MTP and FNM analysis find good
to quantitative agreement with experiment for the splitting, amplitude
of , and value for . This contrasts with simulations
using PC and/or INM or SCC-DFTB simulations. The conformational space
sampled by (Ala)3 in solution is dominated by a PII
structure (98 %), followed by and , each populated
in 1 % of the cases. This agrees qualitatively with a Bayesian
refined analysis44 of recent infrared experiments
which find occupations of [PII, , ] [, , ]% but differ somewhat from earlier
results34 which report [80, 0, 20]%.
The present work demonstrates that the structural dynamics of a small,
hydrated peptide can be correctly described from MD simulations based
on an MTP force field in explicit solvent together with a full normal
mode analysis. Such studies provide the necessary basis to link
structural dynamics, spectroscopy and aggregation in larger proteins
from experiment and simulations.
5 Acknowledgments
The authors gratefully acknowledge financial support from the Swiss
National Science Foundation through grant 200021-117810 and to the
NCCR-MUST. The authors thank Prof. Peter Hamm for valuable
discussions.
References
- Ganim \latinet al. 2008 Ganim, Z.; Chung, H. S.; Smith, A. W.; DeFlores, L. P.; Jones, K. C.; Tokmakoff, A. Amide I two dimensional infrared spectroscopy of proteins. Acc. Chem. Res. 2008, 41, 432–441
- Getahun \latinet al. 2003 Getahun, Z.; Huang, C. Y.; Wang, T.; Leon, B. D.; DeGrado, W. F.; Gai, F. Using Nitrile-Derivatized Amino Acids as Infrared Probes of Local Environment. J. Am. Chem. Soc. 2003, 125, 405–411
- Bagchi \latinet al. 2012 Bagchi, S.; Boxer, S. G.; Fayer, M. D. Ribonuclease S Dynamics Measured Using a Nitrile Label with 2D IR Vibrational Echo Spectroscopy. J. Phys. Chem. B 2012, 116, 4034–4042
- Xu \latinet al. 2011 Xu, L.; Cohen, A. E.; Boxer, S. G. Electrostatic Fields near the Active Site of Human Aldose Reductase: 2. New Inhibitors and Complications Caused by Hydrogen Bonds. Biochem. 2011, 50, 8311–8322
- Mondal and Meuwly 2017 Mondal, P.; Meuwly, M. Vibrational Stark Spectroscopy for Assessing Ligand-Binding Strength in a Protein. Phys. Chem. Chem. Phys. 2017, 19, 16131–16143
- Bloem \latinet al. 2012 Bloem, R.; Koziol, K.; Waldauer, S. A.; Buchli, B.; Walser, R.; Samatanga, B.; Jelesarov, I.; Hamm, P. Ligand Binding Studied by 2D IR Spectroscopy Using the Azidohomoalanine Label. J. Phys. Chem. B 2012, 116, 13705–13712
- Layfield and Hammes-Schiffer 2013 Layfield, J. P.; Hammes-Schiffer, S. Calculation of Vibrational Shifts of Nitrile Probe in the Active Site of Ketosteroid Isomerase upon Ligand Binding. J. Am. Chem. Soc. 2013, 135, 717–725
- Salehi \latinet al. 2020 Salehi, S. M.; Koner, D.; Meuwly, M. Dynamics and Infrared Spectroscopy of Monomeric and Dimeric Wild Type and Mutant Insulin. J. Phys. Chem. B 2020, 124, 11882–11894
- Waegele \latinet al. 2011 Waegele, M. M.; Culik, R. M.; Gai, F. Site-Specific Spectroscopic Reporters of the Local Electric Field, Hydration, Structure, and Dynamics of Biomolecules. J. Phys. Chem. Lett. 2011, 2, 2598–2609
- Koziol \latinet al. 2015 Koziol, K. L.; Johnson, P. J. M.; Stucki-Buchli, B.; Waldauer, S. A.; Hamm, P. Fast infrared spectroscopy of protein dynamics: advancing sensitivity and selectivity. Curr. Op. Struct. Biol. 2015, 34, 1–6
- Horness \latinet al. 2015 Horness, R. E.; Basom, E. J.; Thielges, M. C. Site-selective characterization of Src homology 3 domain molecular recognition with cyanophenylalanine infrared probes. Anal. Chem. 2015, 7, 7234–7241
- Getahun \latinet al. 2003 Getahun, Z.; Huang, C.; Wang, T.; De Leon, B.; DeGrado, W.; Gai, F. Using nitrile-derivatized amino acids as infrared probes of local environment. J. Am. Chem. Soc. 2003, 125, 405–411
- Kozinski \latinet al. 2008 Kozinski, M.; Garrett-Roe, S.; Hamm, P. 2D-IR spectroscopy of the sulfhydryl band of cysteines in the hydrophobic core of proteins. J. Phys. Chem. B 2008, 112, 7645–7650
- Zimmermann \latinet al. 2011 Zimmermann, J.; Thielges, M. C.; Yu, W.; Dawson, P. E.; Romesberg, F. E. Carbon-Deuterium Bonds as Site-Specific and Nonperturbative Probes for Time-Resolved Studies of Protein Dynamics and Folding. J. Phys. Chem. Lett. 2011, 2, 412–416
- Woys \latinet al. 2013 Woys, A. M.; Mukherjee, S. S.; Skoff, D. R.; Moran, S. D.; Zanni, M. T. A Strongly Absorbing Class of Non-Natural Labels for Probing Protein Electrostatics and Solvation with FTIR and 2D IR Spectroscopies. J. Phys. Chem. B 2013, 117, 5009–5018
- Bagchi \latinet al. 2012 Bagchi, S.; Boxer, S. G.; Fayer, M. D. Ribonuclease S Dynamics Measured Using a Nitrile Label with 2D IR Vibrational Echo Spectroscopy. J. Phys. Chem. B 2012, 116, 4034–4042
- Zimmermann \latinet al. 2011 Zimmermann, J.; Thielges, M. C.; Seo, Y. J.; Dawson, P. E.; Romesberg, F. E. Cyano Groups as Probes of Protein Microenvironments and Dynamics. Angew. Chem. Int. Ed. 2011, 50, 8333–8337
- van Wilderen \latinet al. 2014 van Wilderen, L. J. G. W.; Kern-Michler, D.; Mueller-Werkmeister, H. M.; Bredenbeck, J. Vibrational dynamics and solvatochromism of the label SCN in various solvents and hemoglobin by time dependent IR and 2D-IR spectroscopy. Phys. Chem. Chem. Phys. 2014, 16, 19643–19653
- Lee \latinet al. 2018 Lee, G.; Kossowska, D.; Lim, J.; Kim, S.; Han, H.; Kwak, K.; Cho, M. Cyanamide as an Infrared Reporter: Comparison of Vibrational Properties between Nitriles Bonded to N and C Atoms. J. Phys. Chem. B 2018, 122, 4035–4044
- Hamm and Zanni 2011 Hamm, P.; Zanni, M. Concept and Methods of 2D Infrared Spectroscopy; Cambridge University Press, 2011
- Hamm \latinet al. 1998 Hamm, P.; Lim, M.; Hochstrasser, R. Structure of the Amide I Band of Peptides Measured by Femtosecond Nonlinear-Infrared Spectroscopy. J. Phys. Chem. B 1998, 5647, 6123–6138
- Zanni \latinet al. 2001 Zanni, M. T.; Asplund, M. C.; Hochstrasser, R. Two Dimensional Heterodyned and Stimulated Infrared Photon Echoes of N-Methylacetamide-D. J. Chem. Phys. 2001, 114, 4579–4590
- Woutersen \latinet al. 2001 Woutersen, S.; Mu, Y.; Stock, G.; Hamm, P. Hydrogen-bond lifetime measured by time-resolved 2D-IR spectroscopy: N-methylacetamide in methanol. Chem. Phys. 2001, 266, 137–147
- Wang \latinet al. 2011 Wang, L.; Middleton, C. T.; Zanni, M. T.; Skinner, J. L. Development and Validation of Transferable Amide I Vibrational Frequen cy Maps for Peptides. J. Phys. Chem. B 2011, 115, 3713–3724
- Cazade \latinet al. 2014 Cazade, P.-A.; Bereau, T.; Meuwly, M. Computational Two-Dimensional Infrared Spectroscopy without Maps: N-Methylacetamide in Water. J. Phys. Chem. B 2014, 118, 8135–8147
- Yadav and Chandra 2015 Yadav, V. K.; Chandra, A. First-principles simulation study of vibrational spectral diffusion and hydrogen bond fluctuations in aqueous solution of N-methylacetamide. J. Phys. Chem. B 2015, 119, 9858–9867
- Gaigeot \latinet al. 2005 Gaigeot, M. P.; Vuilleumier, R.; Sprik, M.; Borgis, D. Infrared Spectroscopy of N-Methylacetamide Revisited by ab initio Molecular Dynamics Simulations. J. Chem. Theo. Comp. 2005, 1, 772–789
- Cazade and Meuwly 2012 Cazade, P.-A.; Meuwly, M. Oxygen Migration Pathways in NO-bound Truncated Hemoglobin. Chem. Phys. Chem. 2012, 4276–4286
- Koziol \latinet al. 2015 Koziol, K. L.; Johnson, P. J. M.; Stucki-Buchli, B.; Waldauer, S. A.; Hamm, P. Fast Infrared Spectroscopy of Protein Dynamics: Advancing Sensitivity and Selectivity. Curr. Op. Struct. Biol. 2015, 34, 1–6
- Cho \latinet al. 1994 Cho, M.; Fleming, G. R.; Saito, S.; Ohmine, I.; Stratt, R. M. Instantaneous normal mode analysis of liquid water. J. Chem. Phys. 1994, 100, 6672–6683
- Salehi \latinet al. 2019 Salehi, S. M.; Koner, D.; Meuwly, M. Vibrational Spectroscopy of N in the Gas and Condensed Phase. J. Phys. Chem. B 2019, 123, 3282–3290
- Koner \latinet al. 2020 Koner, D.; Salehi, M.; Mondal, P.; Meuwly, M. Non-conventional Force Fields for Applications in Spectroscopy and Chemical Reaction Dynamics. J. Chem. Phys. 2020, 153, 10901–10912
- Wang \latinet al. 2011 Wang, L.; Middleton, C. T.; Zanni, M. T.; Skinner, J. L. Development and Validation of Transferable Amide I Vibrational Frequency Maps for Peptides. J. Phys. Chem. B 2011, 115, 3713–3724
- Woutersen and Hamm 2000 Woutersen, S.; Hamm, P. Structure Determination of Trialanine in Water Using Polarization Sensitive Two-Dimensional Vibrational Spectroscopy. J. Phys. Chem. B 2000, 104, 11316–11320
- Woutersen \latinet al. 2002 Woutersen, S.; Pfister, R.; Hamm, P.; Mu, Y.; Kosov, D. S.; Stock, G. Peptide Conformational Heterogeneity Revealed from Nonlinear Vibrational Spectroscopy and Molecular-Dynamics Simulations. J. Chem. Phys. 2002, 117, 6833–6840
- Woutersen \latinet al. 2001 Woutersen, S.; Mu, Y.; Stock, G.; Hamm, P. Subpicosecond conformational dynamics of small peptides probed by two-dimensional vibrational spectroscopy. Proc. Natl. Acad. Sci. 2001, 98, 11254–11258
- Schweitzer-Stenner \latinet al. 2001 Schweitzer-Stenner, Q. H. R.; Eker, F.; Griebenov, K. Dihedral Angles of Trialanine in D2O Determined by Combining FTIR and Polarized Visible Raman Spectroscopy. J. Am. Chem. Soc. 2001, 123, 9628–9633
- Woutersen and Hamm 2001 Woutersen, S.; Hamm, P. Isotope-edited two-dimensional vibrational spectroscopy of trialanine in aqueous solution. J. Chem. Phys. 2001, 114, 2727–2737
- Mu and Stock 2002 Mu, Y.; Stock, G. Conformational Dynamics of Trialanine in Water : A Molecular Dynamical Study. J. Phys. Chem. B 2002, 106, 5294–5301
- Graf \latinet al. 2007 Graf, J.; Nguyen, P. H.; Schwalbe, H. Structure and dynamics of the homologous series of alanine peptides: a joint molecular dynamics/NMR study. J. Am. Chem. Soc. 2007, 129, 1179–1189
- Gorbunov \latinet al. 2007 Gorbunov, R. D.; Nguyen, P. H.; Kobus, M.; Stock, G. Quantum-classical description of the amide I vibrational spectrum of trialanine. J. Chem. Phys. 2007, 126, 02B601
- Oh \latinet al. 2010 Oh, K. I.; Lee, K. K.; Cho, M. Circular dichroism eigen spectra of polyproline II and -strand conformers of trialanine in water: singular value decomposition analysis. Chirality 2010, 22, E186–E201
- Xiao \latinet al. 2014 Xiao, X.; Kallenbach, N.; Zhang, Y. Peptide conformation analysis using an integrated Bayesian approach. J. Chem. Theo. Comput. 2014, 10, 4152–4159
- Feng \latinet al. 2018 Feng, C. J.; Dhayalan, B.; Tokmakoff, A. Refinement of Peptide Conformational Ensemblesby 2D IR Spectroscopy: Application to Ala‒Ala‒Ala. Biophys. J. 2018, 114, 2820–2832
- Jorgensen \latinet al. 1983 Jorgensen, W. L.; Chandrasekhar, J.; Madura, J. D.; Impey, R. W.; Klein, M. L. Comparison of Simple Potential Functions for Simulating Liquid Water. J. Chem. Phys. 1983, 79, 926–935
- Brooks \latinet al. 2009 Brooks, B. R.; Brooks, C. L., III; Mackerell, A. D., Jr.; Nilsson, L.; Petrella, R. J.; Roux, B.; Won, Y.; Archontis, G.; Bartels, C.; Boresch, S. \latinet al. CHARMM: The Biomolecular Simulation Program. J. Comp. Chem. 2009, 30, 1545–1614
- Bereau \latinet al. 2013 Bereau, T.; Kramer, C.; Meuwly, M. Leveraging Symmetries of Static Atomic Multipole Electrostatics in Molecular Dynamics Simulations. J. Chem. Theo. Comp. 2013, 9, 5450–5459
- Kramer \latinet al. 2012 Kramer, C.; Gedeck, P.; Meuwly, M. Atomic Multipoles: Electrostatic Potential Fit, Local Reference Axis Systems and Conformational Dependence. J. Comp. Chem. 2012, 33, 1673–1688
- Vanommeslaeghe \latinet al. 2010 Vanommeslaeghe, K.; Hatcher, E.; Acharya, C.; Kundu, S.; Zhong, S.; Shim, J.; Darian, E.; Guvench, O.; Lopes, P.; Vorobyov, I. \latinet al. CHARMM General Force Field: A Force Field for Drug-Like Molecules Compatible with the CHARMM All-Atom Additive Biological Force Fields. J. Comp. Chem. 2010, 31, 671–690
- Darden \latinet al. 1993 Darden, T.; York, D.; Pedersen, L. Particle mesh Ewald: An Nlog(N) method for Ewald sums in large systems. J. Chem. Phys. 1993, 98, 10089–10092
- van Gunsteren and Berendsen 1977 van Gunsteren, W.; Berendsen, H. Algorithms for Macromolecular Dynamics and Constraint Dynamics. Mol. Phys. 1977, 34, 1311–1327
- Elstner \latinet al. 1998 Elstner, M.; Porezag, D.; Jungnickel, G.; Elsner, J.; Haugk, M.; Frauenheim, T.; Suhai, S.; Seifert, G. Self-consistent-charge density-functional tight-binding method for simulations of complex materials properties. Phys. Rev. B 1998, 58, 7260–7268
- Cui \latinet al. 2001 Cui, Q.; Elstner, M.; Kaxiras, E.; Frauenheim, T.; Karplus, M. A QM/MM Implementation of the Self-Consistent Charge Density Functional Tight Binding (SCC-DFTB) Method. J. Phys. Chem. B 2001, 105, 569–585
- Vanommeslaeghe \latinet al. 2010 Vanommeslaeghe, K.; Hatcher, E.; Acharya, C.; Kundu, S.; Zhong, S.; Shim, J.; Darian, E.; Guvench, O.; Lopes, P.; Vorobyov, I. \latinet al. CHARMM General Force Field (CGenFF): A force field for drug-like molecules compatible with the CHARMM all-atom additive biological force fields. J. Comp. Chem. 2010, 31, 671–690
- Salehi and Meuwly 2021 Salehi, S. M.; Meuwly, M. Site-selective dynamics of azidolysozyme. J. Chem. Phys. 2021, 154, 165101
- Adams and Stratt 1990 Adams, J. E.; Stratt, R. M. Instantaneous Normal Mode Analysis as a Probe of Cluster Dynamics. J. Chem. Phys. 1990, 93, 1332–1346
- Buchner \latinet al. 1992 Buchner, M.; Ladanyi, B. M.; Stratt, R. M. The Short-Time Dynamics of Molecular Liquids-Instantaneous-Normal-Mode Theory. J. Chem. Phys. 1992, 97, 8522–8535
- Bastida \latinet al. 2010 Bastida, A.; Soler, M. A.; Zuniga, J.; Requena, A.; Kalstein, A.; Fernandez-Alberti, S. Instantaneous normal modes, resonances, and decay channels in the vibrational relaxation of the amide I mode of N-methylacetamide-D in liquid deuterated water. J. Chem. Phys. 2010, 132, 224501
- Sun and Stratt 2013 Sun, X.; Stratt, R. M. How a solute-pump/solvent-probe spectroscopy can reveal structural dynamics: Polarizability response spectra as a two-dimensional solvation spectroscopy. J. Chem. Phys. 2013, 139, 044506
- Schmidt \latinet al. 2007 Schmidt, J.; Roberts, S.; Loparo, J.; Tokmakoff, A.; Fayer, M.; Skinner, J. Are water simulation models consistent with steady-state and ultrafast vibrational spectroscopy experiments? Chem. Phys. 2007, 341, 143–157
- Woutersen \latinet al. 2002 Woutersen, S.; Pfister, R.; Hamm, P.; Mu, Y.; Kosov, D.; Stock, G. Peptide conformational heterogeneity revealed from nonlinear vibrational spectroscopy and molecular-dynamics simulations. J. Chem. Phys. 2002, 117, 6833–6840
- Decamp \latinet al. 2005 Decamp, M. F.; Deflores, L.; Mccracken, J. M.; Tokmakoff, A.; Kwac, K.; Cho, M. Amide I Vibrational Dynamics of N-Methylacetamide in Polar Solvents: The Role of Electrostatic In teraction. J. Phys. Chem. B 2005, 109, 11016–11026
- Laage \latinet al. 2011 Laage, D.; Stirnemann, G.; Sterpone, F.; Rey, R.; Hynes, J. T. Reorientation and allied dynamics in water and aqueous solutions. 2011, 62, 395–416
- Cazade \latinet al. 2015 Cazade, P. A.; Tran, H.; Bereau, T.; Das, A. K.; si, K.; Hamm, P.; Meuwly, M. Solvation of fluoro-acetonitrile in water by 2D-IR spectroscopy : A combined experimental-computational study. J. Chem. Phys. 2015, 142, 212415–212424
- Kubelka and Keiderling 2001 Kubelka, J.; Keiderling, T. Ab Initio Calculation of Amide Carbonyl Stretch Vibrational Frequencies in Solution with Modified Basis Sets. 1. N-methyl Acetamide. J. Phys. Chem. A 2001, 105, 10922–10928
- Jones 1963 Jones, R. L. The infrared spectra of some simple N-substituted amides in the vapor state. J. Mol. Spectrosc. 1963, 11, 411–421
- Devereux \latinet al. 2014 Devereux, M.; Raghunathan, S.; Fedorov, D. G.; Meuwly, M. A novel, computationally efficient multipolar model employing distributed charges for molecular dynamics simulations. J. Chem. Theo. Comp. 2014, 10, 4229–4241
- Unke \latinet al. 2017 Unke, O. T.; Devereux, M.; Meuwly, M. Minimal distributed charges: Multipolar quality at the cost of point charge electrostatics. J. Chem. Phys. 2017, 147, 161712
- Nutt and Meuwly 2003 Nutt, D. R.; Meuwly, M. Theoretical investigation of infrared spectra and pocket dynamics of photodissociated carbonmonoxy myoglobin. Biophys. J. 2003, 85, 3612–3623
- Nutt and Meuwly 2004 Nutt, D. R.; Meuwly, M. Migration in native and mutant myoglobin: Atomistic simulations for the understanding of protein function. Proc. Natl. Acad. Sci. 2004, 101, 5998–6002
- Plattner and Meuwly 2009 Plattner, N.; Meuwly, M. Higher order multipole moments for molecular dynamics simulations. J. Mol. Model. 2009, 15, 687–94
- Plattner and Meuwly 2008 Plattner, N.; Meuwly, M. The role of higher CO-multipole moments in understanding the dynamics of photodissociated carbonmonoxide in myoglobin. Biophys. J. 2008, 94, 2505–2515
- Krüger \latinet al. 2005 Krüger, T.; Elstner, M.; Schiffels, P.; Frauenheim, T. Validation of the density-functional based tight-binding approximation method for the calculation of reaction energies and other data. J. Chem. Phys. 2005, 122, 114110
- Gaus \latinet al. 2013 Gaus, M.; Goez, A.; Elstner, M. Parametrization and benchmark of DFTB3 for organic molecules. J. Chem. Theo. Comp. 2013, 9, 338–354
- Beauchamp \latinet al. 2014 Beauchamp, K. A.; Pande, V. S.; Das, R. Bayesian energy landscape tilting: towards concordant models of molecular ensembles. BioPhys. J. 2014, 106, 1381–1390
- Jansen \latinet al. 2006 Jansen, T. l. C.; Dijkstra, A. G.; Watson, T. M.; Hirst, J. D.; Knoester, J. Modeling the amide I bands of small peptides. J. Chem. Phys. 2006, 125, 044312
- Reppert and Tokmakoff 2013 Reppert, M.; Tokmakoff, A. Electrostatic frequency shifts in amide I vibrational spectra: Direct parameterization against experiment. J. Chem. Phys. 2013, 138, 134116