Photoluminescence spectra of point defects in semiconductors: validation of first principles calculations
Abstract
Optically and magnetically active point defects in semiconductors are interesting platforms for the development of solid-state quantum technologies. Their optical properties are usually probed by measuring photoluminescence spectra, which provide information on excitation energies and on the interaction of electrons with lattice vibrations. We present a combined computational and experimental study of photoluminescence spectra of defects in diamond and SiC, aimed at assessing the validity of theoretical and numerical approximations used in first principles calculations, including the use of the Franck-Condon principle and the displaced harmonic oscillator approximation. We focus on prototypical examples of solid-state qubits, the divacancy centers in SiC and the nitrogen-vacancy in diamond, and we report computed photoluminescence spectra as a function of temperature that are in very good agreement with the measured ones. As expected we find that the use of hybrid functionals leads to more accurate results than semilocal functionals. Interestingly our calculations show that constrained density functional theory (CDFT) and time-dependent hybrid DFT perform equally well in describing the excited state potential energy surface of triplet states; our findings indicate that CDFT, a relatively cheap computational approach, is sufficiently accurate for the calculations of photoluminescence spectra of the defects studied here. Finally, we find that only by correcting for finite-size effects and extrapolating to the dilute limit, one can obtain a good agreement between theory and experiment. Our results provide a detailed validation protocol of first principles calculations of photoluminescence spectra, necessary both for the interpretation of experiments and for robust predictions of the electronic properties of point defects in semiconductors.
I Introduction
The last two decades have witnessed the rapid development of quantum information technologies based on solid state platforms, in particular optically addressable spin-defects in semiconductors and insulators [1, 2, 3, 4]. The opto-electronic properties of point defects used to realize qubits are most often probed by measuring photoluminescence (PL) spectra, which yield information about excitation energies and the interaction of the excited electrons with lattice vibrations.
A PL experiment collects the photons emitted when an excited electron radiatively decays to the ground state (GS), and PL spectra of defects usually exhibit a narrow zero-phonon line (ZPL) and a broad phonon side band (PSB); the latter originates from decay processes that involve structural relaxation and thus the coupling of electrons and phonons. The strength of such coupling can be inferred from the Debye–Waller factor (DWF) [5] that is proportional to the ratio between the emission intensity of the ZPL and that of the entire spectrum. Applications that require photon coherence or interference benefit from points defects whose PL signal exhibits a high DWF, indicating a weak coupling between phonons and electrons. The average number of phonons emitted during an electronic transition is instead quantified by the Huang-Rhys factor (HRF) [6, 5], which can be estimated from measured spectra from the logarithm of the DWF.
As for many properties of condensed systems, Density Functional Theory (DFT) has turned out to be a valuable tool to compute PL spectra, which are used to interpret experiments as well as to provide predictions of the fingerprints of specific defects in materials [7, 8, 9]. For example, first principles spectra based on DFT have been recently reported for nitrides, e.g., GaN [10, 11], AlN [12], and hexagonal born nitride (h-BN) [13, 14, 15, 16, 17, 18], diamond [19, 20, 21, 22, 23, 24, 25, 26, 27, 28, 29], silicon carbide (SiC) [30, 31, 32, 33], and monolayers of transition metal dichalcogenides (TMDC) [34]. These studies have been performed with several useful computational approaches; however, a systematic assessment of the theoretical and numerical approximations adopted in PL calculations has not yet been conducted.
In this work, we present a joint theoretical and experimental study of the PL spectra of prototypical spin-defects in diamond and SiC. We focus on the negatively charged nitrogen-vacancy (NV-) in diamond [5, 35, 36, 37, 38, 39] and the neutral divacancy (VV, abbreviated as VV0) centers in hexagonal 4H-SiC which have been recently suggested as promising platforms for quantum sensors [40, 41, 42, 43]. While the NV- center has just one possible geometrical configuration in the GS, the VV0 centers may attain four different geometries due to the layered structure of 4H-SiC, giving rise to different PL signals. We discuss the comparison between theoretical and experimental PL spectra as a function of temperature, as well as HRFs and DWFs, and we present a detailed assessment of the theoretical and numerical approximations involved in first principles calculations. These approximations include the choice of the density functional, the method adopted to describe excited state (ES) potential energy surfaces, finite supercell size and approximations based on the Franck-Condon (FC) principle and the displaced harmonic oscillator (DHO) approximation.
We compare constrained DFT (CDFT) [44] calculations of ES potential energy surfaces of triplet states with those carried out with time-dependent DFT (TDDFT), which enable the description of the ES as a linear combination of multiple Slater determinants. In our TDDFT calculations we use hybrid functionals with the fraction of exact exchange determined by the dielectric constant of the system; based on recent studies, these calculations are expected to yield results in good agreement with the solutions of the Bethe-Salpeter equation [45, 46]. So far, TDDFT has only been employed to describe spin defects with cluster models and atomic centered basis sets [47, 48, 49, 26, 29] and here we present a comparison between CDFT and TDDFT calculations carried out for the same supercell and using the same plane-wave basis sets and density functional. We also investigate finite size effects which affect defect-host interactions and present results for PL line shapes converged to supercells with more than 10,000 atoms, following the approach proposed by Alkauskas et al. [19, 50, 28]. Finally, we provide a qualitative assessment of the accuracy of the FC principle and the the displaced harmonic oscillator (DHO) approximation. By conducting fully converged hybrid functional calculations for the electronic properties, we obtain good agreement with measured spectra over a wide temperature range, with small differences between PL line shapes obtained with phonons computed with semilocal or hybrid functionals.
The rest of the paper is organized as follows. In Sec. II we discuss the methodology for computing PL spectra using the Huang-Rhys (HR) theory within the generating function formulation, highlighting all theoretical and numerical approximations. In Sec. III, we give the details of first-principles calculations and experiments. In Sec. IV, results on the chosen defects in SiC and diamond, including ZPLs, HRFs, DWFs and PL line shapes are discussed. Conclusions are given in Sec. V.
II Theory and computational methodology

Based on Fermi’s golden rule and the FC principle, the PL spectrum generated by the optical transitions from the ES to the GS potential energy surfaces, as a function of the photon energy , is expressed as [19]:
| (1) | ||||
where is the electronic transition dipole moment; is the refractive index of the material; () is the -th (-th) nuclear wavefunction of the system in the GS (ES) with vibrational energy (); is the energy of the ZPL (see Fig. 1). The thermal distribution function of the vibrational energy in the ES is
| (2) |
where is the Boltzmann constant. For an ordered solid, under the harmonic approximation we express the nuclear wavefunctions as products of vibrational wavefunctions:
| (3) |
where () is the number of -th phonons in the -th (-th) vibrational state of the GS (ES), and is the -th excited state of the -th phonon mode. The vibrational energies in the GS and ES are:
| (4) |
where () is the frequency of -th phonon in the GS (ES). Note that by definition Eq. 4 does not include the zero point energy which is included in the term .
A commonly used approximation is the so called displaced harmonic oscillator (DHO) approximation, (or HR theory [6]), where Eq. 1 is simplified by assuming that the potential energy surface of the ES and the GS are identical except for a rigid displacement due to the difference in their equilibrium structures, i.e., (the superscript and will hence be omitted), and:
| (5) | ||||
where is the partial HRF and accounts for the average number of -th phonons that participate in the transition. are the associated Laguerre polynomials [51]. For the calculations of PL line shapes, only the phonons of the GS are computed and used within the DHO approximation. At zero temperature, Eq. 1 may be further approximated by setting to zero the vibrational energy in the ES (i.e., we only consider , and ), namely:
| (6) | ||||
To avoid the evaluation of the overlap integrals entering Eq. 5 and the sum over all vibrational states of the GS and the ES, we adopt the generating function approach [52, 53] to compute PL spectra. In the DHO approximation Eq. 1 can be obtained as the Fourier transform of the generating function :
| (7) |
where
| (8) | ||||
and accounts for the broadening of the line shape. is the average occupation number of the -th phonon mode:
| (9) |
In practice, one may write Eq. 8 as the following alternative expression:
| (10) |
where and are evaluated as the Fourier transforms of the spectral densities:
| (11) |
| (12) |
In Eqs. 11-12, the -functions are replaced by Gaussian functions with -dependent broadening to account for a continuum of vibrational modes participating in the optical transition (see Sec. IV.2).
At zero temperature, we have and , and Eq. 7 is equivalent to Eq. 6 with the -function replaced by a Lorentzian function with a broadening . In order to evaluate Eq. 7, the partial HRF , , and phonon frequencies are required as input. We compute as:
| (13) |
where is the mass-weighted displacement along the -th mode, evaluated as:
| (14) |
In Eq. 14, is the eigenvector of the -th phonon mode on the -th atom in the -th direction; is the mass of the -th atom, and is the displacement between the ES and the GS equilibrium atomic structures in the -th direction. Within the harmonic approximation, may be equivalently computed as [19]:
| (15) |
Here is the GS force on the -th atom in the -th direction evaluated at the ES equilibrium structure.
In this work, we simulate PL spectra at finite temperature using Eq. 7, with parameters computed from first principles. In particular, we use DFT to obtain the GS equilibrium atomic structure, , the GS forces, , the phonon modes, , and the phonon frequencies ; the ES equilibrium atomic structure, , is obtained with CDFT and, in some cases validated by carrying out TDDFT calculations. The resulting PL line shapes are then compared with measured PL spectra at finite temperature. Below, we report our results and we systematically investigate the validity of the chosen theoretical and numerical approximations, including the use of the FC and the DHO approximations, which are at the core of the HR theory.
III Technical details
III.1 First principles calculations
The electronic structures of the defects in diamond and 4H-SiC are obtained using DFT and the planewave pseudopotential method, as implemented in the Quantum Espresso package [54, 55, 56]. The planewave energy cutoff was set to 80 Ry. We used SG15 ONCV norm-conserving pseudopotentials [57, 58] and the semi-local functional by Perdew, Burke, and Ernzerhof (PBE) [59], the dielectric dependent hybrid (DDH) functional [60] and the screened hybrid functional by Heyd, Scuseria, and Ernzerhof (HSE) [61, 62]. The fraction of exact exchange used in the DDH functional was determined by the inverse of the macroscopic dielectric constant of the system, resulting in 18% and 15% of exact exchange for diamond and 4H-SiC [60, 63], respectively. The macroscopic dielectric constants were computed by including the full response of the electronic density to the perturbing external electric field at the level of hybrid functional, and the fraction of exact exchange was self-consistently determined from the dielectric constant [60].
We used a supercell with 512 atomic sites and a supercell with 400 atomic sites for the NV- center in diamond and VV0 centers in 4H-SiC, respectively. In the cases of VV0 centers in 4H-SiC, convergence tests were carried out with large supercells (up to ). We used the lattice constant optimized with each specific functional (see Tab. S1 of the Supplementary Information (SI) [64]). The Brillouin zone was sampled with the point.
The paramagnetic ESs were computed using the CDFT (also called SCF) method, where one electron is promoted from the highest occupied to the lowest unoccupied state in the same spin channel (see Sec. II of the SI for details of CDFT calculations). The energy was computed as the difference of the total energy of the relaxed ES (with CDFT) and that of the GS. The CDFT method has been shown to yield reliable results for systems with localized electronic states, e.g., the NV- center in diamond [44] and VV0 centers in 4H-SiC [65, 42, 33]. We also performed TDDFT calculations within the Tamm-Dancoff approximation to assess the accuracy of our CDFT results. We obtained the ES low-lying energies and eigenvectors by iteratively diagonalizing the linearized Liouville operator, as implemented in the WEST code [66, 67]. Due to the higher computational cost of TDDFT calculations, we used a supercell and a supercell for the NV- center in diamond and VV0 centers in 4H-SiC, respectively.
Phonon modes of bulk and defective solids were computed using the frozen phonon approach, with configurations generated with the PHONOPY package [68] and a displacement of 0.01 Å from equilibrium structures. Phonon calculations for pristine bulk systems were carried out with the PBE, DDH and HSE functionals, but those for defective solids were performed only with PBE due to the high computational cost of hybrid functionals. We then approximated the values of hybrid-DFT phonons by using a scaling factor equal to the ratio of hybrid-DFT and PBE phonon results in the pristine bulk systems. We verified that this approximation yields accurate phonon frequencies for bulk systems (see Sec. IV of the SI for details). We evaluated finite size effects on computed PL line shapes, HRFs and spectral densities following the force constant matrix embedding approach proposed by Alkauskas et al. [19, 50, 28] (see Sec. V of the SI).
III.2 Experiments
The SiC experiments were realized in a confocal microscopy setup (0.67 NA objective) with the sample in a closed-cycle cryostat at 10 K, unless mentioned otherwise. The sample was diced from a commercial high-purity semi-insulating 4H-SiC wafer (Cree) containing intrinsic concentrations of VV0 (1015- cm-3). The sample was excited within the VV0 absorption sideband with a 908 nm laser (QPhotonics, 100 mW), and the resulting PL was filtered using several 1000 nm long-pass filters. The PL was then measured using a spectrometer with a 300 g/mm grating blazed for and an InGaAs camera (Teledyne Princeton Instruments) with a spectral resolution of 0.3 nm. Careful calibration was performed to correct for the entire setup transmission and the camera response using a NIST calibrated tungsten-halogen white light source (StellarNet). Optically-detected magnetic resonance at a weak static magnetic field (20 G) with microwave excitation delivered using a printed circuit board was used to obtain independent contrast (i.e., the difference in PL with and without microwave excitation) for the various VV0 sites. The DWF is calculated as the ratio of the integrated intensity of the ZPL to the total integrated intensity. Though most of the PL is within our detection bandwidth (900-1600 nm), the sideband may be very slightly underestimated due to weak emission extending beyond this range.
Similarly, for the NV- center in diamond, the PL spectra were taken on an ensemble of NV- centers using a home-built confocal microscope with a flow cryostat (Janis - LakeShore Cryotronics) for temperature studies. The sample was a IB diamond (Sumitomo) with a high nitrogen concentration synthesized via high-pressure / high-temperature growth. The sample was electron irradiated (2 MeV, 1017 cm-2) and annealed (850 °C, 2 hr) resulting in a high density of NV- centers. The NV- center ensemble was photo-excited within the absorption sideband using 532 nm light and the PL measurements were collected using a high resolution spectrometer with a visible camera (Teledyne Princeton Instruments) with 0.1 nm spectral resolution. The spectrum intensity was also calibrated using a tungsten halogen light source (Ocean Optics) to correct for transmission losses in the experimental set-up.
IV Results and Discussion
IV.1 Zero-phonon lines

The NV- center in diamond is composed of a nitrogen impurity and an adjacent carbon vacancy (VC) with an additional electron, as shown in Fig. 2(a) [37, 38]. It has symmetry, and three defect orbitals are present within the band gap of diamond: the orbital and the two-fold degenerate orbitals, as shown in Fig. 3(a). Defect orbitals are mainly localized on three carbon atoms around the (see Fig. S1 of the SI).
The neutral divacancy center in 4H-SiC is composed of a silicon vacancy (VSi) and an adjacent carbon vacancy (VC) and is denoted as VSiV [41, 40]. We consider the 4H polytype of SiC, 4H-SiC, with ABCB stacking along the c-axis. 4H-SiC contains two nonequivalent hexagonal () and quasi-cubic () sites for each type of atom, as shown in Fig. 2(b). Therefore, the VV0 center can occur in four distinct configurations (, , and ), and the experimentally measured PL ensemble is a mixture of contributions from all configurations. Experimentally, we used microwave-assisted spectroscopy to separate the PL of different configurations. In our computational study, we considered the , , and configurations denoted as -VV0, -VV0 and -VV0. The first two -axis orientated defects (-VV0 and -VV0) have symmetry, with an state and two sets of degenerate states within the band gap of 4H-SiC (see Fig. 3(b)). The orbital and lower orbitals are mainly localized on three carbon atoms around the (see Fig. S1 of the SI). For NV-, -VV0 and -VV0, we studied the optical transition between the orbital and the (lower) orbitals, which corresponds to the transition between the and the many-body states. For the configuration, which has symmetry, we studied the and the transition accounting for the transition between the and the state.

We computed using the PBE, DDH, and HSE functionals in the DHO approximation (note that the zero-point energy contributions of the GS and ES phonons cancel out within the DHO approximation). Triplet ESs were computed using CDFT with electronic configuration (see Sec. II of the SI for details of CDFT calculations). Results for all defect systems at different levels of theory are summarized in Tab. 1. The PBE functional underestimates the measured of the NV- by 0.24 eV, while the DDH and HSE functionals overestimate it by 0.26 eV. In the case of VV0 centers, particular attention must be exercised to account for finite size effects. For small cells (e.g. supercell), the experimental order of the ZPL of the various defect configurations is not reproduced. Hence we computed at the PBE level of theory for and supercells; we then used the difference between these two values to estimate the converged hybrid-DFT starting from our results obtained with supercells. The converged results reproduce the experimental trend. Similar to our results for diamond, we find that the PBE functional underestimates the measured of the VV0 centers by 0.16 eV, while the DDH (HSE) yields an overestimate of 0.11 eV (0.12 eV). Tab. 1 summarizes our results and previously reported theoretical predictions of . We note that although the obtained with the HSE functional is generally in good agreement with experiments, theoretical results exhibit a variance up to 0.3 eV due to different choices of pseudopotentials, supercell sizes and sampling of the reciprocal space.
| Hosts | Defects | This work | Previous Theoretical Work | Expt. | ||||
| PBE | DDH | HSE | PBE | DDH | HSE | |||
| Diamond | NV- | 1.706 | 2.205 | 2.205 | 1.72111Ref. [63]: Calculations were carried out using the Quantum Espresso package with ONCV pseudopotentials (PPs). The planewave energy cutoff was set to 75 Ry. The Brillouin zone was sampled with the point. A () supercell was used for NV- (-VV0)., 1.706222Ref. [44]: Calculations were carried out using the VASP code with PAW PPs. The planewave energy cutoff was set to 420 eV. The Brillouin zone was sampled with the point. A supercell was used for NV-. | 2.22 | 2.23, 1.955 | 1.945 [37] |
| 4H-SiC | -VV0 | 1.086 (0.937) | 1.346 (1.196) | 1.371 (1.221) | 1.03, 0.92333Ref. [42]: Calculations were carried out using the VASP code with PAW PPs. The Brillouin zone was sampled with the point. A () supercell was used for PBE (HSE) calculations. HSE was computed with PBE structure. | 1.30 | 1.33, 1.056, 1.13444Ref. [65]: Calculations were carried out using the VASP code with PAW PPs. The planewave energy cutoff was set to 400 eV. The Brillouin zone was sampled using a k-point mesh. A supercell was used for VV0., 1.14555Ref. [33]: Calculations were carried out using the VASP code with PAW PPs. The planewave energy cutoff was set to 400 eV. The Brillouin zone was sampled with the point. A supercell was used for VV0. HSE was computed with PBEsol structure. | 1.095 |
| -VV0 | 1.105 (0.951) | 1.355 (1.201) | 1.372 (1.218) | 0.94 | 1.044, 1.14 | 1.096 | ||
| -VV0 | 1.075 (0.979) | 1.355 (1.259) | 1.365 (1.269) | 0.97 | 1.103, 1.21 | 1.149 | ||
To estimate the accuracy of CDFT for the ES potential energy surface, we compared results obtained with CDFT and TDDFT for NV-, -VV0, and -VV0 at the DDH level of theory. TDDFT enables the description of the ES as a linear combination of multiple Slater determinants. In our TDDFT calculations we use hybrid functionals with the fraction of exact exchange determined by the dielectric constant of the system; based on recent studies, these calculations are expected to yield results in good agreement with the solutions of the Bethe Salpeter equation [45, 46]. Previous TDDFT studies of these defect systems used cluster models and atomic-centered basis sets [47, 48, 26]. Here we consistently compared TDDFT and CDFT calculations performed with the same basis set and pseudopotential, in the same cell and with the same functional. After obtaining the equilibrium structure of the ES using the CDFT approach, we selected several configurations along the linear path connecting equilibrium atomic structures of the GS and the ES, and carried out single-point DFT, CDFT, and TDDFT calculations, from which configuration coordinate diagrams were obtained, as shown in Fig. 4. The comparison between TDDFT and CDFT results was carried out using the configuration in CDFT because we could not converge the configuration when using the DDH functional. The difference between CDFT calculations at the PBE level using the and electronic configurations is 0.04 eV; assuming an energy difference of the same order of magnitude at the DDH level, we deemed the CDFT/TDDFT comparison with the configuration to be a meaningful one. We found that the TDDFT energies of the states are 0.1 (0.04) eV smaller than CDFT energies for NV- (VV0); the minimum of the TDDFT curve is close to that of the CDFT curve, with a difference smaller than 6% for all three systems. An analysis of our TDDFT results shows that the spin-conserving transition between the and the orbitals contributes by more than 95% to the whole transition to the state, indicating that the state can be well-described by a single Slater determinant. This finding is in good agreement with that of a previous TDDFT study using a cluster model, atom-centered basis sets and the PBE0 functional [47]. We note that the quality of the agreement between TDDFT and CDFT depends on the functional and the system. For example, we found a difference of 0.2 eV in the excitation energy and a difference greater than 12% in the configuration coordinate of the minimum between TDDFT and CDFT results when using the PBE functional (see Fig. S3 of the SI). In addition, in the case of defect systems with singlet GS and ES, we expect non-negligible differences between TDDFT and CDFT results, since the accurate description of a singlet ES requires a linear combination of at least two Slater determinants [69, 14]. In that case the use of quantum embedding theories (QDET), should be preferable to describe strongly correlated states [70, 71, 72].

To understand the effect of lattice vibrations on optical transitions, we analyzed in detail the mass-weighted displacement computed at different levels of theory (see Sec. III of the SI). The magnitude of the displacement follows the relation: HSE DDH PBE and the difference of the results obtained with different functionals can be up to 10%. The same trend can also be found for energies of bulk phonons, and can be understood by noting that the bonds in the diamond and SiC crystals turn out to be stiffer with HSE than with DDH, which are in turn stiffer than with PBE, as reflected in the difference of predicted lattice constants (see Tab. S1 of the SI). is localized on the neighboring atoms of the defect center, as shown in Fig. 3(c) and (d), consistent with the localization of defect orbitals involved in the optical transition. We also found that the symmetry of the ES is reduced from to for NV-, -VV0 and -VV0, and hence in principle both type and type phonons could participate in the optical process. Although the average symmetry of the ES structure turns out to be due to the dynamic Jahn-Teller effect [73, 22], here we used the ES equilibrium structure with symmetry to include the coupling with type phonons. Hence the ES configuration used is .
IV.2 Huang-Rhys factor and spectral density of the electron-phonon coupling
Tab. 2 summarizes HRFs computed using Eq. 13 at different levels of theory and includes combinations of mass-weighted displacements, , computed with DDH or HSE and phonons computed with PBE. We used a scaling factor (see Sec. IV of the SI) to approximate DDH (HSE) phonon frequencies using PBE results; the factor was evaluated from the ratio of frequencies of bulk systems optical phonons computed at different levels of theory, an approximation that introduces a root-mean-square error (RMSE) of only 0.4 meV for bulk 4H-SiC.
| Hosts | Defects | Cell Size | PBE | DDH | HSE | Expt. | ||
| PBE | PBE | DDH | PBE | HSE | ||||
| Diamond | NV- | 2.94 | 3.20 | 3.32 | 3.46 | 3.64 | 3.49 [35] | |
| 3.0 | 3.2 | 3.3 | 3.5 | 3.7 | 3.49 [35] | |||
| 4H-SiC | -VV0 | 2.55 | 2.55 | 2.64 | 2.72 | 2.86 | 3.30 | |
| 3.0 | 3.0 | 3.0 | 3.2 | 3.3 | 3.30 | |||
| -VV0 | 2.51 | 2.53 | 2.62 | 2.68 | 2.81 | 2.80 | ||
| 2.6 | 2.6 | 2.7 | 2.8 | 2.9 | 2.80 | |||
| -VV0 | 2.26 | 2.46 | 2.54 | 2.53 | 2.66 | 2.58 | ||
| 2.5 | 2.7 | 2.8 | 2.8 | 2.9 | 2.58 | |||
We find that the HRFs computed with the PBE functional are smaller than those computed with hybrid functionals, consistent with the magnitude of the structural relaxations upon optical excitation (see Tab. S2 of the SI). In addition, the HRFs computed with hybrid functionals are larger when phonons are obtained at the DDH (HSE) level, consistent with the fact that the phonon frequencies computed with hybrid functionals are higher than those obtained at the PBE level of theory.
The spectral densities of electron-phonon coupling (Eq. 11) are computed with the supercell for NV- and the supercell for VV0 centers and shown in Fig. 5(a) and (c). The hybrid-DFT peak intensity is higher than that computed with PBE, consistent with the values of the HRF. As for spectral densities at the level of hybrid functionals, we find that peak positions are shifted to higher energies, compared with the PBE results, when phonons are computed with hybrid functionals.

In order to evaluate finite size effects on the HRFs and spectral densities, we need to compute for large supercells with either Eq. 14 or Eq. 15. For the smallest supercell, Eq. 14 and Eq. 15 yield results that differ by less than 3% (see Fig. S6 of the SI); hence for larger supercells we used Eq. 15 which converges more rapidly as a function of the distance from the defect center due to the fact that inter-atomic interactions in diamond and 4H-SiC are short-ranged [19, 50, 28]. Previous work on NV- has shown that forces on atoms that are separated from the defect by more than 5 Å yield a negligible contribution to the HRF [28]. For VV0 centers, we compared results for the HRF and spectral density using forces from a supercell and those from a supercell (see Fig. S7 of the SI). We found a difference less than 5% in the HRFs and the spectral densities are almost identical. In order to obtain phonon frequencies and modes for large supercells, we employed the force constant matrix embedding approach [19], and details can be found in Sec. V of the SI.
The HRFs computed in the dilute limit for NV- ( supercell) and VV0 centers ( supercell) differ by 2% and 5-15% respectively, relative to those obtained with and supercells. Computed HRFs for NV- are in close agreement with previous theoretical predictions [19, 22, 28] and experiments [35]. Computed HRFs for VV0 centers are also in close agreement with our experiments. A previous theoretical work by Hashemi et al. [33] reported a HRF of 2.75 for -VV0. This value falls in the range of our results computed with the supercell and is 15% smaller than our experimental value likely due to finite size effects not being fully taken into account in Ref. [33]. In the dilute limit, we found that the spectral densities are smoother and exhibit a linear tail below 20 meV, reflecting the coupling with long-range acoustic phonons. Detailed analysis of spectral densities and vibrational modes can be found in Sec. VI of the SI.
IV.3 Photoluminescence line shapes and Debye-Waller factors
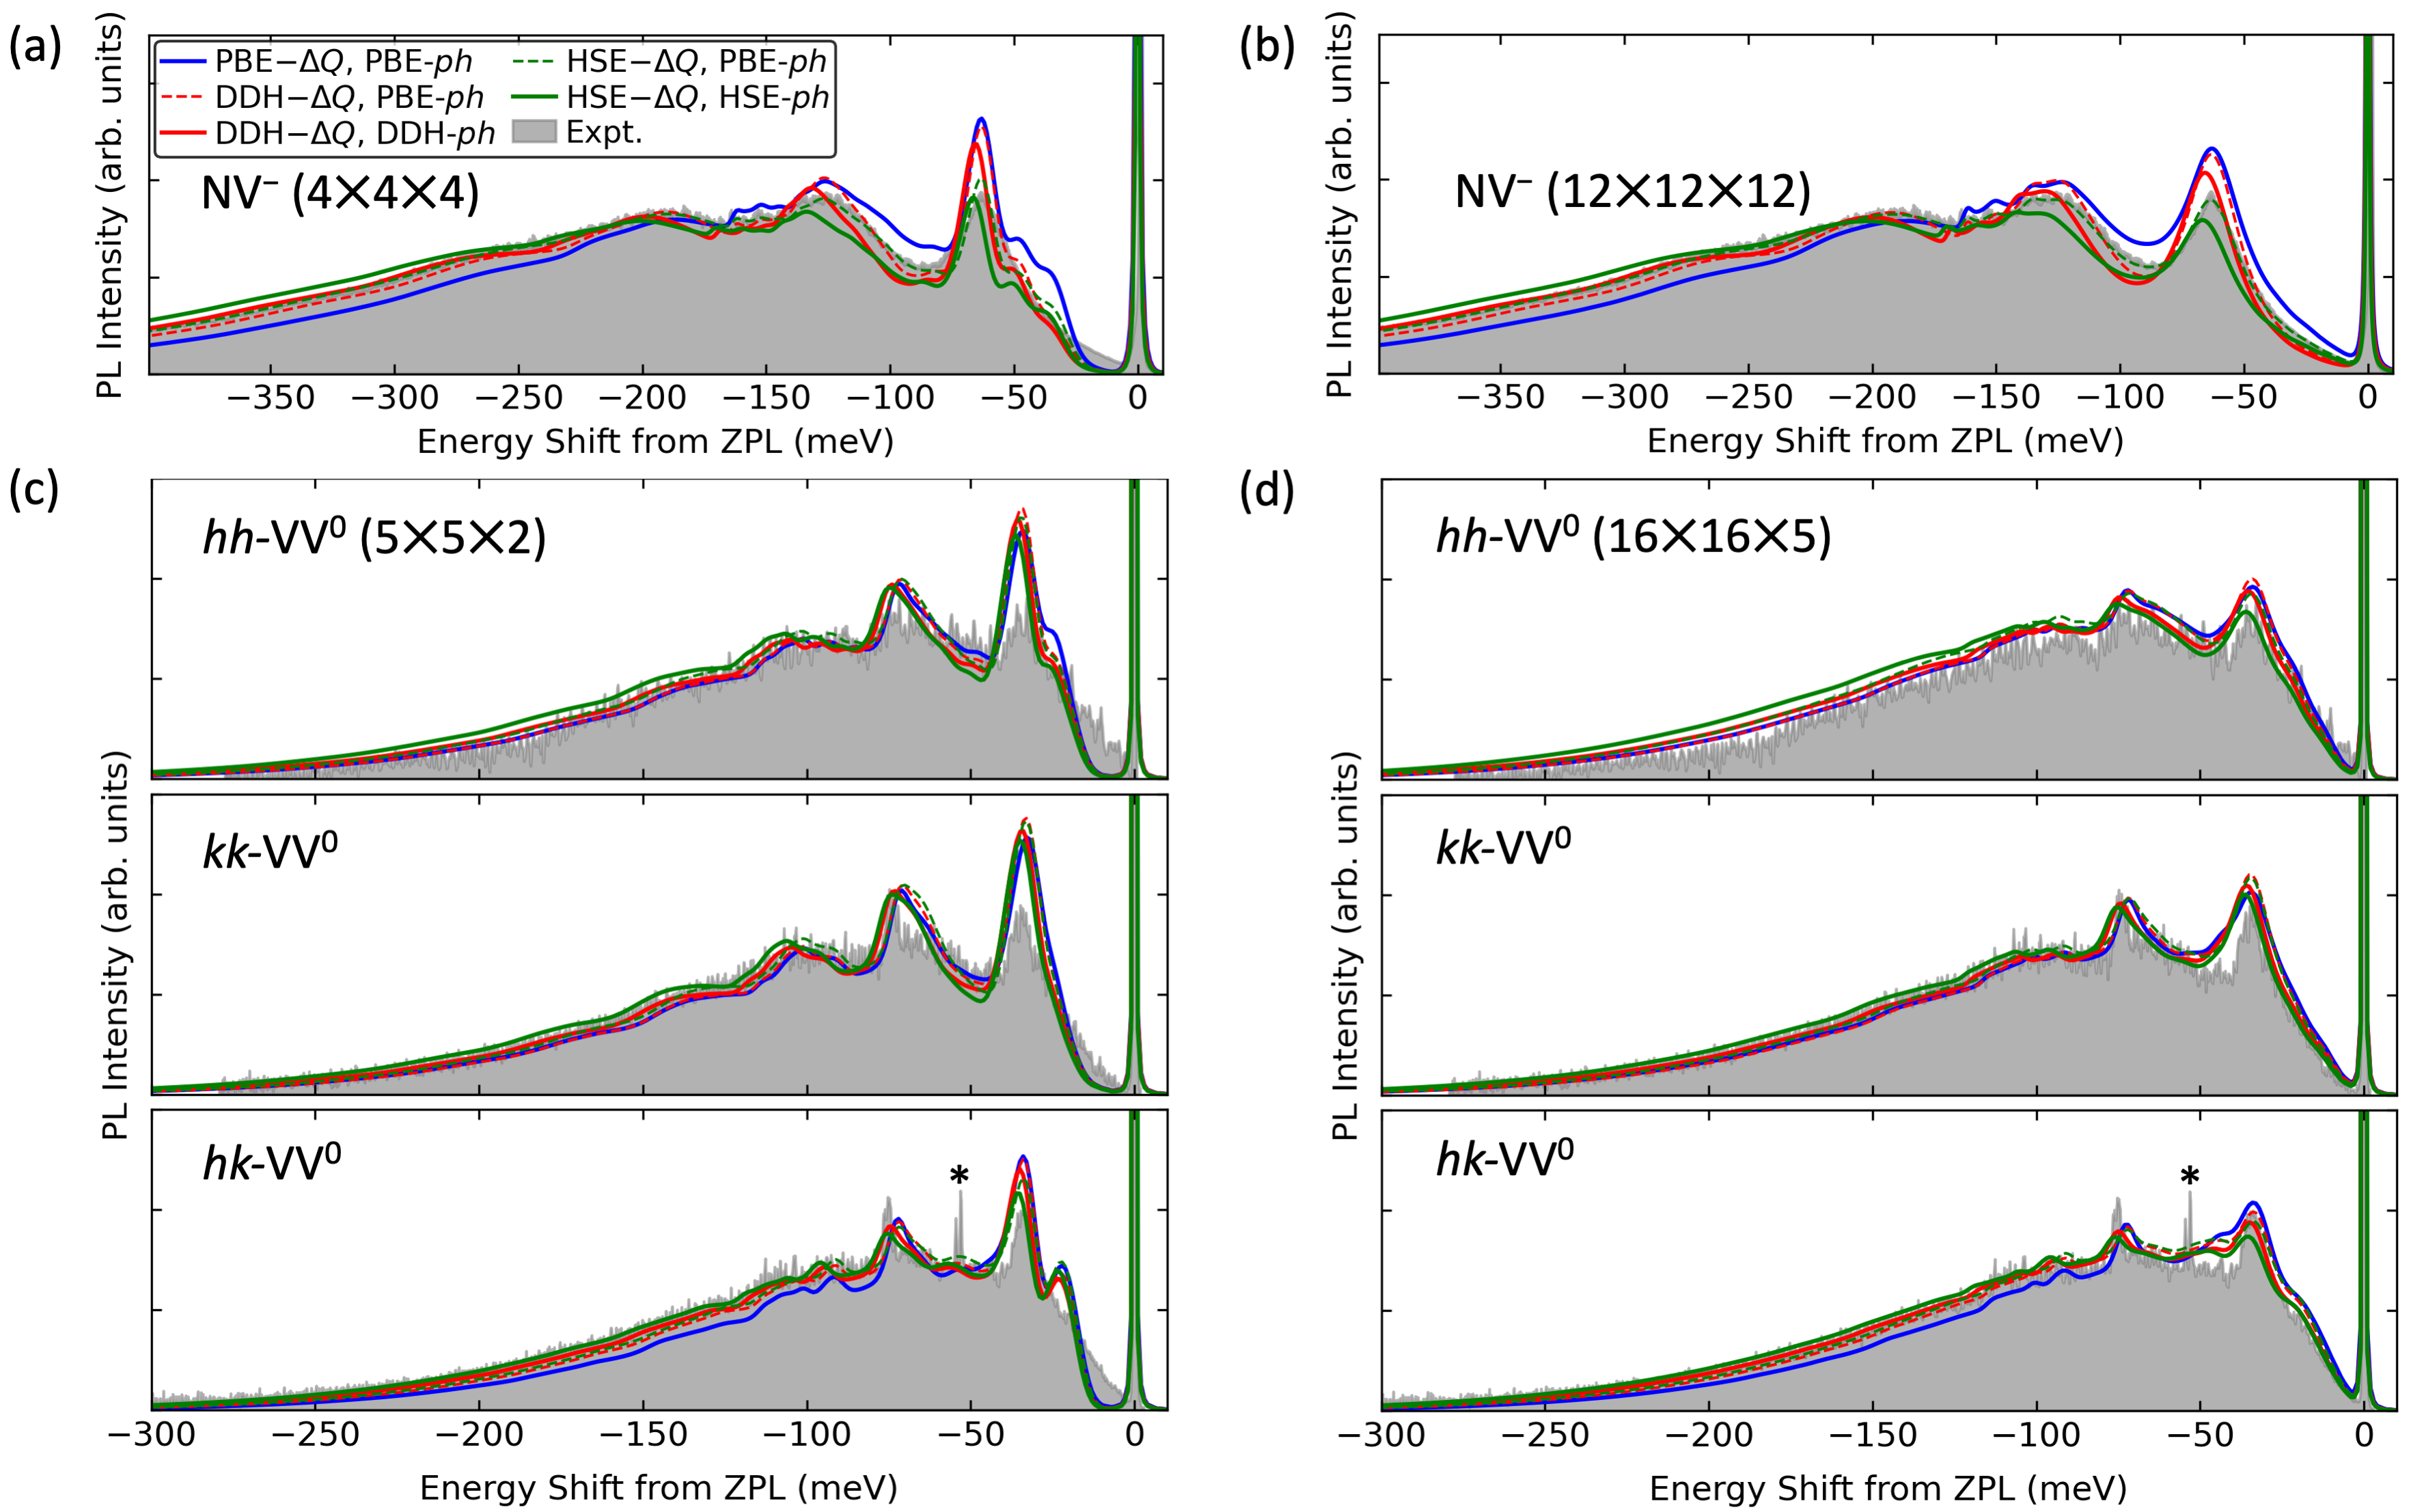
In Fig. 6 we show the PL line shapes computed using the generating function approach (Eq. 7) with HRFs computed at different levels of theory and different supercell sizes, compared with experiment. The spectra consist of a sharp ZPL and a structured PSB. The broadening of the PSB is 500 meV for NV- and 300 meV for VV0 centers. Note that PL line shapes computed with small supercells show sharper peaks and a gap of 5-10 meV between the ZPL and the PSB. The peaks located at 30 (23) meV from the ZPL for NV- (-VV0) also stem from finite size effects. In our calculations, the contribution of the type phonons is computed using the HR theory, which was shown to represent an accurate approximation in the recent work by Razinkovas et al. [28]. These authors computed the contribution of type phonons to the PL and absorption line shapes for NV- by explicitly solving the multi-mode Jahn-Teller problem; they showed that if the HRF of type phonons lies between 0.5 and 1.0, then the HR theory yields reasonable results for the PL line shape. For the NV- and VV0 centers, we find a HRF of type phonons of about 0.5 and 1.0, respectively, indicating that the HR theory should be accurate.
We find that computed and measured line shapes agree well, both in terms of the peak positions and intensity of line shapes, when calculations are performed with the largest supercells ( for NV- and supercell for VV0 centers). When computing phonons with the PBE functional, we find that the PSB is clearly dominated by coupling with the 63 meV phonon for NV-, close to the experimental value 64 meV [35]. The PSB also shows peaks at 122 meV, 135 meV, 150 meV and 161 meV from the ZPL, in good agreement with the experimental values 122 meV, 138 meV, 153 meV and 163 meV [35]. As for the relative intensity of peaks, the best agreement with experiment is obtained using HSE for the calculation of and PBE phonons, respectively. When phonons are computed at the DDH (HSE) level, the 63 meV peak is shifted to 66 (67) meV, and the 161 meV peak to 168 (170) meV. Overall the agreement with experiment is good in all cases.
Similar conclusions can be drawn for the VV0 centers. When computing phonons with PBE, we obtain peak positions at 34 meV and 72 meV from the ZPL in the PSB, in good agreement with experiments. Calculated PSB also exhibits small peaks located at 90 meV from the ZPL, originating from the coupling with high energy phonons. As for the relative intensity of peaks, those computed with DDH or HSE are in slightly better agreement with experiments than with PBE, but generalizations to other defects or materials are difficult to make. When computing phonons with the DDH or HSE functionals, the peaks are slightly shifted to lower energy by 1-3 meV, depending on the peak and the agreement with experiments is improved, although again in all cases we find good agreement with the measured spectra. We emphasize that the ability to resolve phonon side bands is important in order to build predictive capabilities to identify fingerprints of defects using first principle calculations.
From the PL line shape we can obtain the DWF, which is defined as the ratio of the emitted light from the ZPL to the total emitted light. At very low temperature, the DWF is computed as . In Tab. 3 we report the DWFs evaluated for the largest supercells. The experimental and theoretical DWFs (see Sec. III.2) are in good agreement, and in the case of the VV0 centers, we find that the computed DWFs show the trend -VV0 -VV0, consistent with experiments. The relation -VV0 -VV0 can be reproduced at the PBE level of theory. The computed DWF for -VV0 ranges from 3.6% to 5.3%, smaller than that previously reported, 6.39% [33], likely due to an incomplete finite size extrapolation in Ref. [33]. We also note that a recent experiment on VV0 centers reported DWFs of 9% and 10% for -VV0 and -VV0 [74], which we consider here to be overestimates, based on our computed and measured spectra. Overall, when using hybrid functionals to compute the GS and ES electronic structure we obtain a good agreement with experiments, with small differences between results for phonons obtained with PBE or hybrid-functionals, provided an extrapolation to the dilute limit is performed.
| Hosts | Diamond | 4H-SiC | |||
|---|---|---|---|---|---|
| Defects | NV- | -VV0 | -VV0 | -VV0 | |
| PBE | PBE | 5.0 | 5.2 | 7.1 | 8.5 |
| DDH | PBE | 4.1 | 5.3 | 7.2 | 6.8 |
| DDH | 3.7 | 4.8 | 6.6 | 6.1 | |
| HSE | PBE | 3.0 | 4.2 | 6.3 | 6.2 |
| HSE | 2.5 | 3.6 | 5.5 | 5.4 | |
| Expt. | 3.2 [19] | 3.69 | 6.11 | 7.54 | |
IV.4 Temperature dependent photoluminescence line shapes
In Fig. 7(a) we show PL line shapes as a function of temperature for NV-. We included the temperature effect on the phonon population and the line shape broadening using Eq. 7. We tuned the parameter to obtain the best agreement with experiment; this parameter describes the broadening of the line shape, and is related to the lifetime of the ES and the variation of the local environment of the defect in the experimental samples. The values of obtained in our fit to experimental data are reported in the inset of Fig. 7(a). We approximated with a quadratic function of for NV-, consistent with the findings of Ref. [75] for K. We note that the ZPL width was shown to depend on due to the dynamic Jahn-Teller effect of the ES for K [76, 73]. The temperature dependence was not considered in our work due to the lack of experimental data.

Overall, the calculated temperature-dependent PL line shapes agree well with experiments. As the temperature increases, the ZPL width increases due to the decrease of the lifetime of the ES. The intensity of the PSB in the 30 meV range around the ZPL also increases, indicating an increasing population of the higher vibrational levels of the ES long-range modes. The increasing population causes the broadening and the small shift of the first peak of the PSB (about 63 meV lower than ZPL) towards lower energies, as observed both theoretically and experimentally. As for the PSB with energy higher than the ZPL, we find that a shoulder peak at about 60 meV becomes increasingly more intense as the temperature increases, due to the coupling with the quasi-local mode in the ES. Temperature effects on the electronic structure, atomic structure and lattice parameters were neglected in our calculations. These effects are assumed to be relatively small considering the 3 meV shift of the ZPL from 8 K to 300 K observed in experiments.
The measured and computed temperature-dependent PL line shapes for -VV0 (Fig. 7(b)) are in general good agreement. Also in this case, we observe a broadening of the ZPL and the PSB and the increase of the intensity around the ZPL as the temperature increases. The chosen broadening parameter turns out to be a non-linear function of the temperature. Our temperature dependent results show that converged calculations can successfully discern features in the PSB also as a function of .
IV.5 Displaced harmonic oscillator and the Franck-Condon approximations
We have presented results for PL line shapes obtained using the generating function approach (Eq. 8), which in turn was derived using the FC and the DHO approximations. The former assumes that the transition dipole moment is independent of changes in the atomic structure, and the latter assumes that the vibrational modes of the GS and the ES are identical except for a displacement. We present below an analysis of the validity of these two approximations using a one-dimensional (1D) model, where just one effective phonon mode is considered. Previous studies have shown that the 1D model provides an accurate description of defect systems with strong electron-phonon coupling () and serves as a valuable approximation to cases with weak or intermediate electron-phonon coupling [10, 8]. The systems considered in this work, e.g., NV- and -VV0, yield (intermediate electron-phonon coupling); hence the use of the 1D model appears to be justified, although the Herzberg-Teller (HT) effect of symmetry forbidden vibrational modes and the Duschinsky rotation effect between vibrational modes of the GS and the ES [77] are not captured by the model.
In the 1D model, we considered one effective phonon mode which includes only vibrations projected along the direction of the configuration coordinate , which connects the equilibrium atomic structures of the GS and the ES (see Fig. 1). The frequency of such effective phonon mode is calculated as the weighted average over all phonon frequencies in either the GS or the ES:
| (16) |
At the PBE level of theory we obtain: for NV-, meV, meV, and amu0.5 Å; for -VV0, meV, meV, and amu0.5 Å. With these parameters we can also compute the HRF for the 1D model as . We obtained 3.22 (2.65) for NV- (-VV0), close to the HRF from the all-phonon calculation with the () supercell, which is 2.94 (2.51).
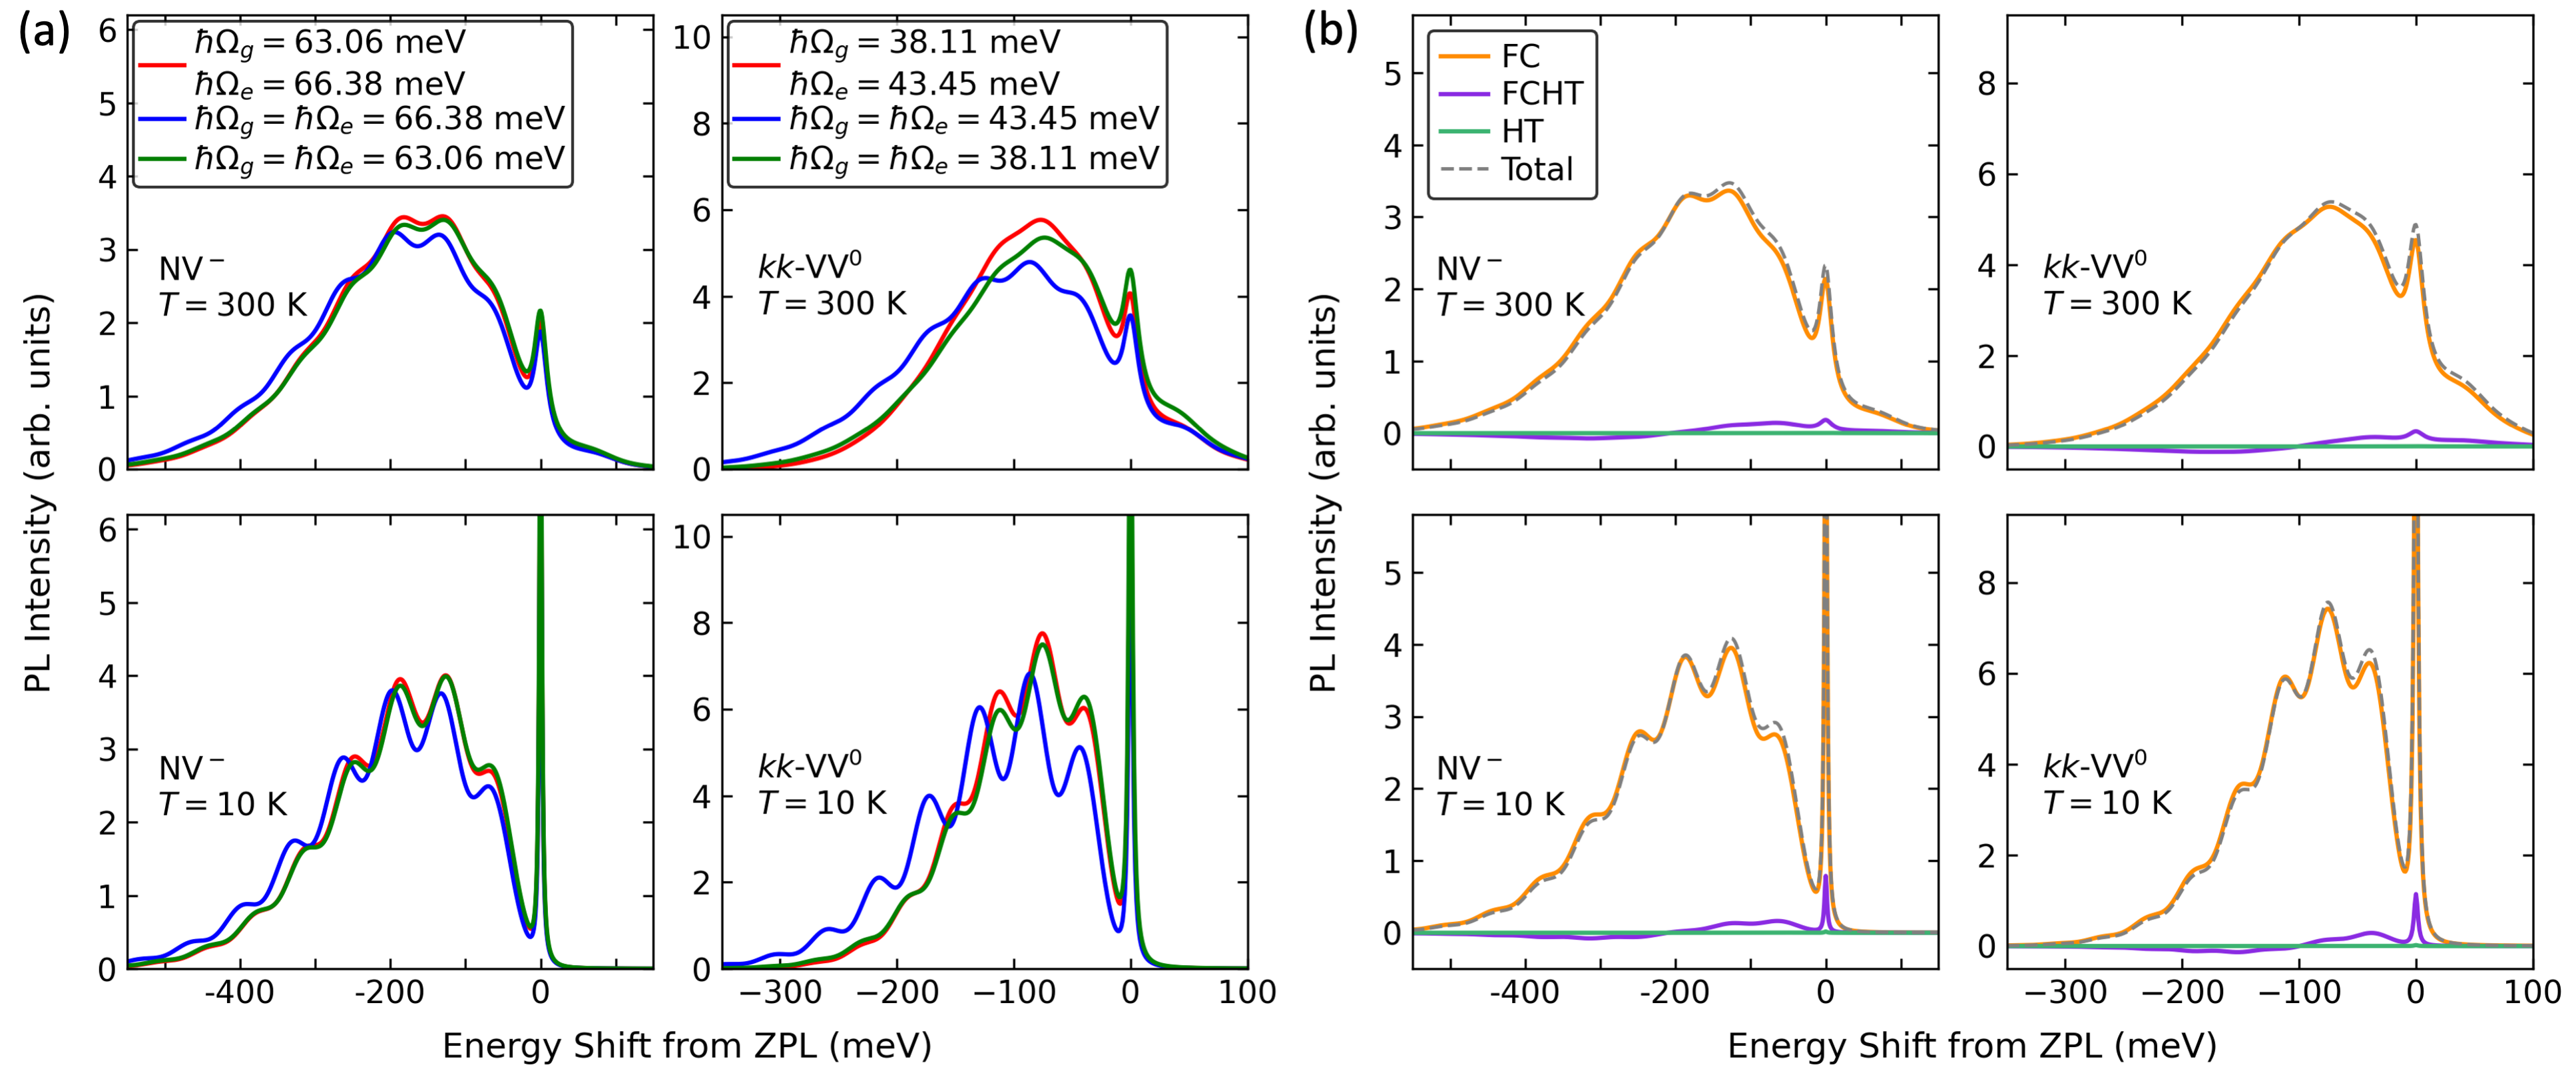
Fig. 8(a) shows the PL spectra of NV- and -VV0 computed using the 1D model with (i) actual different from , (ii) the same as and (iii) the same as . We find that for the NV- center, the approximation (iii) yields 2.3% and 3.1% relative error at K and at K relative to (i). This result agrees with those reported by Razinkovas et al. [28]. In the case of the -VV0 center, the approximation (iii) yields a 6.0% and 9.5% relative error at K and at K, respectively, arising from the greater difference between and . The error caused by using (iii) increases as a function of , since the number of excited vibrational states contributing to the PL spectrum increases. Since excited vibrational states are more likely to be populated in -VV0 than in NV-, due to the smaller effective phonon frequency, the error is larger for the former. The DHO approximation used in the calculations of PL line shapes in Sec. IV.3 corresponds to case (iii). Our analysis with the 1D model suggests that the DHO approximation used in our calculations is fairly accurate. In general, we expect the DHO approximation to be valid for defects in rigid materials with relatively small structural displacements upon optical transitions at low temperature.
In order to use the 1D model to examine the validity of the FC approximation, we first write Eq. 1 without using the FC principle:
| (17) | ||||
Within the 1D effective phonon approximation we have:
| (18) |
Here we use the same notations for nuclear wavefunctions and vibrational states as in Eq. 3. The quantity is the transition dipole moment between electronic wavefunctions obtained at fixed values of the configuration coordinate , where is the electronic wavefunction of the system in the ES (GS). To first order in we can further approximate Eq. 18 as:
| (19) | ||||
We have numerically computed the electronic transition dipole moment as a function of , and verified that the dependence is linear with a relative change of about 10% between the equilibrium atomic structures of GS and ES for both NV- and -VV0 (see Fig. S12 of the SI).
After introducing Eq. LABEL:eq:newThetaTaylorExp in Eq. 17 we recognize the usual FC term, and the terms beyond the FC approximation. The latter can be grouped into two categories: the Franck-Condon Herzberg-Teller (FCHT), and the Herzberg-Teller (HT) term, depending on whether one or two derivatives of the electronic transition dipole moment with respect to are present, respectively (see Eq. S13-S15 of the SI). Fig. 8(b) shows the FC, FCHT, and HT contributions to the PL line shape for both NV- and -VV0, at K and K. We find that the FC term is the dominant one and that the FCHT and HT contributions are smaller than 5% and 0.1% of the total intensity, respectively. These results indicate that the FC approximation used in Sec. IV.3 is accurate. We note that the validity of the FC approximation depends on the symmetry and the strength of electron-phonon coupling of the defect center. For negatively-charged silicon vacancy centers in diamond, the HT term may not be negligible [50, 24]. We suggest that computing the relative error caused by neglecting FCHT and HT contributions using the 1D model is a useful first step in assessing the validity of the FC approximation.
V Conclusions
In summary, we presented a detailed comparison of measured and computed PL spectra of defects in diamond and SiC, aimed at assessing the validity of theoretical and numerical approximations used in first principles calculations. As expected, our results show that the best agreement between theory and experiments is obtained when using hybrid functionals, instead of PBE, although the qualitative differences between the PL line shapes of the different configurations of the VV0 centers are reproduced with PBE as well. We find minor differences between the results obtained with the hybrid functionals HSE and DDH: the values of the ZPL obtained with the two functionals are almost identical (note that our HSE results slightly differ from previous ones reported in the literature for the case of the NV-) and the values of the HRF differ by less than 10%. We also find minor differences between spectral densities computed at the PBE and DDH level of theory, indicating that the major improvement of hybrid functionals over PBE is in the determination of the electronic structure of the system. Our findings show that results for the triplet ES obtained with CDFT and TDDFT are similar at the DDH level of theory for NV- and VV0 centers, suggesting that the relatively cheap CDFT method is accurate for the calculations of their PL spectra. In addition, by using a 1D model, we provided a qualitative assessment of the approximation arising from the use of the FC principle and of the DHO approximation, finding that both of them are justified. Finally, we emphasize the importance of finite size scaling to obtain theoretical results in agreement with experiments for HRFs and PL line shapes, especially for the contribution of quasi-local and long-range acoustic phonon modes. The protocol established in our work shows that accurate results for PL spectra may be obtained at a given temperature using the generating function approach, with phonons extrapolated to the dilute limit, and by using hybrid functionals to compute the GS and ES potential energy surfaces of the defects, with the ES computed with constrained DFT. A 1D model can be used to evaluate the accuracy of the FC and DHO approximations. This protocol, validated here for NV- and VV0 centers, leads to robust predictions of the overall line shape, including PSBs, which can be used to aid the identification and characterization of optically-active defects.
Acknowledgements.
We thank He Ma and Masaya Fukami for helpful discussion, and Bob B. Buckley for assistance with the initial diamond NV- center measurements. Theoretical and computational work (Y.J., M.G., G.G.) and experimental validation at Argonne (S.E.S., F.J.H.) was supported by the Midwest Integrated Center for Computational Materials (MICCoM) as part of the Computational Materials Sciences Program funded by the U.S. Department of Energy. Additional experimental efforts (G.W., D.D.A.) were supported by the U.S. Department of Energy, Office of Science, Basic Energy Sciences, Materials Sciences and Engineering Division. This research used resources of the National Energy Research Scientific Computing Center (NERSC), a DOE Office of Science User Facility supported by the Office of Science of the U.S. Department of Energy under Contract No. DE-AC02-05CH11231, resources of the Argonne Leadership Computing Facility, which is a DOE Office of Science User Facility supported under Contract No. DE-AC02-06CH11357, and resources of the University of Chicago Research Computing Center.References
- Heremans et al. [2016] F. J. Heremans, C. G. Yale, and D. D. Awschalom, Proc. IEEE 104, 2009 (2016).
- Awschalom et al. [2018] D. D. Awschalom, R. Hanson, J. Wrachtrup, and B. B. Zhou, Nat. Photonics 12, 516 (2018).
- Zhang et al. [2020] G. Zhang, Y. Cheng, J.-P. Chou, and A. Gali, Appl. Phys. Rev. 7, 031308 (2020).
- Wolfowicz et al. [2021] G. Wolfowicz, F. J. Heremans, C. P. Anderson, S. Kanai, H. Seo, A. Gali, G. Galli, and D. D. Awschalom, Nat. Rev. Mater. (2021).
- Walker [1979] J. Walker, Rep. Prog. Phys. 42, 1605 (1979).
- Huang et al. [1950] K. Huang, A. Rhys, and N. F. Mott, Proc. R. Soc. Lond. Series A 204, 406 (1950).
- Freysoldt et al. [2014] C. Freysoldt, B. Grabowski, T. Hickel, J. Neugebauer, G. Kresse, A. Janotti, and C. G. Van de Walle, Rev. Mod. Phys. 86, 253 (2014).
- Alkauskas et al. [2016] A. Alkauskas, M. D. McCluskey, and C. G. Van de Walle, J. Appl. Phys. 119, 181101 (2016).
- Dreyer et al. [2018] C. E. Dreyer, A. Alkauskas, J. L. Lyons, A. Janotti, and C. G. Van de Walle, Annu. Rev. Mater. Res. 48, 1 (2018).
- Alkauskas et al. [2012] A. Alkauskas, J. L. Lyons, D. Steiauf, and C. G. Van de Walle, Phys. Rev. Lett. 109, 267401 (2012).
- Reshchikov [2021] M. A. Reshchikov, J. Appl. Phys. 129, 121101 (2021).
- Aleksandrov and Zhuravlev [2020] I. A. Aleksandrov and K. S. Zhuravlev, J. Phys. Condens. Matter 32, 435501 (2020).
- Tawfik et al. [2017] S. A. Tawfik, S. Ali, M. Fronzi, M. Kianinia, T. T. Tran, C. Stampfl, I. Aharonovich, M. Toth, and M. J. Ford, Nanoscale 9, 13575 (2017).
- Hamdi et al. [2020] H. Hamdi, G. Thiering, Z. Bodrog, V. Ivády, and A. Gali, NPJ Comput. Mater. 6, 178 (2020).
- Grosso et al. [2020] G. Grosso, H. Moon, C. J. Ciccarino, J. Flick, N. Mendelson, L. Mennel, M. Toth, I. Aharonovich, P. Narang, and D. R. Englund, ACS Photonics 7, 1410 (2020).
- Camphausen et al. [2020] R. Camphausen, L. Marini, S. A. Tawfik, T. T. Tran, M. J. Ford, and S. Palomba, APL Photonics 5, 076103 (2020).
- Jara et al. [2021] C. Jara, T. Rauch, S. Botti, M. A. L. Marques, A. Norambuena, R. Coto, J. E. Castellanos-Águila, J. R. Maze, and F. Munoz, J. Phys. Chem. A 125, 1325 (2021).
- Linderälv et al. [2021] C. Linderälv, W. Wieczorek, and P. Erhart, Phys. Rev. B 103, 115421 (2021).
- Alkauskas et al. [2014] A. Alkauskas, B. B. Buckley, D. D. Awschalom, and C. G. Van de Walle, New J. Phys. 16, 073026 (2014).
- Thiering and Gali [2015] G. Thiering and A. Gali, Phys. Rev. B 92, 165203 (2015).
- Norambuena et al. [2016] A. Norambuena, S. A. Reyes, J. Mejía-Lopéz, A. Gali, and J. R. Maze, Phys. Rev. B 94, 134305 (2016).
- Thiering and Gali [2017] G. Thiering and A. Gali, Phys. Rev. B 96, 081115 (2017).
- Zhang et al. [2018] J. Zhang, C.-Z. Wang, Z. Zhu, Q. H. Liu, and K.-M. Ho, Phys. Rev. B 97, 165204 (2018).
- Thiering and Gali [2018] G. Thiering and A. Gali, Phys. Rev. X 8, 021063 (2018).
- Harris et al. [2020] I. Harris, C. J. Ciccarino, J. Flick, D. R. Englund, and P. Narang, Phys. Rev. B 102, 195206 (2020).
- Karim et al. [2020] A. Karim, I. Lyskov, S. P. Russo, and A. Peruzzo, J. Appl. Phys. 128, 233102 (2020).
- Zemła et al. [2020] M. R. Zemła, K. Czelej, P. Kamińska, C. G. Van de Walle, and J. A. Majewski, Phys. Rev. B 102, 115102 (2020).
- Razinkovas et al. [2021] L. Razinkovas, M. W. Doherty, N. B. Manson, C. G. Van de Walle, and A. Alkauskas, Phys. Rev. B 104, 045303 (2021).
- Karim et al. [2021] A. Karim, I. Lyskov, S. P. Russo, and A. Peruzzo, Bright ab-initio photoluminescence of NV+ in diamond (2021), arXiv:2104.04256 [cond-mat.mes-hall] .
- Udvarhelyi et al. [2020] P. Udvarhelyi, G. Thiering, N. Morioka, C. Babin, F. Kaiser, D. Lukin, T. Ohshima, J. Ul-Hassan, N. T. Son, J. Vučković, J. Wrachtrup, and A. Gali, Phys. Rev. Applied 13, 054017 (2020).
- Shang et al. [2020] Z. Shang, A. Hashemi, Y. Berencén, H.-P. Komsa, P. Erhart, S. Zhou, M. Helm, A. V. Krasheninnikov, and G. V. Astakhov, Phys. Rev. B 101, 144109 (2020).
- Hassanzada et al. [2020] Q. Hassanzada, I. A. Sarsari, A. Hashemi, A. Ghojavand, A. Gali, and M. Abdi, Phys. Rev. B 102, 134103 (2020).
- Hashemi et al. [2021] A. Hashemi, C. Linderälv, A. V. Krasheninnikov, T. Ala-Nissila, P. Erhart, and H.-P. Komsa, Phys. Rev. B 103, 125203 (2021).
- Chakraborty et al. [2020] C. Chakraborty, C. J. Ciccarino, and P. Narang, Dynamic modulation of phonon-assisted transitions in quantum defects in monolayer transition-metal dichalcogenide semiconductors (2020), arXiv:2007.14399 [cond-mat.mtrl-sci] .
- Kehayias et al. [2013] P. Kehayias, M. W. Doherty, D. English, R. Fischer, A. Jarmola, K. Jensen, N. Leefer, P. Hemmer, N. B. Manson, and D. Budker, Phys. Rev. B 88, 165202 (2013).
- Schirhagl et al. [2014] R. Schirhagl, K. Chang, M. Loretz, and C. L. Degen, Annu. Rev. Phys. Chem. 65, 83 (2014).
- Doherty et al. [2013] M. W. Doherty, N. B. Manson, P. Delaney, F. Jelezko, J. Wrachtrup, and L. C. Hollenberg, Phys. Rep. 528, 1 (2013).
- Gali [2019] A. Gali, Nanophotonics 8, 1907 (2019).
- Su et al. [2019] Z. Su, Z. Ren, Y. Bao, X. Lao, J. Zhang, J. Zhang, D. Zhu, Y. Lu, Y. Hao, and S. Xu, J. Mater. Chem. C 7, 8086 (2019).
- Wolfowicz et al. [2017] G. Wolfowicz, C. P. Anderson, A. L. Yeats, S. J. Whiteley, J. Niklas, O. G. Poluektov, F. J. Heremans, and D. D. Awschalom, Nat. Commun. 8, 1 (2017).
- Christle et al. [2017] D. J. Christle, P. V. Klimov, C. F. de las Casas, K. Szász, V. Ivády, V. Jokubavicius, J. Ul Hassan, M. Syväjärvi, W. F. Koehl, T. Ohshima, N. T. Son, E. Janzén, A. Gali, and D. D. Awschalom, Phys. Rev. X 7, 021046 (2017).
- Davidsson et al. [2018] J. Davidsson, V. Ivády, R. Armiento, N. T. Son, A. Gali, and I. A. Abrikosov, New J. Phys. 20, 023035 (2018).
- Son et al. [2020] N. T. Son, C. P. Anderson, A. Bourassa, K. C. Miao, C. Babin, M. Widmann, M. Niethammer, J. Ul Hassan, N. Morioka, I. G. Ivanov, F. Kaiser, J. Wrachtrup, and D. D. Awschalom, Appl. Phys. Lett. 116, 190501 (2020).
- Gali et al. [2009] A. Gali, E. Janzén, P. Deák, G. Kresse, and E. Kaxiras, Phys. Rev. Lett. 103, 186404 (2009).
- Sun et al. [2020] J. Sun, J. Yang, and C. A. Ullrich, Phys. Rev. Research 2, 013091 (2020).
- Dong et al. [2021] S. S. Dong, M. Govoni, and G. Galli, Chem. Sci. 12, 4970 (2021).
- Gali [2011] A. Gali, Phys. Status Solidi B 248, 1337 (2011).
- Petrone et al. [2016] A. Petrone, J. J. Goings, and X. Li, Phys. Rev. B 94, 165402 (2016).
- Petrone et al. [2018] A. Petrone, R. A. Beck, J. M. Kasper, X. Li, Y. Huang, M. Crane, and P. Pauzauskie, Phys. Rev. B 98, 205405 (2018).
- Londero et al. [2018] E. Londero, G. Thiering, L. Razinkovas, A. Gali, and A. Alkauskas, Phys. Rev. B 98, 035306 (2018).
- Råde and Westergren [1995] L. Råde and B. Westergren, Mathematics handbook for science and engineering, Vol. 4 (Springer, 1995).
- Lax [1952] M. Lax, J. Chem. Phys. 20, 1752 (1952).
- Kubo and Toyozawa [1955] R. Kubo and Y. Toyozawa, Prog. Theor. Phys. 13, 160 (1955).
- Giannozzi et al. [2009] P. Giannozzi, S. Baroni, N. Bonini, M. Calandra, R. Car, C. Cavazzoni, D. Ceresoli, G. L. Chiarotti, M. Cococcioni, I. Dabo, A. Dal Corso, S. de Gironcoli, S. Fabris, G. Fratesi, R. Gebauer, U. Gerstmann, C. Gougoussis, A. Kokalj, M. Lazzeri, L. Martin-Samos, N. Marzari, F. Mauri, R. Mazzarello, S. Paolini, A. Pasquarello, L. Paulatto, C. Sbraccia, S. Scandolo, G. Sclauzero, A. P. Seitsonen, A. Smogunov, P. Umari, and R. M. Wentzcovitch, J. Phys.: Condens. Matter 21, 395502 (2009).
- Giannozzi et al. [2017] P. Giannozzi, O. Andreussi, T. Brumme, O. Bunau, M. B. Nardelli, M. Calandra, R. Car, C. Cavazzoni, D. Ceresoli, M. Cococcioni, N. Colonna, I. Carnimeo, A. D. Corso, S. de Gironcoli, P. Delugas, R. A. D. Jr, A. Ferretti, A. Floris, G. Fratesi, G. Fugallo, R. Gebauer, U. Gerstmann, F. Giustino, T. Gorni, J. Jia, M. Kawamura, H.-Y. Ko, A. Kokalj, E. Küçükbenli, M. Lazzeri, M. Marsili, N. Marzari, F. Mauri, N. L. Nguyen, H.-V. Nguyen, A. O. de-la Roza, L. Paulatto, S. Poncé, D. Rocca, R. Sabatini, B. Santra, M. Schlipf, A. P. Seitsonen, A. Smogunov, I. Timrov, T. Thonhauser, P. Umari, N. Vast, X. Wu, and S. Baroni, J. Phys.: Condens. Matter 29, 465901 (2017).
- Giannozzi et al. [2020] P. Giannozzi, O. Baseggio, P. Bonfà, D. Brunato, R. Car, I. Carnimeo, C. Cavazzoni, S. de Gironcoli, P. Delugas, F. Ferrari Ruffino, A. Ferretti, N. Marzari, I. Timrov, A. Urru, and S. Baroni, J. Chem. Phys. 152, 154105 (2020).
- Hamann [2013] D. R. Hamann, Phys. Rev. B 88, 085117 (2013).
- Schlipf and Gygi [2015] M. Schlipf and F. Gygi, Comput. Phys. Commun. 196, 36 (2015).
- Perdew et al. [1996] J. P. Perdew, K. Burke, and M. Ernzerhof, Phys. Rev. Lett. 77, 3865 (1996).
- Skone et al. [2014] J. H. Skone, M. Govoni, and G. Galli, Phys. Rev. B 89, 195112 (2014).
- Heyd et al. [2003] J. Heyd, G. E. Scuseria, and M. Ernzerhof, J. Chem. Phys. 118, 8207 (2003).
- Heyd et al. [2006] J. Heyd, G. E. Scuseria, and M. Ernzerhof, J. Chem. Phys. 124, 219906 (2006).
- Seo et al. [2017] H. Seo, H. Ma, M. Govoni, and G. Galli, Phys. Rev. Materials 1, 075002 (2017).
- SI [2021] See supplemental material at [url will be inserted by publisher] for (i) properties of bulk diamond and 4H-SiC; (ii) details of CDFT calculations; (iii) atomic displacements upon optical excitation; (iv) phonons at the level of hybrid functionals; (v) details of extrapolating to the dilute limit; (vi) detailed analysis of spectral densities and vibrational modes analysis; (vii) calculations of transition dipole moment and radiative lifetime. (2021).
- Gordon et al. [2015] L. Gordon, A. Janotti, and C. G. Van de Walle, Phys. Rev. B 92, 045208 (2015).
- Govoni and Galli [2015] M. Govoni and G. Galli, J. Chem. Theory Comput. 11, 2680 (2015).
- Nguyen et al. [2019] N. L. Nguyen, H. Ma, M. Govoni, F. Gygi, and G. Galli, Phys. Rev. Lett. 122, 237402 (2019).
- Togo and Tanaka [2015] A. Togo and I. Tanaka, Scr. Mater. 108, 1 (2015).
- Mackoit-Sinkevičienė et al. [2019] M. Mackoit-Sinkevičienė, M. Maciaszek, C. G. Van de Walle, and A. Alkauskas, Appl. Phys. Lett. 115, 212101 (2019).
- Ma et al. [2020a] H. Ma, M. Govoni, and G. Galli, npj. Comput. Mater. 6, 85 (2020a).
- Ma et al. [2020b] H. Ma, N. Sheng, M. Govoni, and G. Galli, Phys. Chem. Chem. Phys. 22, 25522 (2020b).
- Ma et al. [2021] H. Ma, N. Sheng, M. Govoni, and G. Galli, J. Chem. Theory Comput. 17, 2116 (2021), pMID: 33739106.
- Abtew et al. [2011] T. A. Abtew, Y. Y. Sun, B.-C. Shih, P. Dev, S. B. Zhang, and P. Zhang, Phys. Rev. Lett. 107, 146403 (2011).
- Shang et al. [2021] Z. Shang, Y. Berencén, M. Hollenbach, S. Zhou, H. Kraus, T. Ohshima, and G. Astakhov, Phys. Rev. Applied 15, 034059 (2021).
- Fukami et al. [2019] M. Fukami, C. Yale, P. Andrich, X. Liu, F. Heremans, P. Nealey, and D. Awschalom, Phys. Rev. Applied 12, 014042 (2019).
- Fu et al. [2009] K.-M. C. Fu, C. Santori, P. E. Barclay, L. J. Rogers, N. B. Manson, and R. G. Beausoleil, Phys. Rev. Lett. 103, 256404 (2009).
- Duschinsky [1937] F. Duschinsky, Acta Physicochim. (URSS) 7, 551 (1937).