Evidence of 100 TeV -ray emission from HESS J1702-420: A new PeVatron candidate
Abstract
Aims. The identification of PeVatrons, hadronic particle accelerators reaching the knee of the cosmic ray spectrum (), is crucial to understand the origin of cosmic rays in the Galaxy. We provide an update on the unidentified source HESS J1702-420, a promising PeVatron candidate.
Methods. We present new observations of HESS J1702-420 made with the High Energy Stereoscopic System (H.E.S.S.), and processed using improved analysis techniques. The analysis configuration was optimized to enhance the collection area at the highest energies. We applied a three-dimensional (3D) likelihood analysis to model the source region and adjust non thermal radiative spectral models to the -ray data. We also analyzed archival Fermi Large Area Telescope (LAT) data to constrain the source spectrum at -ray energies .
Results. We report the detection of -rays up to from a specific region of HESS J1702-420, which is well described by a new source component called HESS J1702-420A that was separated from the bulk of TeV emission at a confidence level. The power law -ray spectrum of HESS J1702-420A extends with an index of and without curvature up to the energy band , in which it was detected by H.E.S.S. at a confidence level. This makes HESS J1702-420A a compelling candidate site for the presence of extremely high energy cosmic rays. With a flux above of and a radius of , HESS J1702-420A is outshone — below a few tens of TeV — by the companion HESS J1702-420B. The latter has a steep spectral index of and an elongated shape, and it accounts for most of the low-energy HESS J1702-420 flux. Simple hadronic and leptonic emission models can be well adjusted to the spectra of both components. Remarkably, in a hadronic scenario, the cut-off energy of the particle distribution powering HESS J1702-420A is found to be higher than at a confidence level.
Conclusions. For the first time, H.E.S.S. resolved two components with significantly different morphologies and spectral indices, both detected at confidence level, whose combined emissions result in the source HESS J1702-420. We detected HESS J1702-420A at a confidence level in the energy band , which brings evidence for the source emission up to . In a hadronic emission scenario, the hard -ray spectrum of HESS J1702-420A implies that the source likely harbors PeV protons, thus becoming one of the most solid PeVatron candidates detected so far in H.E.S.S. data. However, a leptonic origin of the observed TeV emission cannot be ruled out either.
;
* Corresponding authors
1 Introduction
The acceleration sites of cosmic rays111Throughout this paper, unless otherwise specified, this term always refers to hadronic cosmic rays. are a century-old unknown in modern astrophysics (Hess 1912). The current understanding is that the bulk of cosmic rays reaching Earth — mostly energetic protons — originate within our Galaxy, outside of the solar system, at unknown sites where they are accelerated up to the energy of the knee feature in the cosmic ray spectrum (Berezinskii et al. 1990; Gaisser et al. 2016). Since the measured knee energy is around PeV (Apel et al. 2013), the Galactic accelerators responsible for cosmic rays up to the knee are called PeVatrons. Several source populations have been proposed as potential PeVatron candidates: among them, supernova remnants (SNRs) and young massive stellar clusters stand out as well motivated cases (Bell 2014; Aharonian et al. 2019). However, to date no observation has definitively linked any particular source class to the acceleration of PeV protons. The H.E.S.S. Collaboration has already reported evidence for the acceleration of PeV protons in the central molecular zone around Sgr A∗ (H.E.S.S. Collaboration et al. 2016; H. E. S. S. Collaboration et al. 2018), at a level that is presently insufficient to sustain the flux of PeV cosmic rays observed at Earth. Recent searches for a high-energy cut-off in the spectrum of the diffuse emission around Sgr A∗ have led to unclear conclusions, with MAGIC reporting a hint for a spectral turnover around and VERITAS measuring a straight power law up to (MAGIC Collaboration et al. 2020; Adams et al. 2021).
Observations of the very high energy (VHE; TeV) -ray sky with ground-based telescope arrays such as the High Energy Stereoscopic System (H.E.S.S.), providing relatively good angular and energy resolution as well as high sensitivity (H.E.S.S. Collaboration et al. 2018), represent a unique tool to improve our understanding of cosmic ray physics. Charged cosmic particles radiate in this energy band due to interactions with the interstellar medium (ISM) or to the up-scattering of diffuse low-energy radiation fields. The H.E.S.S. Galactic Plane Survey (HGPS) catalog (H.E.S.S. Collaboration et al. 2018) lists 78 VHE -ray sources, most of which have been identified as of today — or at least likely associated — with multi wavelength counterparts. However, a handful of sources remain completely unidentified. Having no clear counterpart at other wavelength, they are categorized as dark TeV sources (Aharonian et al. 2008). Experience has shown that several such objects, despite being unidentified at first, were later classified as evolved pulsar wind nebulae (PWNe), based on the discovery of energy-dependent morphologies and compact X-ray counterparts (H.E.S.S. Collaboration et al. 2012, 2019). However, a leptonic scenario, in which the VHE -ray emission is powered by relativistic electrons up-scattering ambient radiation fields, might not necessarily suit all of the remaining dark sources.
HESS J1702-420 is a long-known but poorly understood VHE -ray source. It was discovered during the first Galactic plane survey campaign with a significance of , based on a observation livetime (Aharonian et al. 2006). In Aharonian et al. (2008), a dedicated analysis revealed a hard power law222Hearafter, the term power law refers to the functional form , where is the spectral normalization at the reference energy — usually chosen to correspond with the pivot energy which minimizes correlations between the spectral parameters —, and is the spectral index. spectral index of , with no sign of cut-off, and a significantly extended morphology which is well described by a elliptical Gaussian template. With better reconstruction and data selection algorithms, the HGPS catalog confirmed the spectral hardness of the source, , and estimated a source significance of based on of observations. It simplified however the source morphology to a symmetric Gaussian, due to the noninclusion of elongated shapes in the semi-automated survey analysis chain.
The physical origin of the -ray emission from HESS J1702-420 is unknown. The remnant SNR G344.7-0.1 and the pulsar PSR J1702-4128 are within a aperture from the centroid of the TeV emission. The former is a old (Giacani et al. 2011) and small-sized — in diameter — SNR, whose centrally-peaked radio shell (Dubner et al. 1993; Whiteoak & Green 1996; Giacani et al. 2011) is also emitting thermal X-rays (Yamaguchi et al. 2012; Combi et al. 2010), with the brightest X-ray and radio features close to each other (Giacani et al. 2011). Recently, the Fermi-LAT association 2FHL J1703.4-4145, with the hard spectral index , was discovered on the western edge of the SNR (Eagle et al. 2020). The core-collapse origin of the supernova is debated, due to the absence of a compact remnant. Also controversial is the SNR distance (Eagle et al. 2020), for which a limit based on the high absorbing hydrogen column density is (Yamaguchi et al. 2012). The cosmic ray diffusion time from the SNR to the VHE peak is compatible with the remnant age (Eagle et al. 2020), which suggests that both 2FHL J1703.4-4145 and HESS J1702-420 may be associated with SNR G344.7-0.1. However, the detection of an extended and bright TeV source at in the Galactic plane is unlikely given H.E.S.S. sensitivity (H.E.S.S. Collaboration et al. 2018). Moreover, the surrounding ISM does not exhibit any clear morphological association with the VHE -ray source (Lau et al. 2018), a fact that challenges a hadronic interpretation of the TeV emission. With a spin-down luminosity , the large-offset pulsar PSR J1702-4128 would need a conversion efficiency in order to power the whole TeV source, higher than all other PWNe identified by H.E.S.S. (Gallant 2007; H.E.S.S. Collaboration et al. 2018). This fact, together with the unconclusive searches for an asymmetric X-ray PWN around the pulsar (Chang et al. 2008), tend to disfavor an association of PSR J1702-4128 with HESS J1702-420. Finally, deep X-ray observations of the VHE source with Suzaku revealed the presence of two faint point-like sources close to the line of sight of HESS J1702-420, and the absence of extended emission, with an X-ray flux at least 12 times lower than the TeV flux in the Suzaku field of view (FoV) (Fujinaga et al. 2011).
This paper reports on new H.E.S.S. observations of HESS J1702-420 that have been processed with improved techniques. Additionally, archival Fermi-LAT data were analyzed, to perform a broadband modeling of the TeV source. The paper is structured as follows: first, the H.E.S.S. data analysis and results are presented (Section 2), with focus on the three-dimensional (3D) likelihood anaysis (Section 2.1) and a morphological study made with a more classical background estimation technique (Section 2.2). Then, Section 3 reports on the analysis of archival multi wavelength observations of the region, while Section 4 describes the adjustment of physically-motivated non thermal radiative models to the data and discusses possible interpretations of the new H.E.S.S. results in a broadband context. Finally, Section 5 summarizes the main conclusions of the paper.
2 H.E.S.S. data analysis and results
H.E.S.S. is an array of five imaging atmospheric Cherenkov telescopes (IACTs) located in the Khomas Highland of Namibia, 1800 m above sea level. The design of the original array (H.E.S.S. I), operating since 2003, involved four diameter telescopes — CT1-4, whose cameras were upgraded in 2017 (Ashton et al. 2020) — at the corners of a square. In 2012, a second phase began (H.E.S.S. II) with the addition of a diameter telescope (CT5) at the center of the array.
All results presented in this paper make use of data collected from 2004 to 2019, using CT1-4 observations that have been carried out in multiple contexts: dedicated pointings on HESS J1702-420, observations of other nearby objects — mainly RX J1713-3946 and PSR B1706-44 — and Galactic plane scan observations for the HGPS campaign. This led to the accumulation of an acceptance-corrected livetime of , obtained after selecting all runs with pointing direction within from the HGPS position of HESS J1702-420 (=, =) and averaging over a circle centered at the same location.
Observations were processed with the H.E.S.S. analysis package (HAP), applying a Hillas-type shower reconstruction (Hillas 1985) and the multi-variate analysis (MVA) technique (Becherini et al. 2012) for efficient hadron discrimination. Preselection and MVA discrimination cuts were optimized to improve the collection area at high energies (), assuming a -ray spectral index of . The reduced data and instrument response functions333They are the effective area, exposure livetime, point-spread function, energy dispersion and background model. (IRFs) were exported to FITS files complying with the standard format developed by Deil et al. (2017a). Finally, all high-level analysis results — that is sky maps and spectra — were obtained using gammapy (version 0.17), an open source python library for -ray astronomy (Deil et al. 2017b; Nigro et al. 2019; Deil et al. 2020). The analysis cross-check was also performed with gammapy, by applying the same high-level analysis pipeline to data that were reduced according to an alternative low-level chain of calibration, reconstruction and -hadron separation methods (Ohm et al. 2009). Independent crosschecks for the classical morphological and spectral analyses presented in Section 2.2 and Appendix A were also carried out using the standard HAP software.
2.1 Three-dimensional likelihood analysis
Three-dimensional likelihood analysis, routinely used for high energy (HE; GeV) -ray data processing (Mattox et al. 1996; Abdo et al. 2009), has been recently introduced in the VHE -ray astronomy domain (Mohrmann et al. 2019; Donath et al. 2015; Vovk et al. 2018). In its binned version, this technique allows the adjustment of a spectro-morphological model to a data cube, which carries information on the number of reconstructed events within 3D bins. The term 3D refers to the fact that the data are distributed along 2 spatial dimensions (e.g., Galactic longitude and latitude) plus 1 energy dimension. The model can be seen as a collection of spectral and spatial parametric shapes that are assumed to describe all -ray sources in the (source model), plus the residual hadronic background of -like events (background model). The model is convolved with the IRFs to predict the number of photons that would be detected by the telescope array within each spatial and spectral bin, based on the assumed model and its given parameter values. The 3D analysis allows the fine-tuning of all free parameters of the model, in such a way that the cube of model-predicted counts mimics as closely as possible the measured data cube. This approach is known as “forward-folding” (Piron et al. 2001).
We performed a 3D binned likelihood analysis of the region surrounding HESS J1702-420, in order to determine the best spectro-morphological model to describe the observed TeV emission. The next sections discuss the analysis setup (Section 2.1.1) and results (Section 2.1.2), while Section 2.1.3 focuses on the most relevant components of the model, that is those describing HESS J1702-420.
2.1.1 Background model and analysis setup
| Number of runs | Zenith [deg] | Pointing offset from the source [deg] | On-source livetime [hr] ∗ | Observation period |
|---|---|---|---|---|
| 26 | 17.8 - 35.1 | 0.2 - 1.4 | 9.7 | 2004 - 2011 |
| 166 | 16.3 - 35.9 | 1.6 - 2.8 | 1.8 | 2004 - 2014 |
| 88 | 36.1 - 62.4 | 2.2 - 2.8 | 0.0 | 2004 - 2014 |
| 80 | 37.5 - 59.1 | 0.3 - 0.8 | 33.4 | 2017 - 2019 |
| ∗ Obtained by averaging over a -radius circle centered at the center of the HGPS position of HESS J1702-420. We observe that runs belonging to | ||||
| the second and third groups were included to better contrain the background level in the source region. The fourth group contains all (and only) runs | ||||
| taken after the 2017 camera upgrade (Ashton et al. 2020). | ||||
H.E.S.S. data-taking consists of consecutive observations (also called runs), usually of 28 minutes duration. The background model was produced from a large set of empty-field — that is devoid of known -ray sources — observations, following an approach similar to the one described in Mohrmann et al. (2019). We first produced a general model in the form of a lookup table, describing the residual hadronic background as a function of few observational parameters — namely, the zenith angle and optical efficiency. We then assigned each observation a specific background model, called its FoV background model, based on a multi-variable interpolation of the general model. In addition, the FoV background model was renormalized run-by-run, to account for possible differences in the level of night sky background (NSB) and atmospheric absorption with respect to the observations that were used to build the general background model.
As a result of the region’s observation history (see the introduction of Section 2), standard run selection criteria led to a heterogeneous set of observations in terms of array response, zenith angles and source offsets from the pointing direction. We therefore separated observations obtained before and after the 2017 camera upgrade, for which different IRFs have to be used, and grouped together observations with similar zenith and offset values. More details on the four groups of observations that were defined are reported in Table 1. We stacked observations within each group, thus obtaining four independent datasets. This choice represents a good compromise between the time-saving, due to a decrease in the number of degrees of freedom, and information loss, due to the IRFs averaging, that are connected with the data stacking procedure.
For each of the four observation groups, the list of reconstructed events was reduced to a binned data cube, with spatial dimensions corresponding to an analysis region of interest (RoI) of centered at the HGPS position of HESS J1702-420. This choice represents a compromise between a sufficiently large RoI, to get enough off-source regions for the background estimation, and a sufficiently small RoI, to minimize the number of unrelated sources needing to be modeled. A spatial pixel size of was adopted, to ensure sufficient per-pixel statistics while still providing good spatial resolution. The third axis of the cube, encoding the reconstructed energy of incident photons, was divided into 20 equally-spaced — in logarithmic scale — bins between 0.5 and . In order to reject poorly reconstructed data, for each observation all events with offset from the pointing direction were excluded, together with those whose reconstructed energy was below the safe threshold
| (1) |
where represents the energy at which the maximum rate of hadronic background events occurs and is the energy at which the effective area at the center of the FoV drops to 10% of its maximal value (e.g., Mohrmann et al. (2019)).
With this setup, we performed a joint-likelihood analysis of the four independent datasets, each one having its own FoV background model but all sharing the same source model. This means that we summed the four dataset-specific log-likelihood values, and maximized the total resulting likelihood with respect to the model parameters. For the fit, the Cash statistic (Cash 1979) for Poisson-distributed data with perfectly known background model was used. The 3D analysis was performed in the energy range . All events with reconstructed energy below were excluded from the likelihood computation, to avoid threshold effects arising from the high energy optimization (above ) of the analysis configuration and to ensure that the power law assumption made for the background model spectrum was valid — which is true only well above the background peak. A band around the borders of the RoI was excluded from the analysis, in order to limit possible contamination due to non-modeled sources outside the RoI. Additionally, a -radius circular region centered at = and =, containing a significance hotspot, was excluded from the likelihood calculation instead of being modeled. This choice was motivated by the high offset between the hotspot and HESS J1702-420, and the necessity of limiting the number of nuisance parameters of the source model.
2.1.2 Source model derivation and results
The optimal source model for the RoI was determined using a statistical approach based on the improvement of a first-guess model with the iterative addition of new components. As a starting point, we defined a source model including all known VHE sources within the RoI, with the exception of HESS J1702-420. Each iteration then consisted either in the addition of a new source component — described by a symmetric Gaussian morphology and power law spectrum —, or the test of a different assumption on the spatial or spectral shape of an already existing component. Specifically, we looked for the presence of high energy spectral cut-offs or elongated shapes for all components.
Step-by-step, the improvement of the source model was assessed looking at two indicators. Firstly, we used the likelihood-ratio test, which allows to estimate the relative significance of nested hypotheses taking into account the number of additional degrees of freedom added at each step. For example, the presence of an additional model component with 1 (5) free parameter(s) was considered significant at confidence level only if (), where TS is the test statistic
| (2) |
Here, () represents the maximum likelihood of the model under the null (alternative) hypothesis — that is the absence (presence) of . More details can be found in Appendix B. Secondly, we assessed — by visual inspection — the flattening of spatial and spectral residuals toward zero, as a result of the addition of new model components.
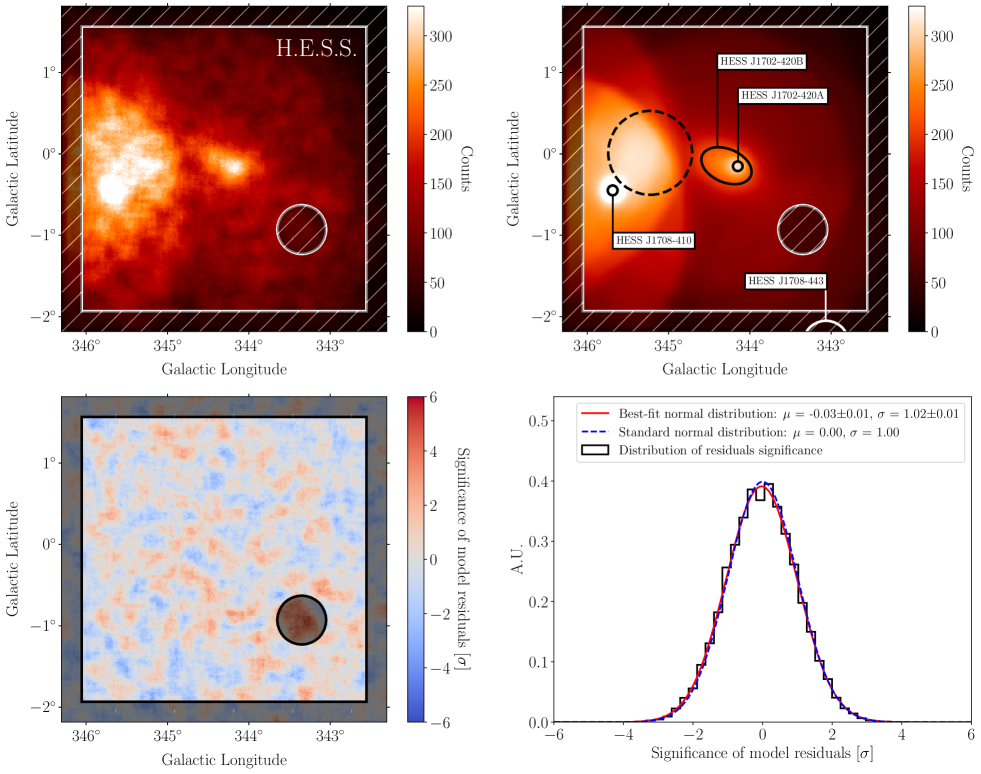
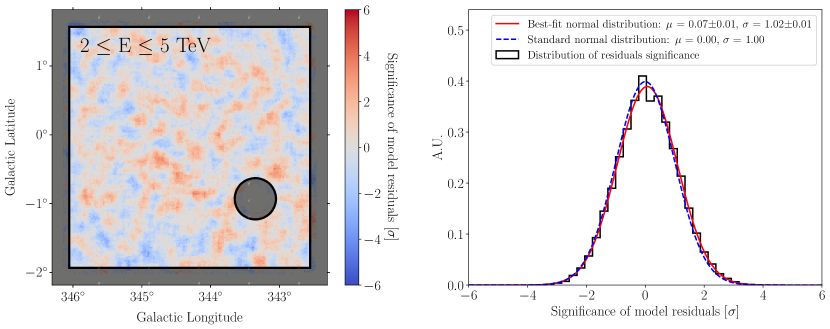
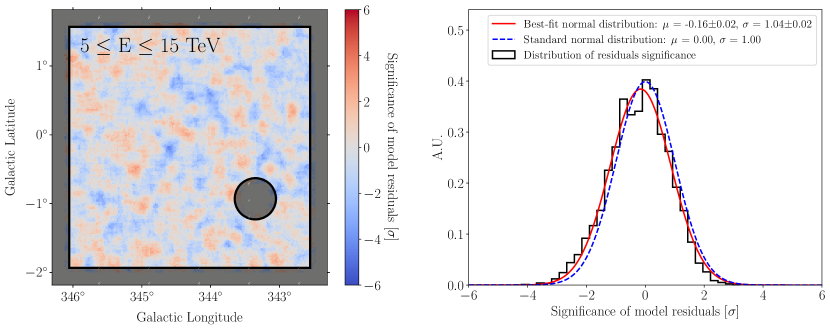
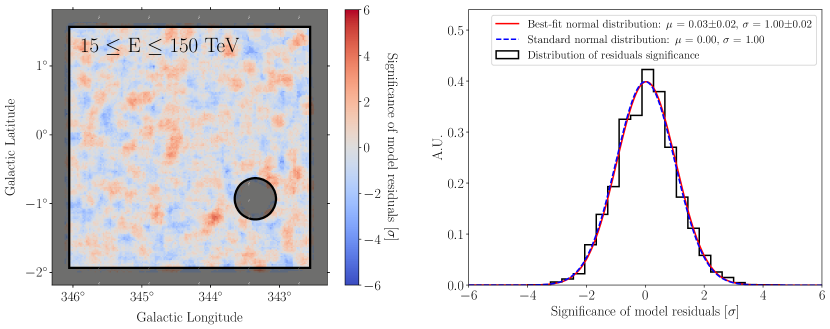
The final results of the procedure are shown in Figure 1. The upper left (right) panel of the figure shows the measured (model-predicted) counts map, obtained after stacking the four individual datasets and integrating over the energy axis above . Diagonal line hatches represent portions of the RoI that were excluded from the likelihood computation (Section 2.1.1). The measured counts map is well matched by the prediction, since the spatial distribution of the significance of model residuals (lower left panel) does not contain significant structures. The histogram of significance values (lower right panel) closely matches a standard normal distribution, as expected if residuals are only due to statistical Poisson fluctuations. Additionally, the spatial distribution of model residuals in three independent energy bands is shown in Figure 9.
The upper right panel of Figure 1 also shows the contours of all components found in the final source model. There are two overlapping objects, called HESS J1702-420A and HESS J1702-420B, that together describe the emission from HESS J1702-420. Being the most relevant model components for the scope of this paper, their details are discussed in the dedicated Section 2.1.3. Two other model components represent the nearby sources HESS J1708-410 and HESS J1708-443. Due to their large angular distance from the center of the RoI, the details of their modeling do not have a strong impact on HESS J1702-420. The fitted model for HESS J1708-410 was found to be consistent with that reported in the HGPS catalog, while the model for HESS J1708-443, being only partially contained in the RoI, was directly fixed to the catalog one. Finally, we found a large-scale component, indicated by the dashed circle in Figure 1 (upper right panel), whose presence was not confirmed by the crosscheck analysis. More details can be found in Appendix C. During the analysis, all parameters describing HESS J1702-420A and HESS J1702-420B, together with the nuisance parameters of all other components and the background model, were left free to vary. Details on the final parameters for the most relevant model components are provided in Tables 2, 3 and 4.
2.1.3 HESS J1702-420A and HESS J1702-420B
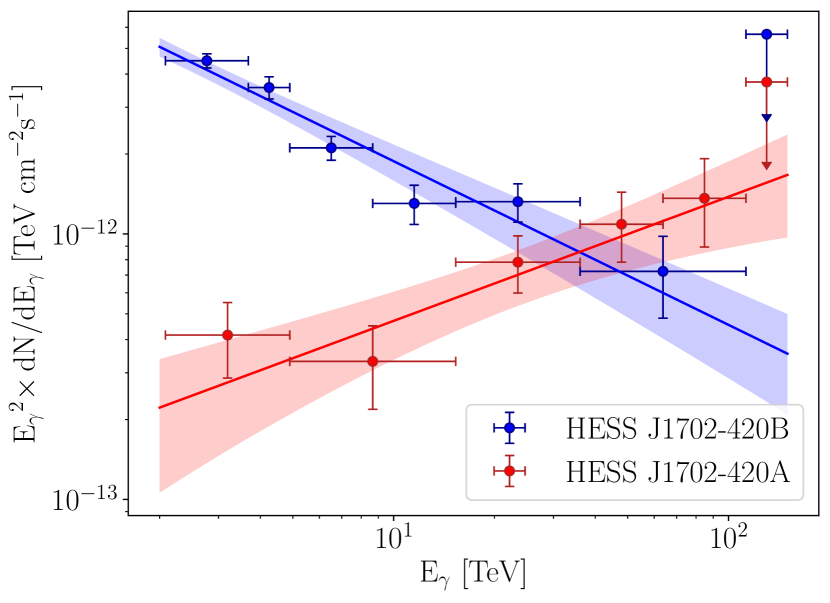
The most relevant result for the identification of Galactic Pevatrons is the discovery — with a TS-based confidence level corresponding to — of a new source component, HESS J1702-420A, hidden under the bulk emission formerly associated with HESS J1702-420. This object has a spectral index of and a -ray spectrum that, extending with no sign of curvature up to at least (possibly ), makes it a compelling candidate site for the presence of extremely high energy cosmic rays. With a flux above of and a radius of , HESS J1702-420A is outshone below by the companion HESS J1702-420B. The test of a point-source hypothesis for HESS J1702-420A resulted in a non-convergence of the fit. HESS J1702-420B has a steep spectral index of , elongated shape and a flux above of that accounts for most of the low-energy HESS J1702-420 emission. By comparing results obtained with the main and crosscheck analysis configurations, we verified that all discrepancies were consistent with the expected level of H.E.S.S. systematic uncertainties (H.E.S.S. Collaboration et al. 2018).
For neither of the two sources did an exponential cut-off function statistically improve the fit with respect to a simple power law (cut-off significance ). The -ray spectra of both components are shown in Figure 2, together with spectral points computed under a power law assumption and re-optimizing all the nuisance parameters of the model — see Table 9 for details. We adapted the binning of the spectral energy distributions to obtain approximately equal counts in each bin. HESS J1702-420B is the brightest component up until roughly , where HESS J1702-420A eventually starts dominating with its power law spectrum up to . The second to last spectral point of HESS J1702-420A (HESS J1702-420B), covering the reconstructed energy range (), is significant at () confidence level.
We explicitly point out that, based on this dataset, it is impossible to tell whether HESS J1702-420A and HESS J1702-420B actually represent two separate sources — superimposed on the same line of sight — or rather different emission zones of a single complex object. Moreover, any morphology assumption based on exact geometric shapes — in this case, two overlapping Gaussian components — represents an idealization, that might differ from the real underlying astrophysical model. In particular, a model assumption based on the energy-dependent morphology of a single source might also be well suited to describe the emission of HESS J1702-420. To address this point, we performed dedicated studies that ultimately provided a confirmation of the 3D analysis results, in that they brought no evidence of energy-dependent variations of the 3D model or spectral softening as a function of the distance from HESS J1702-420A (see Appendix D and A). Therefore, a model describing HESS J1702-420 with a single energy-dependent component is disfavored, even if it cannot be definitively ruled out.
| Component name | Galactic longitude | Galactic latitude | Major semi-axis | Minor semi-axis | Rotation angle ∗ |
| [deg] | [deg] | [deg] | [deg] | [deg] | |
| HESS J1702-420A | — | ||||
| HESS J1702-420B | |||||
| ∗ Measured counterclockwise starting from the , axis. | |||||
| Component name | Spectral index | Decorrelation energy | ||
|---|---|---|---|---|
| [TeV] | ||||
| HESS J1702-420A | ||||
| HESS J1702-420B |
| Component name | Surface brightness above | Test statistic (TS) | Number of d.o.f. | Significance |
|---|---|---|---|---|
| HESS J1702-420A | 42 | 5 | 5.4 | |
| HESS J1702-420B | 606 | 7 | 23.9 |
2.2 Flux maps and source morphology
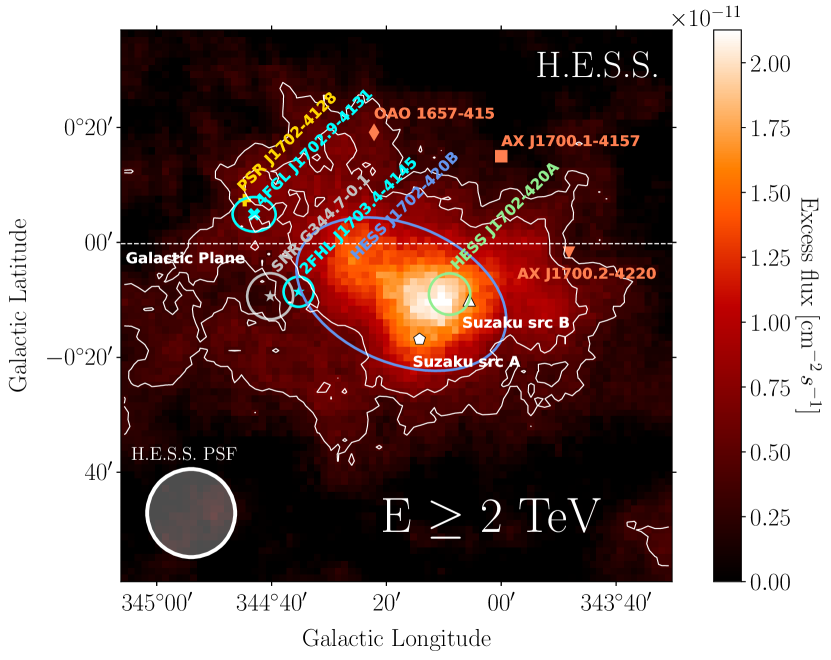
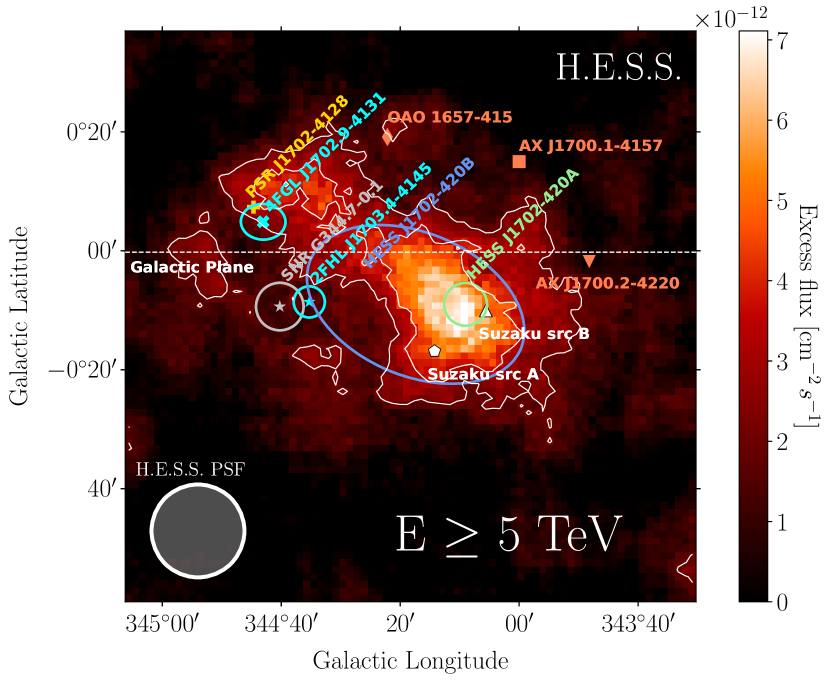
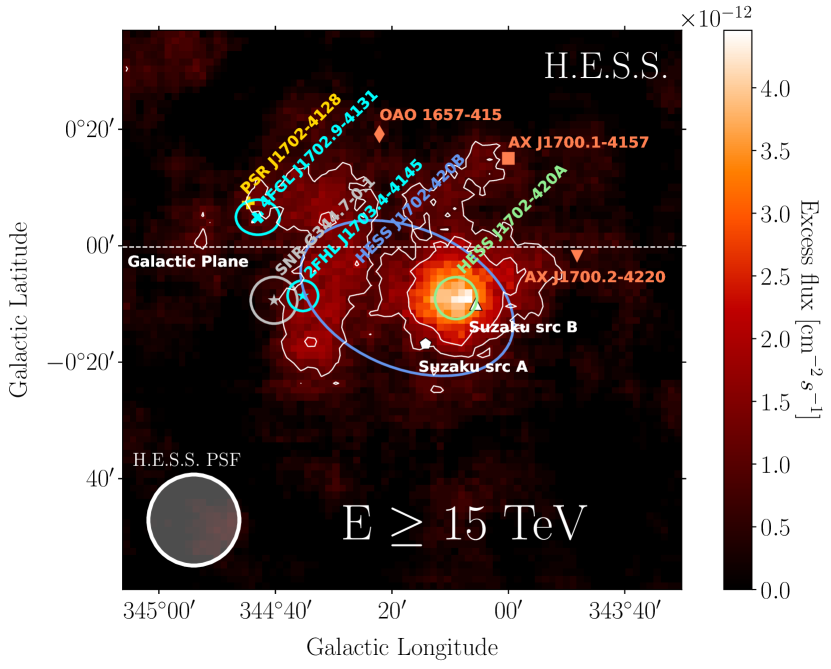
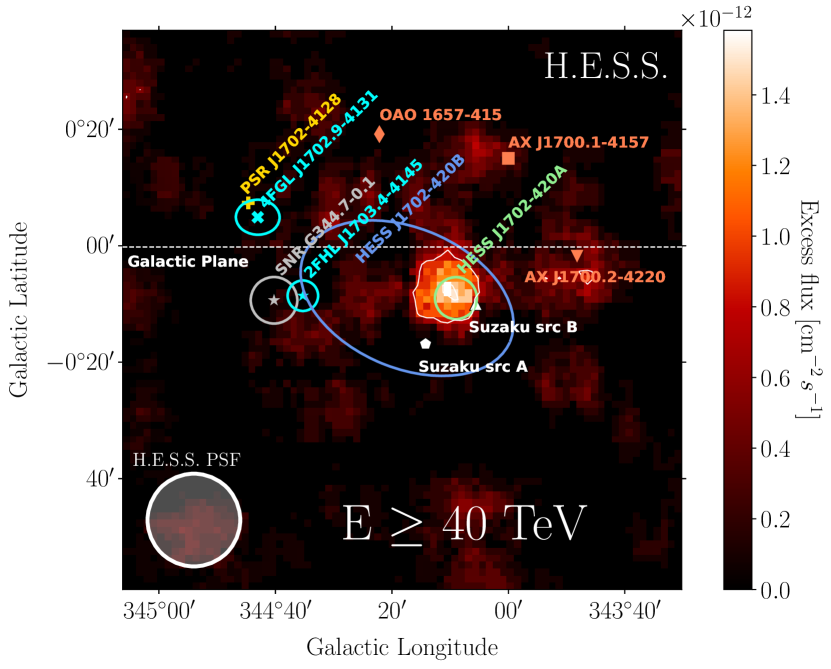
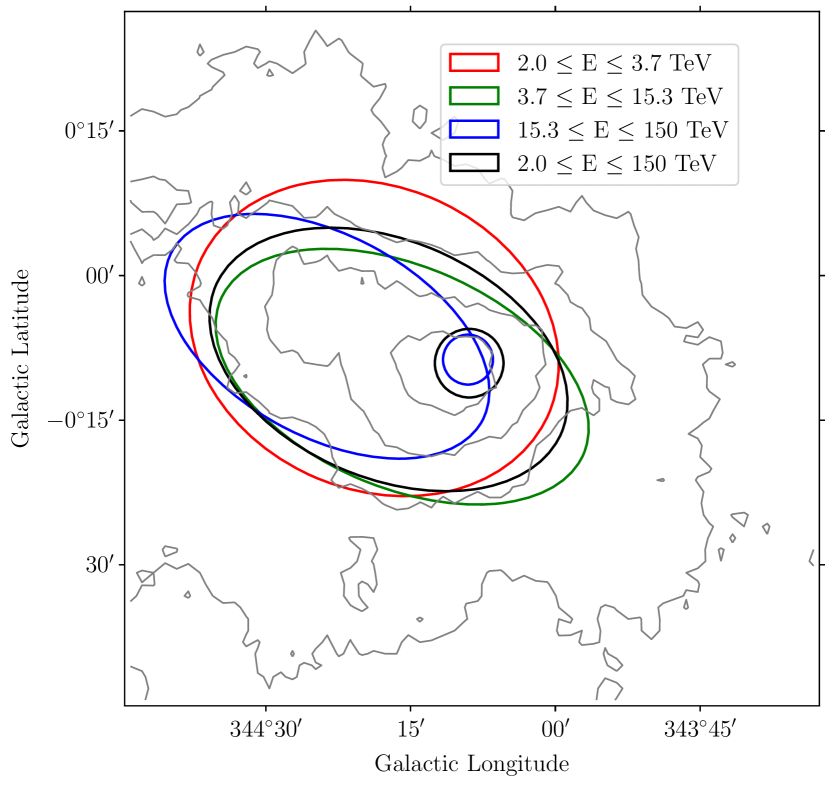
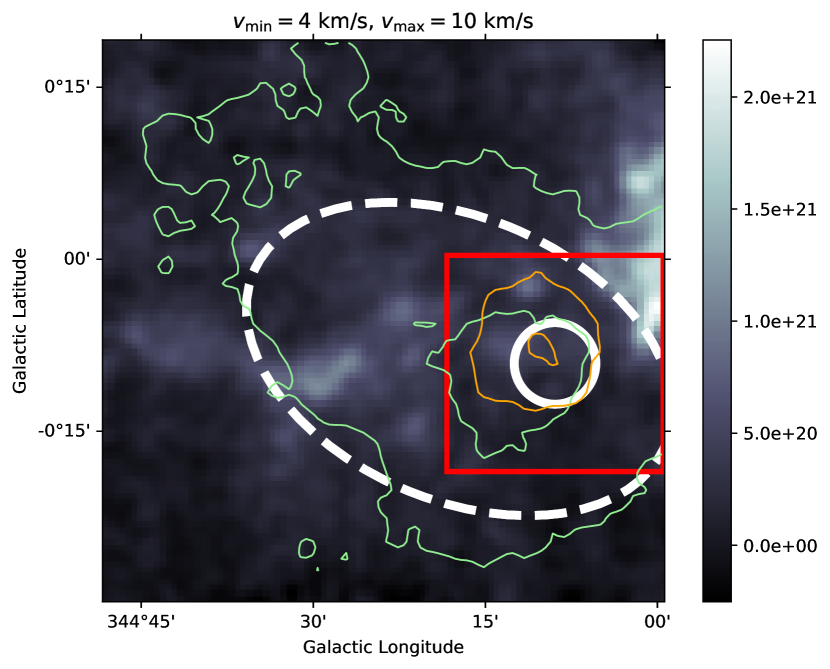
As a complementary study, we performed a 2D analysis of the energy-integrated morphology of HESS J1702-420 in different energy bands. This technique is useful to assess the overall source morphology and verify the persistence of the TeV emission up to the highest energies, even if it does not allow to disentangle HESS J1702-420A from HESS J1702-420B. The level of cosmic ray background in the region was estimated using the adaptive ring background estimation method (Berge et al. 2007; Carrigan et al. 2013). We also verified that consistent flux and significance distributions can be obtained with the FoV background estimation method (Section 2.1). After subtracting the -like hadronic background, we measured -ray flux integrated above 2, 5, 15 and inside a region encompassing HESS J1702-420. The result is shown in Figure 3. The figure suggests a shrinking of the VHE emission at high energy, with a shift of the -ray peak toward the position of the unidentified source Suzaku src B. Based on the 3D analysis results (Section 2.1), this effect is understood as the transition between a low energy regime — dominated by the steep spectrum of HESS J1702-420B — to a high energy one, in which HESS J1702-420A stands out with its exceptionally hard power law spectrum. Quantitatively, the distance between the low and high energy emission peaks — estimated from the distance between the centroids of HESS J1702-420A and HESS J1702-420B — amounts to .
3 Multi wavelength observations
Even in the absence of a multi wavelength detection of HESS J1702-420, low-energy observations can help to constrain the TeV emission scenarios. Section 3.1 summarizes a dedicated analysis of archival Fermi-LAT data in the HESS J1702-420 region, while Section 3.2 reports our considerations on the surrounding ISM and Section 3.3 discusses archival Suzaku measurements in the context of the new H.E.S.S. results.
3.1 Fermi-LAT data analysis and results
Launched in 2008, the Fermi-LAT is a pair-conversion instrument sensitive to the HE -ray domain (Atwood et al. 2009). We analyzed of events with energies in the interval, within a RoI encompassing HESS J1702-420. Event selection and binning criteria are detailed in Appendix E. The analysis, performed with fermipy (Wood et al. 2017), made use of Pass 8 IRFs (Atwood et al. 2013).
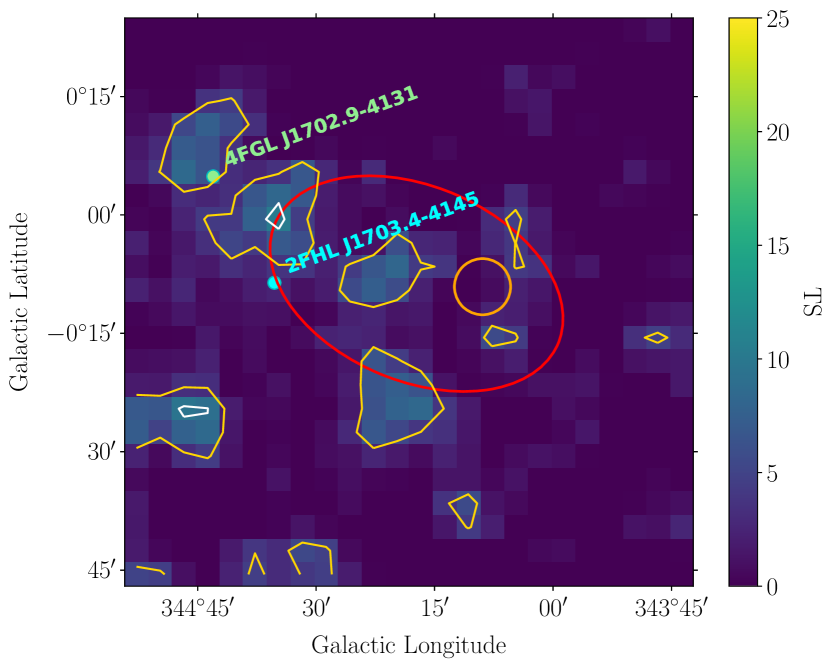
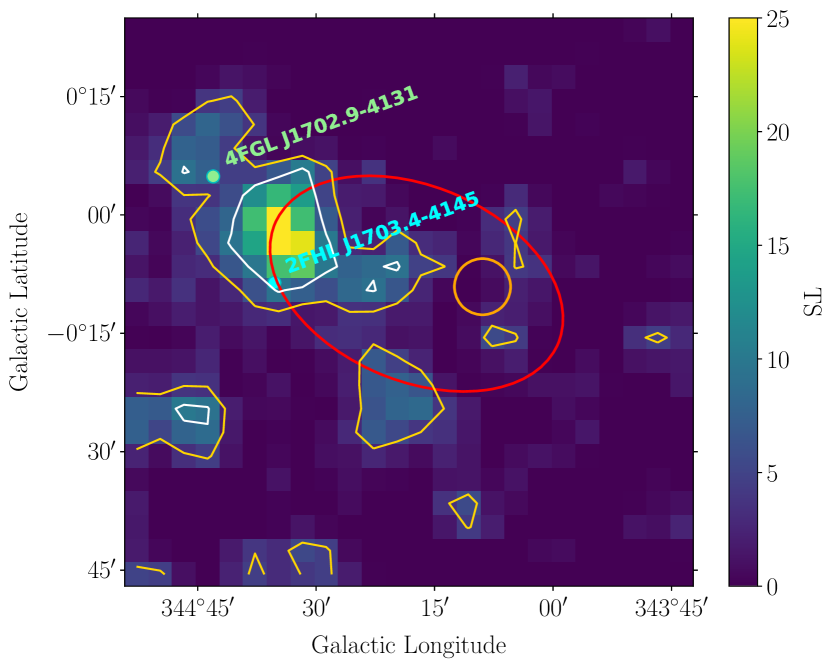
To build the source model, we selected all sources from the Fourth Fermi General Catalog (4FGL), Thompson (2019), and second Fermi-LAT Catalog of High Energy Sources (2FHL), Ackermann et al. (2016), within from the RoI center. In the model, we also included recent diffuse -ray emission templates, both Galactic and extra-Galactic. More details on the source modeling can be found in Appendix E. After the maximum likelihood fit, we produced a TS map to investigate the presence of statistically significant excesses. For each spatial bin, the algorithm compared the maximum log-likelihood obtained by fitting the model, with the addition of a point source ( frozen, amplitude free) at that position, with that of the starting model alone (null hypothesis). We verified that the TS map does not significantly depend on the spectral index or spatial morphology chosen for the test source. The TS map displayed in Figure 4 shows that, within the source region, there is no evidence for a significant excess, but some low-significance fluctuations are present. For comparison, Figure 10 shows a TS map computed before removing the contribution from point sources.
Finally, we included an additional model component defined by a power law spectrum and an elliptical Gaussian morphology identical to the spatial model of HESS J1702-420B (Section 2.1.3). Its contour is indicated by the red ellipse in Figure 4. We left free to vary the normalization and index of source spectrum, performed a maximum likelihood fit and compared the resulting model likelihood with the null hypothesis (no source). We found only marginal significance () for a positive excess corresponding to the chosen Gaussian template. In the absence of a clear detection, we estimated the 99% confidence-level upper limit for the HE emission, associated with the HESS J1702-420B template shape, at the level of
| (3) |
where is the geometric mean of the Fermi-LAT energy range. This value was used to constrain the low-energy extrapolation of the HESS J1702-420B spectrum to the Fermi-LAT energy range (Section 4.2).
3.2 The interstellar medium
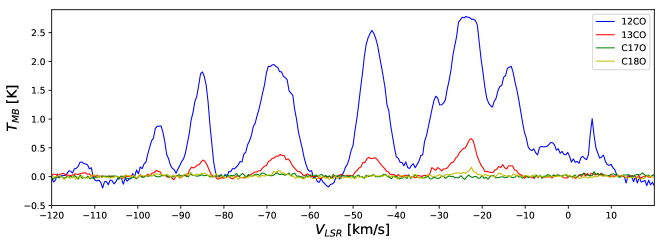
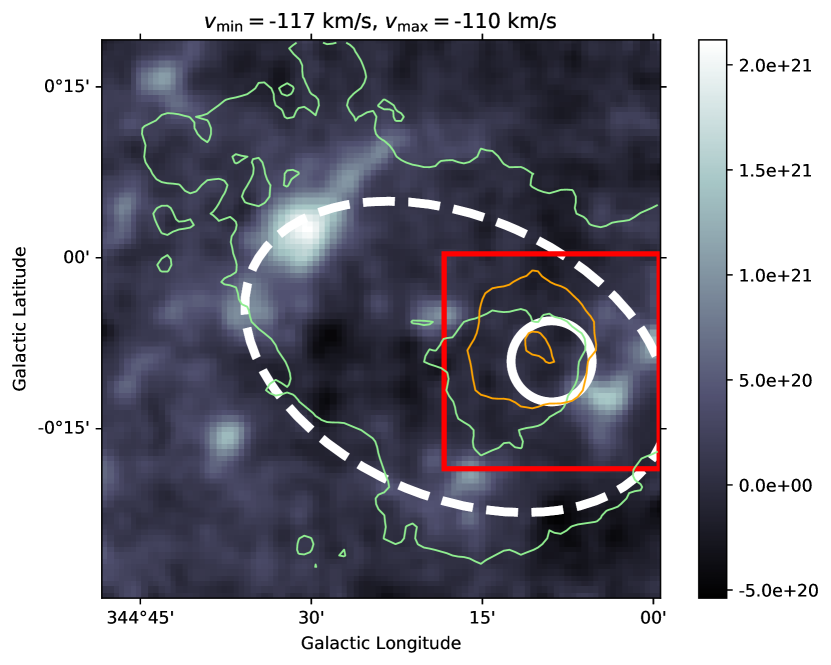
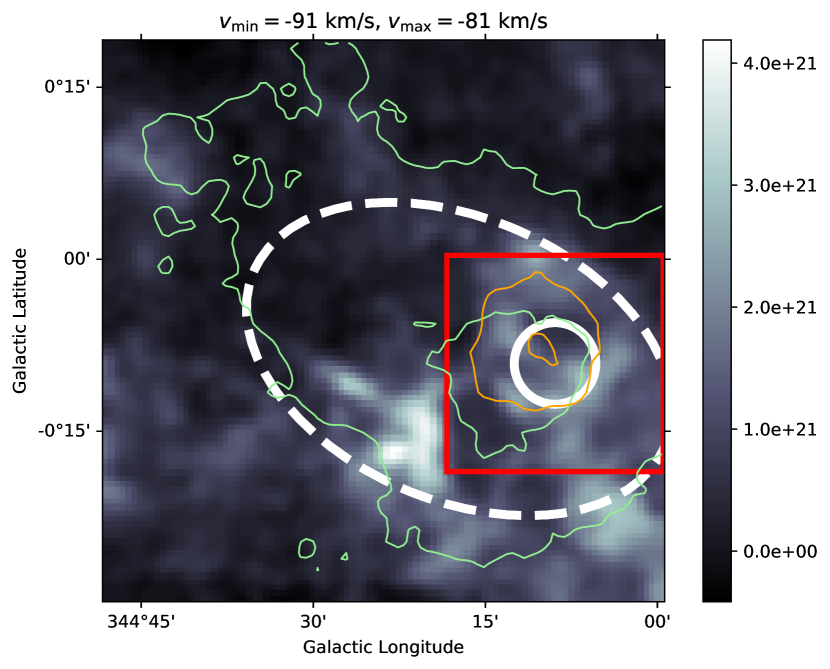
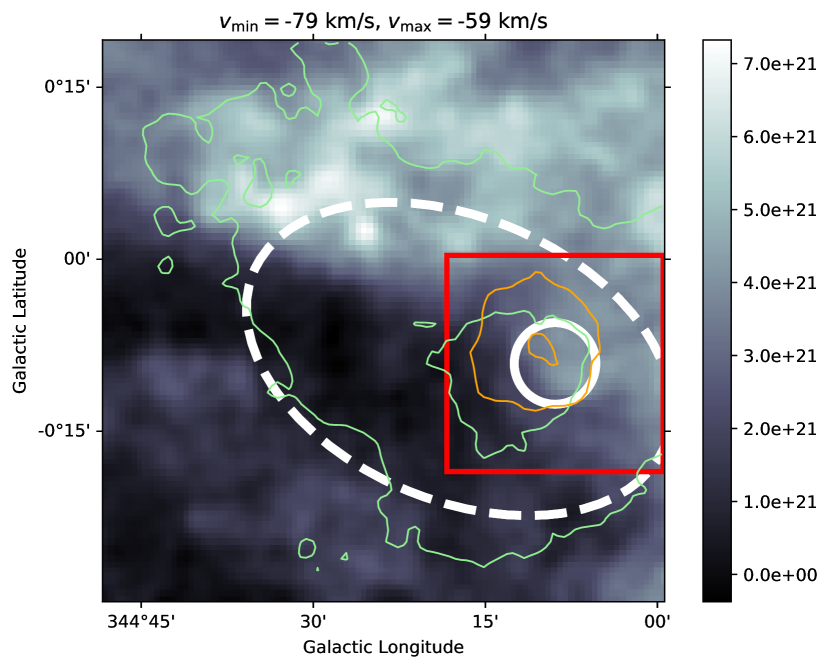
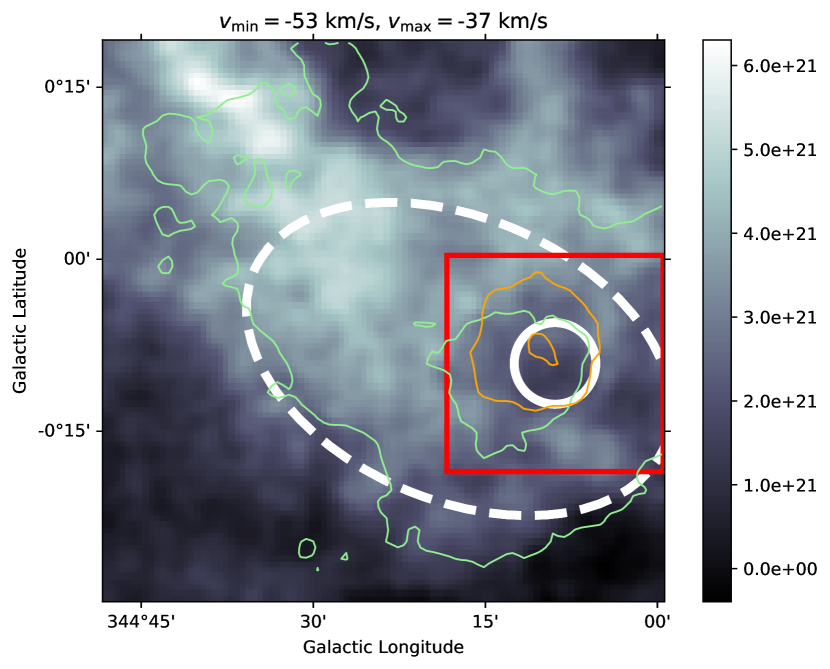
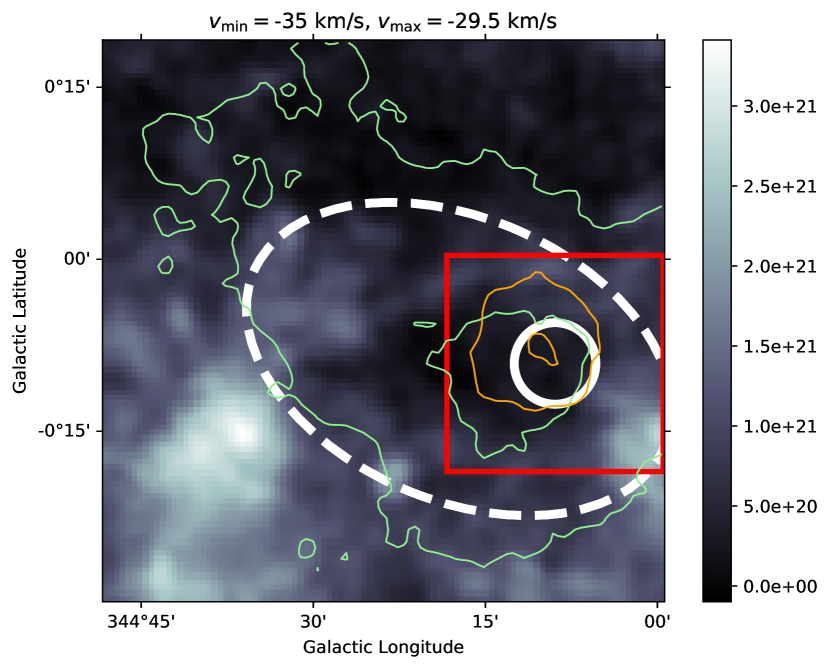
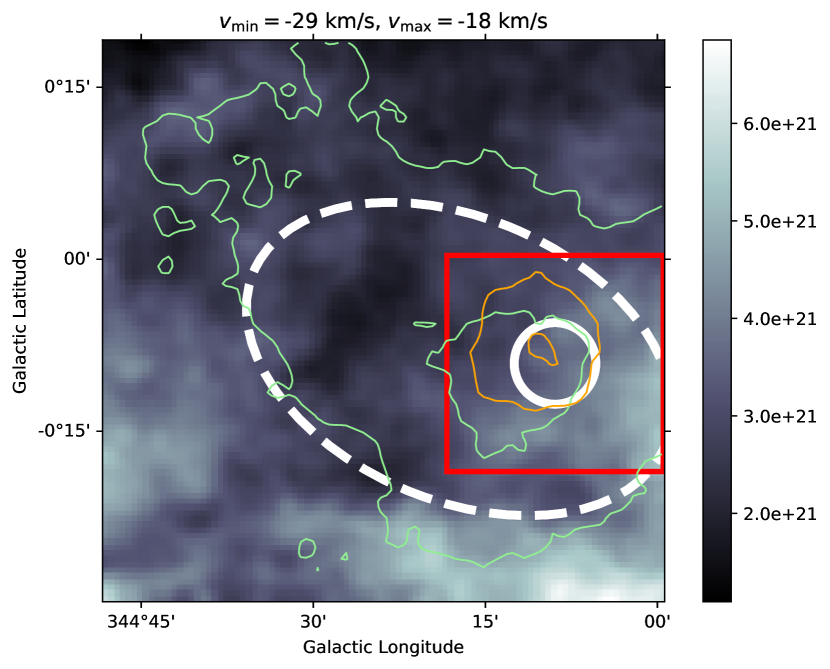
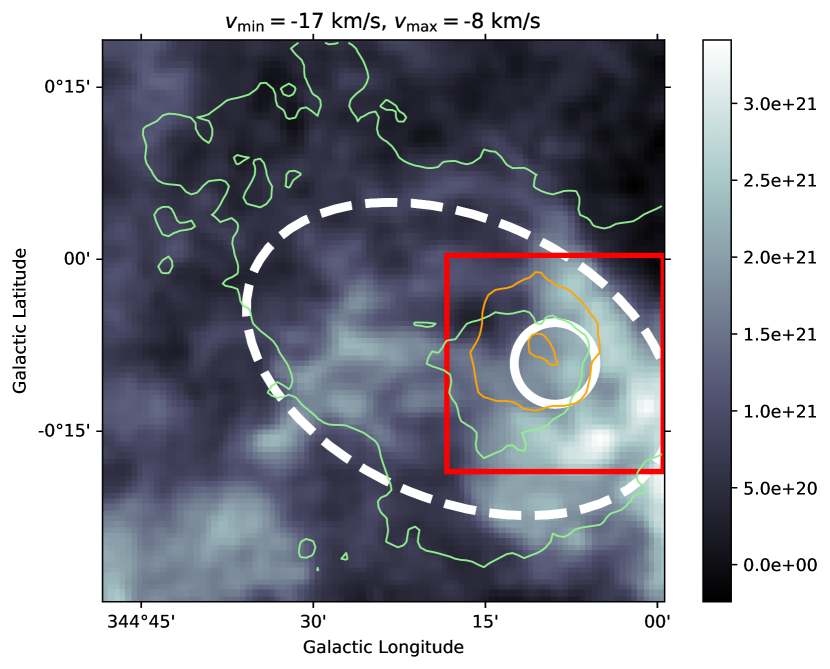
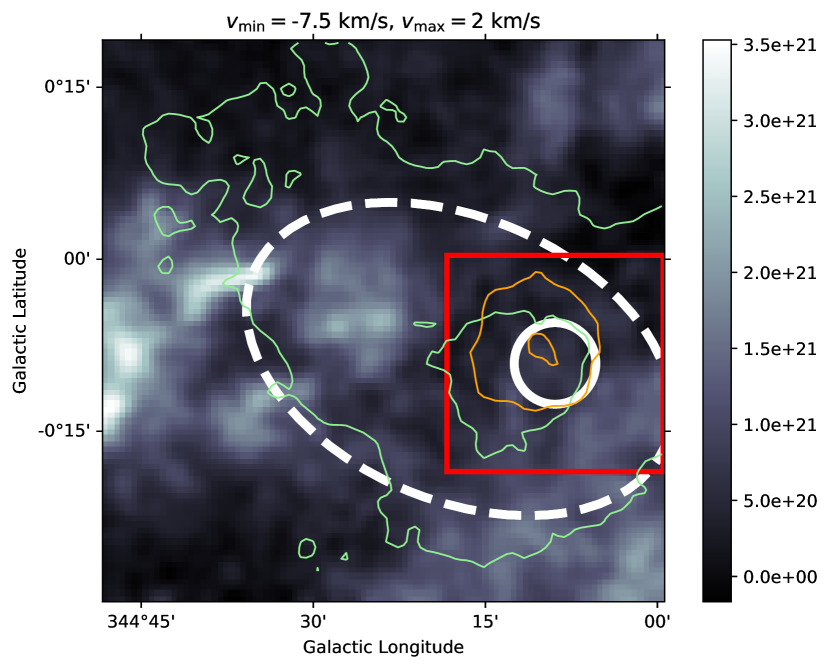
Observations of the southern Galactic plane in the 109–115 GHz radio band with Mopra (Braiding et al. 2018), together with the Southern Galactic Plane Survey of the cm line emission with the ATCA and Parkes telescopes (McClure-Griffiths et al. 2005), allow the study of the molecular and atomic gas distribution in the direction of HESS J1702-420.
The gas densities along the line of sight were measured by Lau et al. (2018), integrating the velocity peaks within a ellipse centered at = and =. This choice of integration region reflected the approximate shape of the TeV source, from Aharonian et al. (2008). Based on the new H.E.S.S. observations and improved analyses presented in this paper (Section 2), we repeated the ISM analysis, with the same radio dataset and approach as in Lau et al. (2018) but adopting a smaller extraction window to focus on HESS J1702-420A. Our conclusions agree with Lau et al. (2018), in that dense target material, although present at various distances along the line of sight (see Figure 11), does not exhibit any obvious correlation with the VHE -ray maps (see Figure 12). In particular, no hydrogen cloud clearly correlates with HESS J1702-420A or HESS J1702-420B.
3.3 Comparison with X-ray observations of HESS J1702-420
In the X-ray domain, deep Suzaku observations of the HESS J1702-420 region revealed the presence of two faint point-like objects (src A and src B, indicated in Figure 3) and the absence of diffuse X-ray emission in the Suzaku FoV, whose dimensions were however insufficient to fully cover the whole TeV source (Fujinaga et al. 2011). Suzaku src B, in particular, is positionally close to the newly discovered component HESS J1702-420A (see Figure 3), which might hint at the first multi wavelength association for HESS J1702-420. For Suzaku src B Fujinaga et al. (2011) estimated a very low flux (in the 2- band) of , and did not report any evidence of source extension linked with a compact PWN. However, we point out that the Suzaku measurement likely suffered from strong systematics at the position of src B. Indeed, referring to Figure 2 in Fujinaga et al. (2011), it appears that src B was probably not fully contained in the Suzaku FoV, thus leading to an underestimated flux. The higher level of X-ray fluctuations in the corner surrounding src B suggests that the actual level of diffuse emission at that position might be larger than elsewhere in the FoV. Therefore, an association between src B and HESS J1702-420A cannot be ruled out at this stage.
4 Discussion
To model the -ray emission of HESS J1702-420A and HESS J1702-420B, we replaced the power law spectral functions that were used in the 3D analysis (Section 2.1) with simple physically-motivated non thermal radiative models from naima (Zabalza 2015). We derived the present-age spectral shape of the parent cosmic ray population, exploring both hadronic and leptonic one-zone emission scenarios. Owing to the NaimaSpectralModel class implemented in gammapy, we could forward-fold the naima radiative models directly on the H.E.S.S. 3D data. This represents a significant improvement with respect to a simple fit to precomputed flux points, which is inevitably biased by the spectral assumption made for the flux point computation.
Because of the unclear level of association between HESS J1702-420A and HESS J1702-420B, we modeled them independently. For the hadronic emission models, based on the analytic parametrization of - interaction and decay developed in Kafexhiu et al. (2014), we assumed a fixed target density . During the fit, a fiducial distance from Earth of was assumed. We note that the gas density, as well as the source distance from Earth, do not influence the spectral shape and are both degenerate with the source intrinsic luminosity, that may be rescaled a posteriori assuming different values of and (see for example Eq. 5). In the leptonic scenario, based on the analytic approximation presented in Khangulyan et al. (2014), the VHE -ray emission was attributed to inverse-Compton up-scattering by electrons of the cosmic microwave background (CMB) and infrared (IR) low-energy photon fields. The uniform CMB field was described as a black-body radiation with energy density of and temperature of . The starlight emission in the near IR ( and ) and dust re-emission in the far IR ( and ) were obtained using the 3D interstellar radiation field (ISRF) model from Porter et al. (2018), at the coordinates of HESS J1702-420 and the assumed distance. We verified that the level of fluctuations of the ISRF along the line of sight did not significantly impact the modeling conclusions. The results are discussed in Sections 4.1 and 4.2.
4.1 HESS J1702-420A
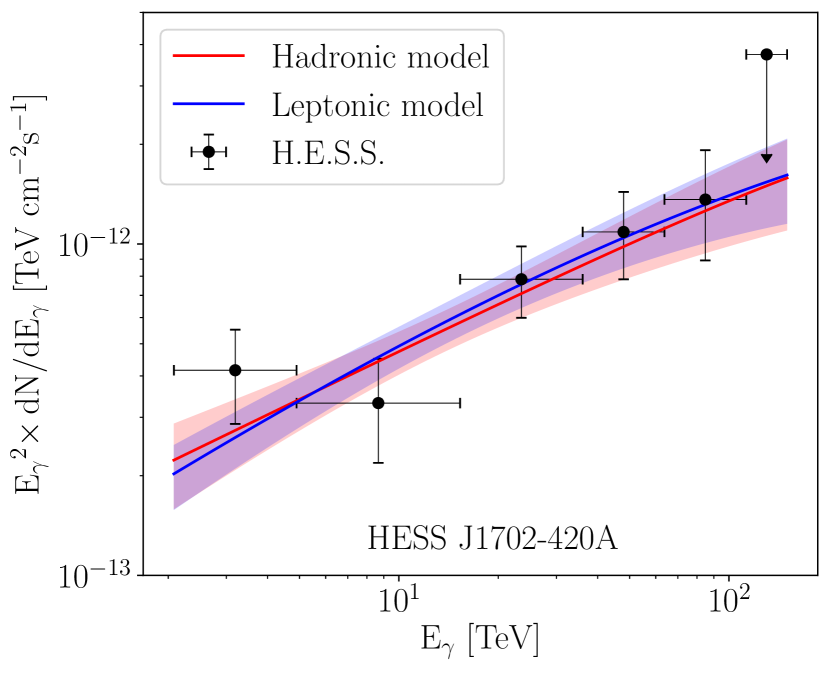
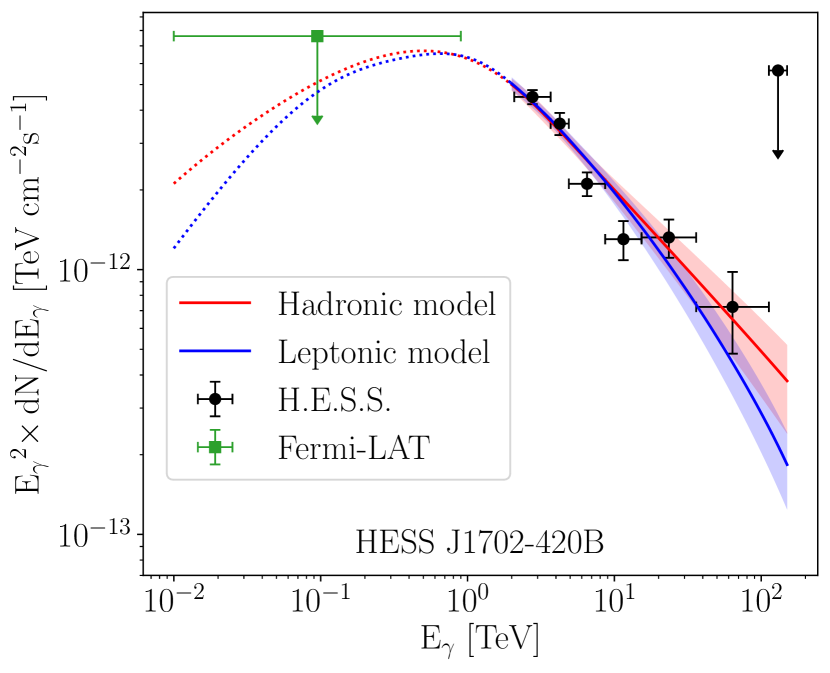
HESS J1702-420A has one of the hardest -ray spectra ever detected in a VHE -ray source. This means that the spectral indices of the underlying particle distributions, responsible for the -ray flux via hadronic or leptonic processes, have to be extremely hard themselves. A pure power law distribution of protons (electrons) with slope () is well suited to produce the -ray emission of HESS J1702-420A, via hadronic (leptonic) radiative processes. The two spectra, with their butterfly envelopes, are shown in Figure 5 (left panel), where the H.E.S.S. spectral points — see Table 9 — are shown for reference purpose only as they were not used for the fit.
Based on the currently available H.E.S.S. data, any attempt of fitting an additional parameter for the cut-off energy of the particle spectra led either to a non-covergence of the fit or to an unphysically high cutoff energy value. We therefore computed lower limits on the particle cut-off energy, following the procedure described in Appendix F. To estimate the lower limits, we modified the model likelihood adding a Gaussian prior on the particle spectral index, to prevent it from floating toward nonphysical regions (i.e., very small or even negative values), due to the trial of low cut-off energies and the reduced lever arm for this spectral modeling. In the case of the hadronic model, we assumed as a prior a Gaussian distribution centered at and with , based on standard diffusive shock acceleration theory (DSA; Bell (1978)). We estimated the impact of this prior choice by varying the Gaussian central values to and . We found that for a prior centered at (1.7, 2.3) the 95% confidence-level lower limit on the proton cut-off energy is 0.82 (0.55, 1.16) PeV. The fact that — independenly of the chosen prior — the cut-off energy lower limit is found at means that in a hadronic scenario the source likely harbors PeV cosmic rays. In the leptonic case, we tested three different Gaussian priors, all having width . Based on Sironi & Spitkovsky (2011) and Werner et al. (2015), we chose a prior centered at to probe shock-driven magnetic reconnection in conditions of moderate wind magnetization, to account for Fermi-like acceleration at the termination shock in conditions of low upstream magnetization, and finally as an intermediate scenario. Our results showed that assuming (1.5, 2.5) the 95% confidence-level lower limit on the electron cut-off energy is 106 (64, 152) TeV.
The energy contents in protons and electrons, necessary to sustain the -ray emission of HESS J1702-420A, were computed integrating the particle spectra above :
| (4) |
Given the best-fit proton and electron distributions found for HESS J1702-420A, with power law indices , Eq. 4 would diverge unless the presence of a high energy cut-off is assumed. We therefore adopted the 95% confidence level lower limits on the cut-off energies, thus obtaining lower limits on the integrated particle energetics. We verified that the results are not strongly influenced by the choice of spectral index prior. They are:
| (5) |
| (6) |
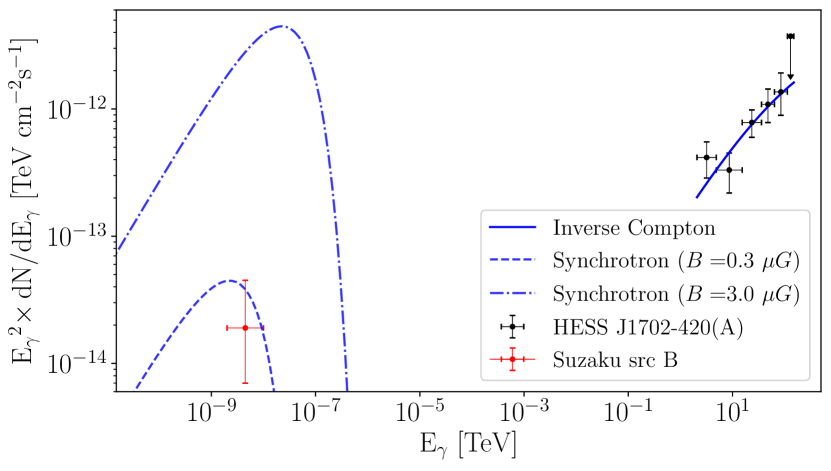
In a leptonic scenario, HESS J1702-420A would be powered by an electron popultion with unusually hard spectral index, , and the electron energy required to power the -ray emission (see Eq. 6) would be high compared to the typical values for TeV detected PWNe (H.E.S.S. Collaboration et al. 2018). A simple one-zone leptonic model is therefore challenged, also because it would imply the unlikely presence of inverse-Compton emitting electrons with . Indeed, given the dependence of the synchrotron loss timescale in the Thomson regime (see Eq. 15), such energetic electrons would cool down extremely fast creating a high energy spectral curvature or break, which is not observed for HESS J1702-420A. To further understand whether a pulsar-PWN association between Suzaku src B (see Section 3.3) and HESS J1702-420A is plausible, we made use of the simple one-zone leptonic model derived in this Section to match the synchrotron emission of HESS J1702-420A with the measured X-ray flux of src B, thus estimating the magnetic field value in the vicinity of the source. This turns out to be unrealistically low: (see Figure 13). In other words, if the Suzaku measurement is reliable (see Section 3.3) an association between HESS J1702-420A and Suzaku src B is very unlikely in a simple one-zone leptonic scenario. For all these reasons, a standard PWN model is disfavored, but cannot be definitively ruled out mainly due to the uncertainties on the X-ray measurement. We notice that an alternative interpretation is possible, in which the observed -ray emission is due to electrons that are accelerated by the reconnection electric field at X-points in the current sheets of a pulsar striped wind, where the magnetic field value is expected to be low (Sironi & Spitkovsky 2011; Werner et al. 2015; Guo et al. 2015). In this case, a Doppler boost of the VHE emission due to relativistic plasma motions might be invoked to explain the apparent presence of inverse-Compton emitting electrons (Cerutti et al. 2020). If true, this would be the first time that a TeV measurement probes the reconnection spectrum immediately downstream of the termination shock of a pulsar wind. However, the lack of a clear multi wavelength detection of the compact object providing the necessary electron population renders this hypothesis unlikely.
In a hadronic scenario, VHE -ray emission is attributed to the interaction of energetic protons with target material within a source or a nearby molecular cloud. In this case, the -ray emission from HESS J1702-420A, together with its proton cut-off energy lower limit at , would make it a compelling candidate site for the presence of PeV cosmic ray protons. Therefore HESS J1702-420A becomes one of the most solid PeVatron candidates detected in H.E.S.S. data, also based on the modest value of the total energy in protons that is necessary to power its -ray emission (see Eq. 5) and the excellent agreement of a simple proton power law spectrum with the data. However, we notice that a proton spectrum with a slope of over two energy decades is hard to achieve in the standard DSA framework (Bell 1978). This fact may suggest that HESS J1702-420A, instead of being a proton accelerator, is in fact a gas cloud that, being illuminated by cosmic rays transported from elsewhere, acts as a passive -ray emitter. In that case, the hard measured proton spectrum could result from the energy-dependent particle escape from a nearby proton PeVatron (Gabici et al. 2009). Alternatively, the -ray emission from HESS J1702-420A might be interpreted as the hard high energy end of a concave spectrum arising from nonlinear DSA effects (Kang et al. 2009), or originate from the interaction of SNR shock waves with a young stellar cluster wind (Bykov et al. 2015). The absence of a clear spatial correlation between the ISM and the observed TeV emission (see Section 3.2) prevents a confirmation of the hadronic emission scenario, unless an extremely powerful hidden PeVatron is present. In the latter case, even a modest gas density would suffice to produce the measured -ray emission of HESS J1702-420A, which would explain the observed nonlinearity between the ISM and TeV maps (see Section 3.2).
4.2 HESS J1702-420B
The baseline proton and electron spectra, used to model the -ray emission of HESS J1702-420B, are broken power laws of the form
| (7) |
where and are the energy of the spectral break and the reference energy, respectively. The introduction of a spectral break was necessary, because a simple power law extrapolation from the VHE to the HE -ray range would have led to unrealistic energy budgets and an overshoot of the Fermi-LAT upper limit (Section 3.1). The first power law index, , was adjusted manually with respect to the Fermi-LAT upper limit — its value is therefore not to be interpreted as a fit result, but rather as a working assumption.
In the hadronic (leptonic) scenario, the best-fit proton (electron) spectrum corresponds to a broken power-law with slopes (1.4) and (), and with break energy of (). The 95% confidence-level lower limit on the proton (electron) cut-off energy — computed as described in Appendix F — is 550 (140) TeV.
The values of proton and electron energetics, necessary to power the -ray emission of HESS J1702-420B, were computed integrating the broken power law particle spectra above . They are:
| (8) |
| (9) |
In a leptonic scenario, HESS J1702-420A and HESS J1702-420B could be seen as different emission zones belonging to the same PWN complex. However, we deem this interpretation unlikely for several reasons. First of all, a leptonic scenario for HESS J1702-420A is disfavored by the arguments in Section 4.1. Also, the only known nearby pulsar is PSR J1702-4128, that to power the whole TeV source would require an extremely high conversion efficiency of its spin down luminosity into -rays;
| (10) |
where was obtained considering both HESS J1702-420A and HESS J1702-420B, and assuming the same pulsar’s distance from Earth (Kramer et al. 2003). The result of Eq. 10 is well above the efficiency of all other PWNe identified by H.E.S.S. in the same energy range (H.E.S.S. Collaboration et al. 2018). Finally, several PWNe detected by H.E.S.S. have an energy-dependent morphology with spectral softening away from the pulsar position (e.g., H.E.S.S. Collaboration et al. (2012, 2019)), which seems not to be the case for HESS J1702-420 (see Appendices D and A). However, we point out that this might be due to insufficient statistics or spatial resolution, and that not all TeV-bright PWNe detected by H.E.S.S. have an energy-dependent morphology (e.g., H. E. S. S. Collaboration (2020)). Therefore, leptonic scenarios cannot be definitively ruled out. In particular, as argued in Gallant (2007), the PSR J1702-4128 might power only part of the TeV emission. Indeed, significant VHE -ray emission is detected by H.E.S.S. near the pulsar position — see Figure 3 (upper right panel).
In a hadronic scenario, HESS J1702-420B might be interpreted as a proton accelerator, whose spectral break around is due to energy-dependent cosmic ray escape from the source. In this case, as argued in Section 4.1, the hard -ray spectrum of HESS J1702-420A could be the signature of delayed emission from the highest energy runaway protons, hitting target material in the ISM. This scenario is challenged however by the absence of clear TeV correlation at the location of HESS J1702-420A (see Section 3.2).
4.3 Distance from Earth and environmental parameters
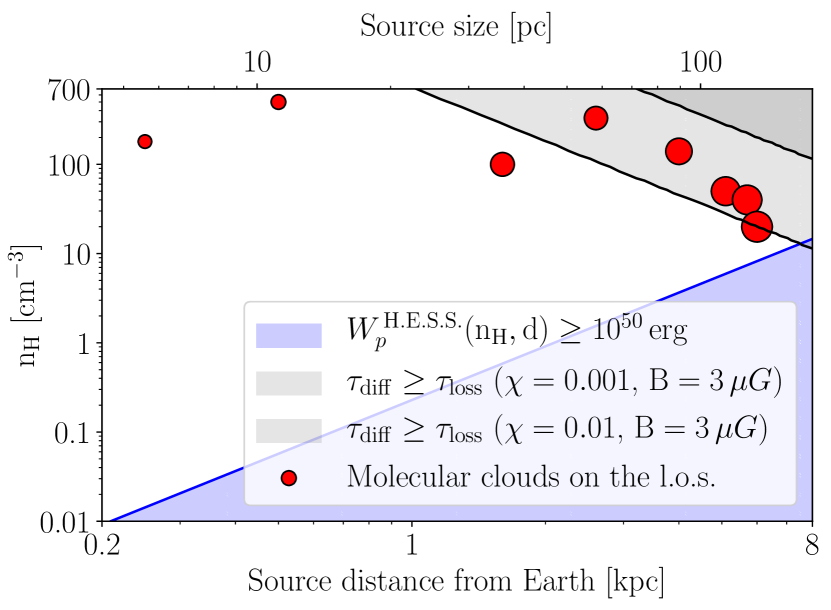
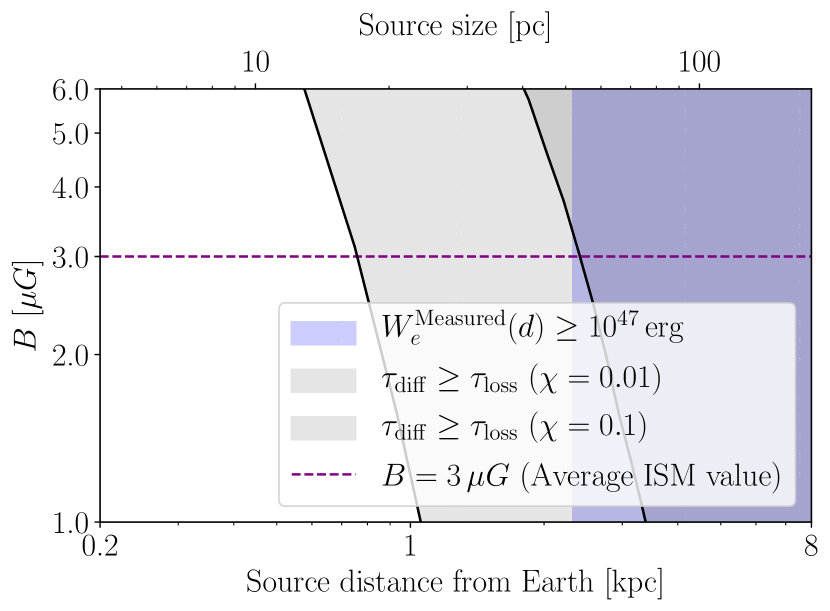
Even if an unequivocal identification of HESS J1702-420 remains elusive, mostly due to the uncertain relationship between HESS J1702-420A and HESS J1702-420B, the new H.E.S.S. observations allow us to constrain the source distance from Earth and the values of the most relevant environmental parameters in a hadronic or leptonic emission scenario, which are respectively the gas density and magnetic field strength . In this section, we make the assumption that the two components are associated. This means assuming that their distance from Earth is roughly the same, and their TeV emissions are connected.
The constraints we found are shown in Figure 6. The left panel focuses on hadronic scenarios: molecular clouds from Lau et al. (2018) are indicated by red circles, with size proportional to (the logarithm of) the proton energy necessary to power the -ray emission of HESS J1702-420B in each case (see Table 10 for more details). For all clouds, the nearer kinematic distance was assumed. The blue exclusion region in the figure was obtained requiring that the measured proton energetics above (from Eq. 8) do not exceed , which is the kinetic energy transferred to cosmic rays by a typical SNR. Finally, the gray shaded areas exclude portions of the parameter space in which protons of energy are cooled down due to - collisions before having time to diffuse across the whole size of HESS J1702-420B. For this calculation, we assumed a standard ISM magnetic field of , and tested different values for the normalization factor of the diffusion coefficient — defined in Gabici et al. (2007). It is clear that, if the source lies in the diluted ISM where , it has to be relatively close — —, unless its proton energy budget exceeds . If the normalization of the diffusion coefficient is low (), only the three nearest molecular clouds would be apt to harbor the source, whose distance would again be .
In the right panel, which focuses on leptonic scenarios, the gray exclusion areas correspond to portions of the parameter space in which electrons with energy do not have time to fill the whole component HESS J1702-420B before being cooled down. From the figure, it is clear that if the normalization of the diffusion coefficient is low (), then the source has to be relatively close — less than away, for realistic values of field.
5 Conclusions
We present new H.E.S.S. observations of the unidentified source HESS J1702-420, processed using improved techniques, that bring new evidence for the presence of -rays up to . The low-level analysis configuration, used to reduce the raw telescope data to lists of -like events, was adapted to maximize the telescope’s sensitivity at the highest energies. We performed a 3D likelihood analysis — a relatively new high-level technique in the VHE -ray domain — with gammapy, to determine the simplest and best suited spatial and spectral models to describe the source and its surroundings. This allowed us to separate for the first time two components — both detected at confidence level — inside HESS J1702-420 based on their different morphologies and -ray spectra, both of which extend with no sign of curvature up to several tens of TeV (possibly 100 TeV). We report the confidence level detection of -ray emission from the hardest component, called HESS J1702-420A, in the energy band , which is an unprecedented achievement for the H.E.S.S. experiment and brings evidence for the source emission up to . With a spectral index of , this object is a compelling candidate site for the presence of PeV cosmic rays.
We adjusted physically-motivated non thermal radiative models to the H.E.S.S. data, testing simple one-zone hadronic and leptonic models, and determined that the available observations do not allow us to rule out either of the two scenarios. The 95% confidence level energy cut-off of the baseline proton (electron) distribution of HESS J1702-420A was found in the range (), depending on the assumption made on the particle spectral index. Remarkably, in a hadronic emission scenario the particle spectral cut-off is at , for a range of tested priors. For such a scenario, this implies that the source harbors PeV protons, thus becoming one of the most solid PeVatron candidates detected in H.E.S.S. data. Nevertheless, a leptonic emission scenario for HESS J1702-420A could not be definitively ruled out. We additionally measured the particle energetics that are necessary to power the observed -ray emission. We finally discussed possible constraints on the source distance, ambient magnetic field and surrounding gas density.
In the future, the improved angular resolution of the Cherenkov Telescope Array (CTA) and higher energy coverage of the Southern Wide-field Gamma-ray Observatory (SWGO) will possibly close the debate on the nature of HESS J1702-420. In particular, deep measurements in the 100-200 TeV -ray band will constrain the spectral shape near the cut-off region, thus probing the hadronic or leptonic origin of the emission and determining whether either of the two detected components operates as a real cosmic ray PeVatron. Observations in the X-ray band, on the other hand, will be important to search for a multi wavelength counterpart of the TeV source, and clarify the relationship between HESS J1702-420A and the unidentified Suzaku src B.
Acknowledgements
The support of the Namibian authorities and of the University of Namibia in facilitating the construction and operation of H.E.S.S. is gratefully acknowledged, as is the support by the German Ministry for Education and Research (BMBF), the Max Planck Society, the German Research Foundation (DFG), the Helmholtz Association, the Alexander von Humboldt Foundation, the French Ministry of Higher Education, Research and Innovation, the Centre National de la Recherche Scientifique (CNRS/IN2P3 and CNRS/INSU), the Commissariat à l’énergie atomique et aux énergies alternatives (CEA), the U.K. Science and Technology Facilities Council (STFC), the Knut and Alice Wallenberg Foundation, the National Science Centre, Poland grant no. 2016/22/M/ST9/00382, the South African Department of Science and Technology and National Research Foundation, the University of Namibia, the National Commission on Research, Science & Technology of Namibia (NCRST), the Austrian Federal Ministry of Education, Science and Research and the Austrian Science Fund (FWF), the Australian Research Council (ARC), the Japan Society for the Promotion of Science and by the University of Amsterdam. We appreciate the excellent work of the technical support staff in Berlin, Zeuthen, Heidelberg, Palaiseau, Paris, Saclay, Tubingen and in Namibia in the construction and operation of the equipment. This work benefited from services provided by the H.E.S.S. Virtual Organisation, supported by the national resource providers of the EGI Federation.
References
- Abdo et al. (2009) Abdo, A. A., Ackermann, M., Ajello, M., et al. 2009, ApJS, 183, 46
- Ackermann et al. (2016) Ackermann, M., Ajello, M., Atwood, W. B., et al. 2016, ApJS, 222, 5
- Adams et al. (2021) Adams, C. B. et al. 2021, Astrophys. J., 913, 115
- Aharonian et al. (2008) Aharonian, F., Akhperjanian, A. G., Barres de Almeida, U., et al. 2008, A&A, 477, 353
- Aharonian et al. (2019) Aharonian, F., Yang, R., & de Oña Wilhelmi, E. 2019, Nature Astronomy, 3, 561
- Aharonian et al. (2006) Aharonian, F. et al. 2006, Astrophys. J., 636, 777
- Apel et al. (2013) Apel, W. D. et al. 2013, Astropart. Phys., 47, 54
- Ashton et al. (2020) Ashton, T., Backes, M., Balzer, A., et al. 2020, Astroparticle Physics, 118, 102425
- Atwood et al. (2013) Atwood, W. et al. 2013, in 2012 Fermi Symposium proceedings
- Atwood et al. (2009) Atwood, W. B., Abdo, A. A., Ackermann, M., et al. 2009, ApJ, 697, 1071
- Becherini et al. (2012) Becherini, Y., Punch, M., & H.E.S.S. Collaboration. 2012, in American Institute of Physics Conference Series, Vol. 1505, High Energy Gamma-Ray Astronomy: 5th International Meeting on High Energy Gamma-Ray Astronomy, ed. F. A. Aharonian, W. Hofmann, & F. M. Rieger, 741–744
- Bell (1978) Bell, A. R. 1978, Mon. Not. Roy. Astron. Soc., 182, 147
- Bell (2014) Bell, A. R. 2014, Brazilian Journal of Physics, 44, 415
- Berezinskii et al. (1990) Berezinskii, V. S., Bulanov, S. V., Dogiel, V. A., & Ptuskin, V. S. 1990, Astrophysics of cosmic rays
- Berge et al. (2007) Berge, D., Funk, S., & Hinton, J. 2007, A&A, 466, 1219
- Braiding et al. (2018) Braiding, C., Wong, G. F., Maxted, N. I., et al. 2018, PASA, 35, e029
- Bykov et al. (2015) Bykov, A. M., Ellison, D. C., Gladilin, P. E., & Osipov, S. M. 2015, Monthly Notices of the Royal Astronomical Society, 453, 113
- Carrigan et al. (2013) Carrigan, S., Brun, F., Chaves, R. C. G., et al. 2013, in 48th Rencontres de Moriond on Very High Energy Phenomena in the Universe
- Cash (1979) Cash, W. 1979, ApJ, 228, 939
- Cerutti et al. (2020) Cerutti, B., Philippov, A. A., & Dubus, G. 2020, A&A, 642, A204
- Chang et al. (2008) Chang, C., Konopelko, A., & Cui, W. 2008, Astrophys. J., 682, 1177
- Combi et al. (2010) Combi, J. A., Albacete Colombo, J. F., López-Santiago, J., et al. 2010, A&A, 522, A50
- Deil et al. (2017a) Deil, C., Boisson, C., Kosack, K., et al. 2017a, in American Institute of Physics Conference Series, Vol. 1792, 6th International Symposium on High Energy Gamma-Ray Astronomy, 070006
- Deil et al. (2020) Deil, C., Donath, A., Terrier, R., et al. 2020, gammapy/gammapy: v0.17, 10.5281/zenodo.4701492
- Deil et al. (2017b) Deil, C., Zanin, R., Lefaucheur, J., et al. 2017b, in International Cosmic Ray Conference, Vol. 301, 35th International Cosmic Ray Conference (ICRC2017), 766
- Donath et al. (2015) Donath, A., Deil, C., Arribas, M. P., et al. 2015, in International Cosmic Ray Conference, Vol. 34, 34th International Cosmic Ray Conference (ICRC2015), 789
- Dubner et al. (1993) Dubner, G. M., Moffett, D. A., Goss, W. M., & Winkler, P. F. 1993, AJ, 105, 2251
- Eagle et al. (2020) Eagle, J., Marchesi, S., Ajello, M., Castro, D., & Vendrasco, A. 2020, Astrophys. J., 904, 123
- Fujinaga et al. (2011) Fujinaga, T., Bamba, A., Dotani, T., et al. 2011, Publications of the Astronomical Society of Japan, 63, S857
- Gabici et al. (2007) Gabici, S., Aharonian, F. A., & Blasi, P. 2007, Ap&SS, 309, 365
- Gabici et al. (2009) Gabici, S., Aharonian, F. A., & Casanova, S. 2009, MNRAS, 396, 1629
- Gaisser et al. (2016) Gaisser, T. K., Engel, R., & Resconi, E. 2016, Cosmic Rays and Particle Physics, 2nd edn. (Cambridge University Press)
- Gallant (2007) Gallant, Y. A. 2007, Ap&SS, 309, 197
- Giacani et al. (2011) Giacani, E., Smith, M. J. S., Dubner, G., & Loiseau, N. 2011, A&A, 531, A138
- Ginzburg & Syrovatskii (1964) Ginzburg, V. L. & Syrovatskii, S. I. 1964, The Origin of Cosmic Rays
- Guo et al. (2015) Guo, F., Liu, Y.-H., Daughton, W., & Li, H. 2015, The Astrophysical Journal, 806, 167
- H. E. S. S. Collaboration (2020) H. E. S. S. Collaboration. 2020, Nature Astronomy, 4, 167
- H. E. S. S. Collaboration et al. (2018) H. E. S. S. Collaboration, Abdalla, H., Abramowski, A., et al. 2018, A&A, 612, A9
- Hess (1912) Hess, V. F. 1912, Phys. Z., 13, 1084
- H.E.S.S. Collaboration et al. (2018) H.E.S.S. Collaboration, Abdalla, H., Abramowski, A., et al. 2018, A&A, 612, A1
- H.E.S.S. Collaboration et al. (2019) H.E.S.S. Collaboration, Abdalla, H., Aharonian, F., et al. 2019, A&A, 621, A116
- H.E.S.S. Collaboration et al. (2012) H.E.S.S. Collaboration, Abramowski, A., Acero, F., et al. 2012, A&A, 548, A46
- H.E.S.S. Collaboration et al. (2016) H.E.S.S. Collaboration, Abramowski, A., Aharonian, F., et al. 2016, Nature, 531, 476
- H.E.S.S. Collaboration et al. (2018) H.E.S.S. Collaboration, Abdalla, H., Abramowski, A., et al. 2018, A&A, 612, A2
- Hillas (1985) Hillas, A. M. 1985, in International Cosmic Ray Conference, Vol. 3, 19th International Cosmic Ray Conference (ICRC19), Volume 3, 445
- Kafexhiu et al. (2014) Kafexhiu, E., Aharonian, F., Taylor, A. M., & Vila, G. S. 2014, Phys. Rev. D, 90, 123014
- Kang et al. (2009) Kang, H., Ryu, D., & Jones, T. W. 2009, ApJ, 695, 1273
- Khangulyan et al. (2014) Khangulyan, D., Aharonian, F. A., & Kelner, S. R. 2014, ApJ, 783, 100
- Kramer et al. (2003) Kramer, M., Bell, J. F., Manchester, R. N., et al. 2003, Monthly Notices of the Royal Astronomical Society, 342, 1299
- Lau et al. (2018) Lau, J. C., Rowell, G., Voisin, F., et al. 2018, Monthly Notices of the Royal Astronomical Society, 483, 3659
- Li & Ma (1983) Li, T. P. & Ma, Y. Q. 1983, ApJ, 272, 317
- MAGIC Collaboration et al. (2020) MAGIC Collaboration, Acciari, V. A., Ansoldi, S., et al. 2020, A&A, 642, A190
- Mattox et al. (1996) Mattox, J. R., Bertsch, D. L., Chiang, J., et al. 1996, ApJ, 461, 396
- McClure-Griffiths et al. (2005) McClure-Griffiths, N. M., Dickey, J. M., Gaensler, B. M., et al. 2005, ApJS, 158, 178
- Mohrmann et al. (2019) Mohrmann, L., Specovius, A., Tiziani, D., et al. 2019, A&A, 632, A72
- Nigro et al. (2019) Nigro, C., Deil, C., Zanin, R., et al. 2019, A&A, 625, A10
- Ohm et al. (2009) Ohm, S., van Eldik, C., & Egberts, K. 2009, Astroparticle Physics, 31, 383
- Piron et al. (2001) Piron, F., Djannati-Atai, A., Punch, M., et al. 2001, Astronomy and Astrophysics - A&A, 374, 895
- Porter et al. (2018) Porter, T., Johannesson, G., & Moskalenko, I. 2018, PoS, ICRC2017, 737
- Rolke et al. (2005) Rolke, W. A., López, A. M., & Conrad, J. 2005, Nuclear Instruments and Methods in Physics Research A, 551, 493
- Sironi & Spitkovsky (2011) Sironi, L. & Spitkovsky, A. 2011, The Astrophysical Journal, 741, 39
- Strong et al. (2004) Strong, A. W., Moskalenko, I. V., Reimer, O., Digel, S., & Diehl, R. 2004, Astron. Astrophys., 422, L47
- Thompson (2019) Thompson, D. J. 2019, in AAS/High Energy Astrophysics Division, Vol. 17, AAS/High Energy Astrophysics Division, 109.33
- Vovk et al. (2018) Vovk, I., Strzys, M., & Fruck, C. 2018, A&A, 619, A7
- Werner et al. (2015) Werner, G. R., Uzdensky, D. A., Cerutti, B., Nalewajko, K., & Begelman, M. C. 2015, The Astrophysical Journal, 816, L8
- Whiteoak & Green (1996) Whiteoak, J. B. Z. & Green, A. J. 1996, A&AS, 118, 329
- Wilks (1938) Wilks, S. S. 1938, Ann. Math. Statist., 9, 60
- Wood et al. (2017) Wood, M., Caputo, R., Charles, E., et al. 2017, in International Cosmic Ray Conference, Vol. 301, 35th International Cosmic Ray Conference (ICRC2017), 824
- Yamaguchi et al. (2012) Yamaguchi, H., Tanaka, M., Maeda, K., et al. 2012, The Astrophysical Journal, 749, 137
- Zabalza (2015) Zabalza, V. 2015, Proc. of International Cosmic Ray Conference 2015, 922
Appendix A Spatially-resolved spectral analysis of H.E.S.S. data
| Region | Spectral index | Livetime | Area | Excess | Significance | ||
|---|---|---|---|---|---|---|---|
| [TeV] | [h] | [sr] | [counts] | ||||
| 1 | 2.61 | 32.7 | 499 | 18.8 | |||
| 2 | 2.21 | 24.8 | 857 | 17.8 | |||
| 3 | 3.13 | 15.4 | 552 | 10.5 | |||
| 4 | 1.96 | 7.3 | 135 | 3.9 |
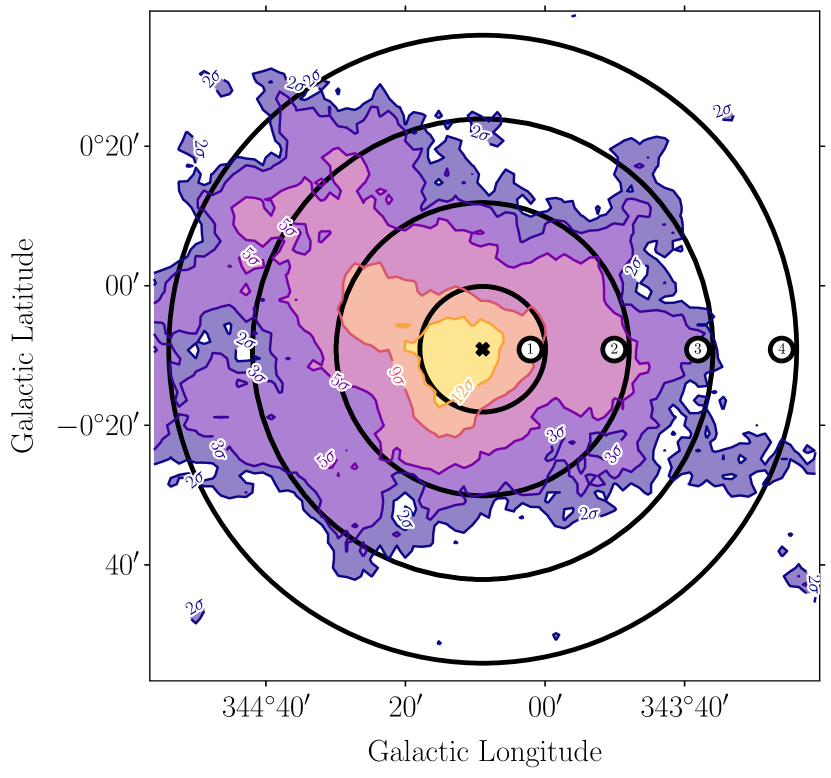
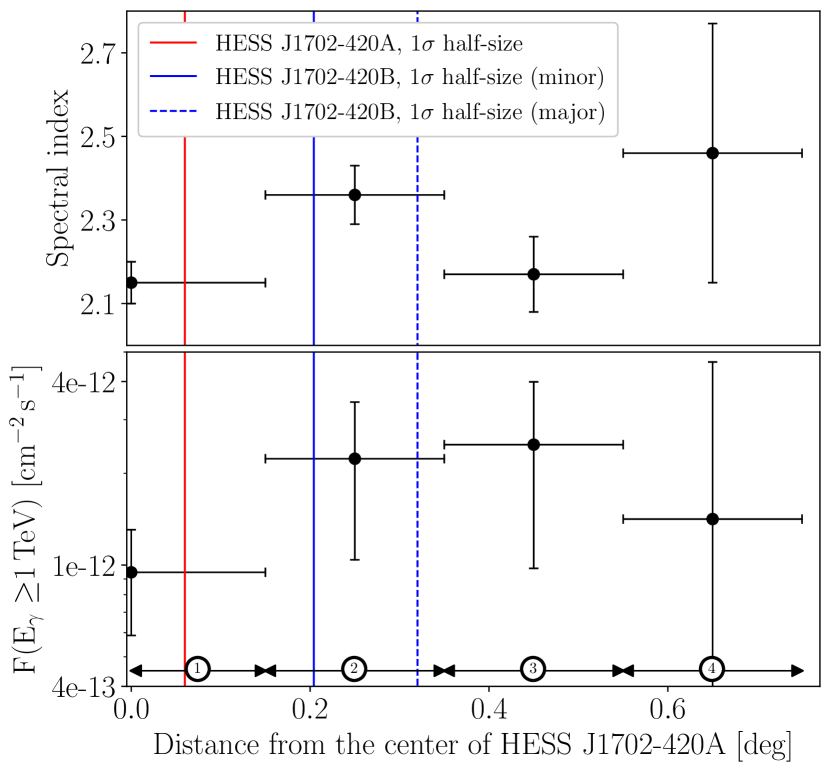
With the benefit of an unprecedented level of statistics in this region, we performed a spatially-resolved spectral analysis for HESS J1702-420. A -radius circle and three -radius annuli were used to measure the VHE -ray spectrum of the source. We did not adopt narrower extraction regions, in order to limit the level of PSF-induced correlation between them. Figure 7 (upper panel) shows the four nonoverlapping regions, overlaid on a map of the -ray flux significance above . All regions are concentric around Galactic coordinates = and =, corresponding to the position of HESS J1702-420A. The level of cosmic ray background within each region was computed with the reflected region background estimation technique (Berge et al. 2007), while a forward-folding approach (Piron et al. 2001) was adopted to determine the maximum-likelihood estimates of the spectral slope and flux, in each region, under a power-law assumption.
The detailed results of the spectral analysis are reported in Table 5, while the spectral variations as a function of the distance from HESS J1702-420A are shown in Figure 7 (bottom panel). The error bars in the figure represent the statistical errors on the fitted parameters. The level of systematic uncertainties, reported in Table 5, have been estimated following H.E.S.S. Collaboration et al. (2018). The figure shows that, in this datasets, there is no evidence for significant spectral variations around HESS J1702-420A. This measurement tends to support a two-component approach, with respect to a model based on a single source with energy-dependent morphology. Indeed, in the latter case significant spatially-resolved spectral variations would be expected, as seen for other well known H.E.S.S. sources (e.g., H.E.S.S. Collaboration et al. (2019)).
Appendix B Hypothesis testing for nested parametric models
According to Wilks’ theorem (Wilks 1938), the TS defined in Eq. 2 is distributed as a , where is the number of additional degrees of freedom of the alternative hypothesis with respect to the null hypothesis. The theorem is valid under the assumptions — always satisfied in our analysis — of high statistics and nested models. Thanks to this theorem, the statistical significance of the alternative hypothesis can be directly estimated from the TS value, by determining the corresponding right-tail -value of a distribution. To convert the significance into units of Gaussian standard deviations (), it is then sufficient to compute z-score of a Gaussian distribution corresponding to the given -value.
Appendix C Non-confirmed large-scale emission component
In the main analysis, a large-scale — in radius — model component was detected around = and =. At that position, the borders of several runs partially overlap, resulting in a boosted exposure level but also strong systematics due to edge effects. In the crosscheck analysis, the exposure level at the position of the large-scale component is lower, resulting in a decreased sensitivity. Accordingly, we verified that its inclusion or exclusion in the source model of the crosscheck analysis did not have any relevant impact on the predicted number of counts at its position. We therefore could not confirm the detection of this new large-scale emission component nearby HESS J1702-420. We point out that the HGPS already reported the presence of a large-scale component with similar position and size, called HGPSG 041, that was similarly discarded due to a non-detection in the crosscheck analysis. In the future, new dedicated observations of the region with more uniform exposure will ultimately probe its presence and nature.
Appendix D 3D analysis of H.E.S.S. data in independent energy bands
| Significance of vs. | Significance of vs. | ||
| TeV | TeV | ||
| 2.0 | 3.7 | 19.0 | 2.4 |
| 3.7 | 15.3 | 20.2 | 2.0 |
| 15.3 | 150 | 12.1 | 5.0 |
According to the 3D model developed in Section 2.1.2, HESS J1702-420 is best described by the superposition of two independent components. To further validate this fact, we repeated the 3D analysis within three independent — that is nonoverlapping — energy bands defined by the edges and . These were chosen to ensure a roughly constant level of -ray flux. During the fit, the spectral indices of all model components were fixed to the values obtained in the whole energy range (Section 2.1.2). This was meant to prevent poor spectral modeling, due to the limited lever arm and insufficient number of photons reconstructed within each individual energy band. The spectral normalizations were instead left free to vary, together with all spatial and background parameters. For each energy band, we used the likelihood ratio test (see Eq. 2) to compare the statistical significance of three nested hypotheses:
- H0:
-
Null hypothesis, with no model component describing HESS J1702-420;
- H1:
-
HESS J1702-420 is described by one Gaussian component, with the spectral index of HESS J1702-420B. For this component, we left the spatial eccentricity and rotation angle free to vary, for a total of six444One spectral normalization, plus five spatial parameters. free model parameters;
- H2:
-
HESS J1702-420 is described by two Gaussian components, with the spectral indices of HESS J1702-420B and HESS J1702-420A. For the latter, we considered a strictly symmetric Gaussian morphology, for a total of four555One spectral normalization, plus three spatial parameters. free model parameters.
The relative significance of each hypothesis, for all the energy bands, is reported in Table 6. It turns out that HESS J1702-420B is significant in all energy bands, while HESS J1702-420A is significant only in the band.
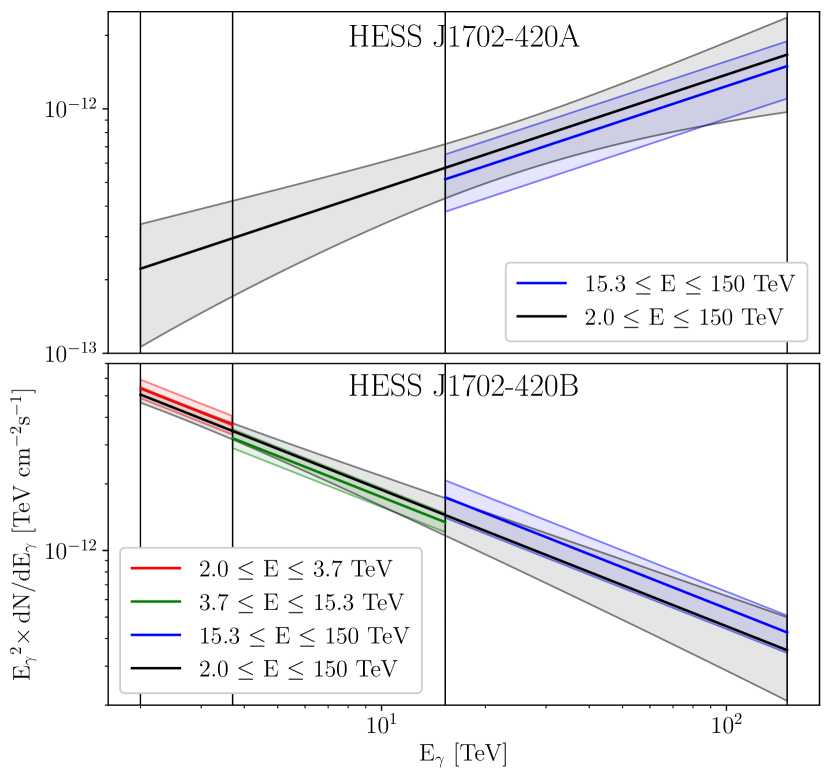
The spatial and spectral shapes of the two components within each energy band are shown in Figure 8, where the reference result from the whole fit range are reported in black. The upper panel shows the contours of HESS J1702-420A and HESS J1702-420B. HESS J1702-420A is not drawn in the two lowest energy bands (i.e., for ), because it is not significant (see Table 6). In each energy band, the best-fit morphologies of both components are consistent with the reference results obtained in Section 2.1. The lower panel of the figure compares the reference spectra of HESS J1702-420A and HESS J1702-420B (in black) with the spectra obtained in different energy bands. The energy-resolved results are well connected and in agreement with the reference power laws.
To summarize, in each independent energy band HESS J1702-420 is well described by a simple model, based on either one or two components with Gaussian morphologies and power law spectra. HESS J1702-420B is significant in all energy bands, with stable morphology and spectrum. HESS J1702-420A instead is significant only in the highest energy band, due to its exceptionally hard spectrum. This is precisely what would be expected in case the emission is due to two separate components. Additionally, we summed the log-likelihood values obtained in each independent energy band, and estimated that globally a two-component model is better than a one-component model with a confidence level of . This value is consistent with the significance for the presence of HESS J1702-420A obtained from the 3D analysis in the full energy range (see Table 3). All these facts support the validity of the simple two-component approach that resulted naturally from the iterative procedure described in Section 2.1.2. However, the possibility that a single source component with energy-dependent morphology could provide a better fit of the data — at the expense of a large number of free parameters describing the variation of source size, eccentricity and center position as a function of the energy — cannot be ruled out at this stage.
Appendix E Fermi-LAT analysis details
The data (photon event file and spacecraft file) were retrieved from the LAT data server, through a query defined by the parameters in Table 7. We adopted the event selection cuts described in Table 8. For the analysis, we defined a square RoI, fully inscribed within the events selection circle. Events were binned spatially using spatial pixels, and spectrally using 8 bins per energy decade.
| Direction (Gal) | Radius | Time range (Gregorian) | Energy (GeV) |
|---|---|---|---|
| 2008-08-04 — 2020-06-26 | 1 — 1000 |
| zmax | evclass | evtype | Selection filter |
|---|---|---|---|
| 90 | 120 | 3 | (DATA_QUAL0)&&(LAT_CONFIG1) |
During the maximum likelihood fit, the spectral index and normalization of all sources within from the RoI center and having a TS value higher than 25 were left free to vary. Additionally, the spectral normalization of all sources with within the whole was also adjusted. The Galactic diffuse emission model (gll_iem_v07.fits) was left free to vary, while the extra-Galactic diffuse model was considered fixed to the default one (iso_P8R3_SOURCE_V2_v1.txt).
Appendix F Method for the derivation of lower limits on the particle cut-off energy
The lower limits on the cut-off energies in the spectra of the proton or electron parent populations were obtained as follows:
-
i
we defined an array of trials particle cut-off energies ;
-
ii
for each fixed cut-off energy , we adjusted a power-law with exponential cut-off to the 3D H.E.S.S. data. The spectral normalization and index, together with all free nuisance parameters of the model, were optimized at each step. For each trial cut-off energy, we stored the likelihood value of the fit, ;
-
iii
then we computed the profile of
(11) where represents the maximum model likelihood under the null power law — or equivalently — hypothesis;
-
iv
we finally computed the 90%,95% and 99% confidence level lower limits on the particle cut-off energy by finding the values where the TS profile increased from the minimum (which in our case was at infinity) by an amount , and respectively.
This procedure, based on Rolke et al. (2005), is partly implemented in the Fit.stat_profile() routine of gammapy.
Appendix G Cosmic ray diffusion model and energy loss calculation
The source physical size depends directly on the distance from Earth and the measured angular size of the source , as . Here, we assumed , which corresponds to the major diameter of HESS J1702-420B. For both hadronic and leptonic cosmic rays, we adopted the energy-dependent diffusion coefficient defined in Gabici et al. (2007), testing different values for the normalization . The relation between the diffusion coefficient and the diffusion timescale is given by:
| (12) |
Energy losses for protons due to - collisions were estimated — neglecting ionization losses that are irrelevant for relativistic protons — as
| (13) |
as in Gabici et al. (2007). Finally, the electron energy loss timescale was computed using
| (14) |
where
| (15) |
is the synchrotron loss timescale and
| (16) |
is the inverse-Compton loss timescale for a given photon field (Ginzburg & Syrovatskii 1964).
Appendix H Additional material
In this section, additional figures and tables are provided.
| e_ref | e_min | e_max | sqrt_ts | counts | dnde | dnde_ul | dnde_errp | dnde_errn |
|---|---|---|---|---|---|---|---|---|
| [TeV] | [TeV] | [TeV] | ||||||
| 3.19 | 2.08 | 4.90 | 3.36 | 40973 | 4.08e-14 | 8.35e-14 | 1.33e-14 | 1.27e-14 |
| 8.66 | 4.90 | 15.32 | 3.15 | 15812 | 4.42e-15 | 7.01e-15 | 1.59e-15 | 1.50e-15 |
| 23.50 | 15.32 | 36.04 | 5.29 | 3363 | 1.42e-15 | 2.00e-15 | 3.64e-16 | 3.33e-16 |
| 47.94 | 36.04 | 63.76 | 4.83 | 835 | 4.73e-16 | 1.02e-15 | 1.52e-16 | 1.33e-16 |
| 84.80 | 63.76 | 112.78 | 4.00 | 454 | 1.89e-16 | 4.91e-16 | 7.76e-17 | 6.54e-17 |
| 130.07 | 112.78 | 150.00 | 0.00 | 145 | 1.20e-23 | 2.21e-16 | 2.48e-17 | 1.20e-23 |
| e_ref | e_min | e_max | sqrt_ts | counts | dnde | dnde_ul | dnde_errp | dnde_errn |
|---|---|---|---|---|---|---|---|---|
| [TeV] | [TeV] | [TeV] | ||||||
| 2.77 | 2.08 | 3.68 | 18.62 | 31603 | 5.86e-13 | 7.16e-13 | 3.62e-14 | 3.58e-14 |
| 4.25 | 3.68 | 4.90 | 12.13 | 9370 | 1.98e-13 | 2.36e-13 | 1.92e-14 | 1.87e-14 |
| 6.51 | 4.90 | 8.66 | 11.01 | 10687 | 4.98e-14 | 5.78e-14 | 5.18e-15 | 5.06e-15 |
| 11.52 | 8.66 | 15.32 | 6.60 | 5125 | 9.82e-15 | 1.14e-14 | 1.68e-15 | 1.64e-15 |
| 23.50 | 15.32 | 36.04 | 6.89 | 3363 | 2.40e-15 | 3.44e-15 | 4.02e-16 | 3.89e-16 |
| 63.76 | 36.04 | 112.78 | 3.20 | 1289 | 1.78e-16 | 3.74e-16 | 6.31e-17 | 5.94e-17 |
| 130.07 | 112.78 | 150.00 | 0.49 | 145 | 2.48e-17 | 3.34e-16 | 5.62e-17 | 2.48e-17 |

| Near distance | ||
| [kpc] | [erg] | |
| 0.25 | 1.8 | |
| 0.5 | 5 | |
| 1.6 | 1 | |
| 2.6 | 3.3 | |
| 4 | 1.4 | |
| 5.1 | 0.5 | |
| 5.7 | 0.4 | |
| 6 | 0.2 |