Risk Ranked Recall: Collision Safety Metric for Object Detection Systems in Autonomous Vehicles
Abstract
Commonly used metrics for evaluation of object detection systems (precision, recall, mAP) do not give complete information about their suitability of use in safety critical tasks, like obstacle detection for collision avoidance in Autonomous Vehicles (AV). This work introduces the Risk Ranked Recall () metrics for object detection systems. The metrics categorize objects within three ranks. Ranks are assigned based on an objective cyber-physical model for the risk of collision. Recall is measured for each rank.
Index Terms:
Autonomous CPS, Dependable CPS, SafetyI Introduction
Obstacle detection is a safety critical perception requirement for AV. In recent times, there have been great improvements in deep learning based solutions for object detection. A result and catalyst of this phenomenal progress have been the real world datasets [1, 2, 3] used for development and evaluation of object detection systems. While plenty of AV datasets have been released, the metrics used with these datasets have not been tailored to the autonomous driving application. The commonly used metrics for evaluating object detection systems are precision and recall [4]. While these metrics work well for general applications, there remains a need for safety aware object detection metrics [5, 6]. To understand this need, let’s first consider the two basic metrics, Precision and Recall, used to evaluate the efficacy of an object detection system and apply them to a driving scenario.
| Precision | (1) | |||
| Recall | (2) |
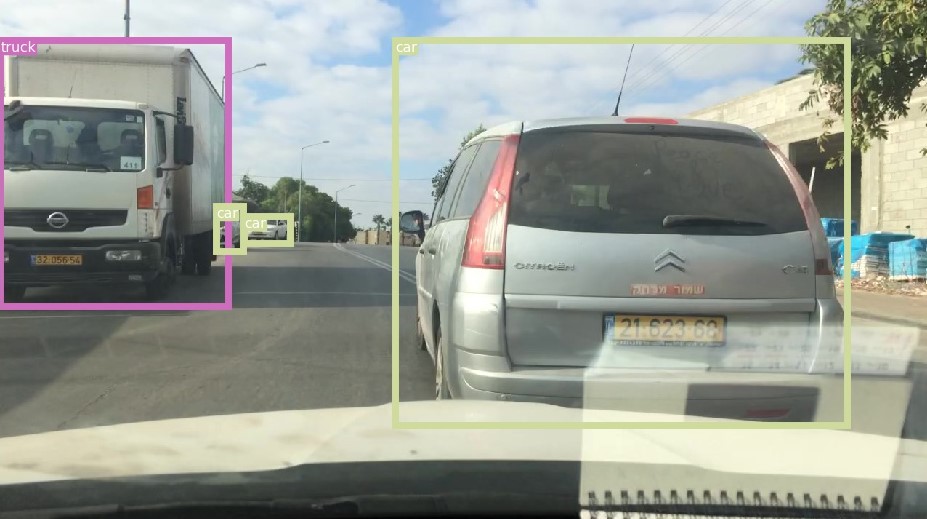
Figure 1 shows a front view image from the ego vehicle111Ego vehicle is the commonly used term for the first person vehicle., annotated with bounding boxes around all other visible vehicles. If an object detection system correctly detects exactly 2 () out of the 4 () objects in this image the Recall (Eq. 2) for this result is 0.5. This Recall value is independent of which 2 vehicles of the 4 were correctly detected. Intuitively, it is evident that at this time instance, being able to detect the car right in front and the truck coming down the opposite direction is far more important than the two cars further down. The ego vehicle, controlled by a human or autonomous agent, could end up in an unsafe situation quickly if the nearer car or truck are not detected. At this moment being unable to detect the two cars further away poses little to no risk.
This work introduces the metrics, a risk aware version of Recall. The risk rankings are based on the risk of collision (IV). Recall is measured for each rank separately.
-
•
: Recall for objects that pose an imminent risk of collision (IV-A).
-
•
: Recall for objects that can potentially collide with the ego vehicle (IV-B).
-
•
: All other objects in the environment.
By measuring the values separately, the metrics decouple and emphasise fulfillment of safety requirements. This work describes the safety aware Risk Ranked Recall metrics. Tools and examples from this work will be made available.222https://gitlab.engr.illinois.edu/rtesl/risk-ranked-recall
II related work
To the best of our knowledge there are no existing safety aware metrics for object detection based on an objective model. Datasets like KITTI [2] and Waymo Open Dataset [3] employ a notion of difficulty. However, difficulty is based on how difficult it is to detect objects, based on their size, truncation, occlusion or judgement of the groundtruth annotator. There is no consideration for the importance of detecting that object for continued safe operation of the ego vehicle.
Ohn-Bar and Trivedi’s object importance for driving is the closest related work [6]. They pioneered the notion of object importance in object detection. They asked human drivers to annotate the importance of objects in driving scenes and used the annotations to showcase the advantages of importance guided Deep Neural Network (DNN) training. There are key differences between their work and ours, primarily due to the differences in intended use. Their notion of importance is based upon what human drivers consider important while we focus on what obstacles can physically pose a risk of collision. For safety an approximate notion of importance is not reliable, thus we use an objective model (IV) for risk.
Neural networks to calculate the threat or risk of different scenes have also been explored [7, 8]. The main feature is that these DNN can estimate the risk of a situation based on visual input. They could hence be used for online threat assessment to aid path planning. However, the approximate nature of these methods makes them unsuitable for our use case. They are also currently limited to predict the risk posed by a scene and not individual objects.
An alternate approach exists to the objective model proposed in this work for assigning risk ranks to objects. Objects can be prioritized by measuring the impact of an object on planning decisions [9]. While the technique works well for real time agent prioritization, we argue that the model proposed in this work is superior for safety critical evaluations. First, it does not include any potential bias from specific planning algorithms. And second, our model considers only safety requirements i.e. collision avoidance while the planner based simulations can implicitly conflate mission requirements with safety requirements.
III Design Choices
Before presenting the risk model, we first lay out the design choices and corresponding reasoning.
Time Horizon: The analysis need to be time limited because given infinite time any two independent objects can have the potential to collide. Emergency stop is considered an acceptable emergency response for AV [10]. Hence, a time horizon equal to Time To Stop (TTS) of the ego vehicle is used to limit the risk analysis (Eq. 4).
True Positives: Standard object detection evaluations use an Intersection over Union () threshold to match predictions to groundtruth bounding boxes. For we use a threshold on the percentage of groundtruth bounding boxes covered by the predicted object bounding boxes (BB) i.e. Intersection over Groundtruth (). Figure 2 compares to .
| (3) |
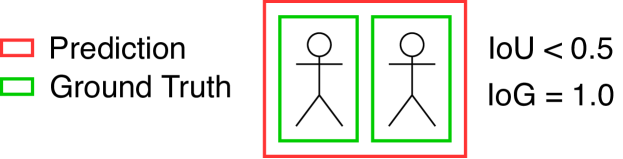
Truncation and Occlusion: Further from Figure 2, distinguishing between different objects and detecting heavily occluded objects does not give an advantage for safety considerations, as long as the predicted bounding boxes cover the objects that exist. This is implicitly addressed by using to determine true positives.
Object Classes: Detection of object class is not minimally required for collision avoidance as long as the object’s existence is detected and worst case for its potential for motion is considered while calculating collision risk. Collisions with any object in the AV’s path, even of unknown classification, should be avoided. Hence metrics do not consider object class when determining True Positives. We do not wish to convey that classification does not have any significance. Object classes are important to determine for many path planning tasks in an AV, however purely for obstacle detection, classification is not a requirement. However, ground truth labels can still be filtered to limit the analysis to certain classes only. In Section V Pedestrians, Cycles, Vehicles and Road Signs are considered.
Type of Object Detection System: In this work we heavily focus on using for the evaluation of vision-based object detection DNN but the metrics can be utilized to evaluate any system which ultimately detects the existence and location of objects around a vehicle.
The design choices above stem from the focus on collision avoidance. cannot be used in isolation to fully compare object detection systems. For example, Precision (Eq. 1) is an important metric for the performance of the object detection system. An object detection system with high but low precision may see obstacles where none exist, this could severely limit the driving performance of the vehicle even making it impossible to drive, however, it is still safe. does not aim to replace the existing metrics rather adds additional information emphasising safety.
IV Risk Ranking
The category of collision risk is determined by using ego vehicle and object state. The metrics are meant to be used with autonomous driving datasets. Each input frame of the dataset is analyzed independently with the time instance of the current frame as . are the position vectors of the center of the ego vehicle and object at a time respectively. Similarly, and are the velocity vectors and and are the headings at time . The maximum possible acceleration or deceleration magnitude is used in rest of this work, as prescribed by prior works in literature [11, 12].
is the compute latency from the sensor input to the actuation command. The latency is a property of the autonomous driving hardware and software. Using the sample rate of the Waymo Open Dataset we use in Section V. is the time to stop for the ego vehicle from the frame input to a complete stop assuming the actuation decision was made to emergency brake. The time interval for the potential collision analysis is hence [, ] repeated in discrete time step increments . A small value approximates continuous analysis.
| (4) |
is the maximum distance between the centers of the ego vehicle and the object, such that their surfaces touch at at least one point without causing any deformation of the surface. All possible rotations of the vehicles are considered in determining , adhering to the principle of considering worst case possibilities.
IV-A Imminent Collision
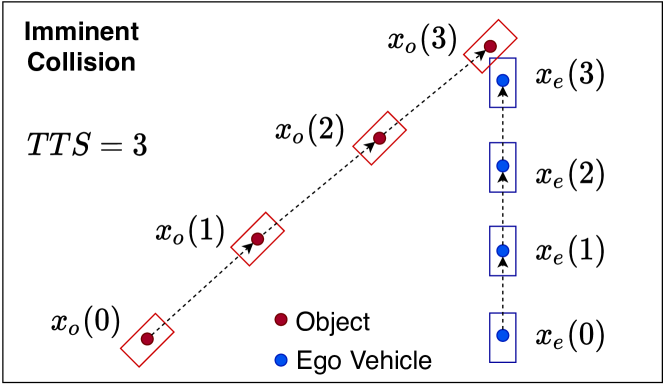
To determine risk of imminent collision, i.e. a collision that will happen if no action is taken by the ego vehicle or the object, the trajectories of both are generated within the time horizon. , , and are considered constant and initial value at are taken from the dataset labels. If at any time, in increments, the bounding box representing ego vehicle and the object overlap, the object is ranked to pose a risk of imminent collision. This process is represented in Figure 3 with and .
IV-B Potential Collision
Schmidt et al. [13] introduced the concept of existence region of an object at a particular time , defined as the set of all possible positions of the center point at a time and extended this existence region into the future via a propagation method. Given initial and , existence regions at time is simply a circle of radius centered at . We derive the existence regions for both the ego vehicle and objects within . The minimum distance between and at time is denoted as . If at any timestep , the object is considered to pose a risk of potential collision as shown in Figure 4.

V Usage
This section shows sample usage of metrics using three pre-trained 2D object detection networks: YOLOv3[14, 15], Faster R-CNN and Mask R-CNN [16]. Front camera images and labels are taken from 24 sequences of Waymo Open Dataset [3]. Of the total 27973 labeled objects in these sequences, 952 are identified to pose a Potential risk of collision. However no objects are identified to pose a risk of an Imminent collision. This is an expected limitation of real world datasets and motivates the need for synthetic datasets that can include imminently unsafe situations [17, 18]. Fig. 5 shows the and Recall values for different networks and input image resolutions (320 pixels, 416 pixels, 608 pixels).
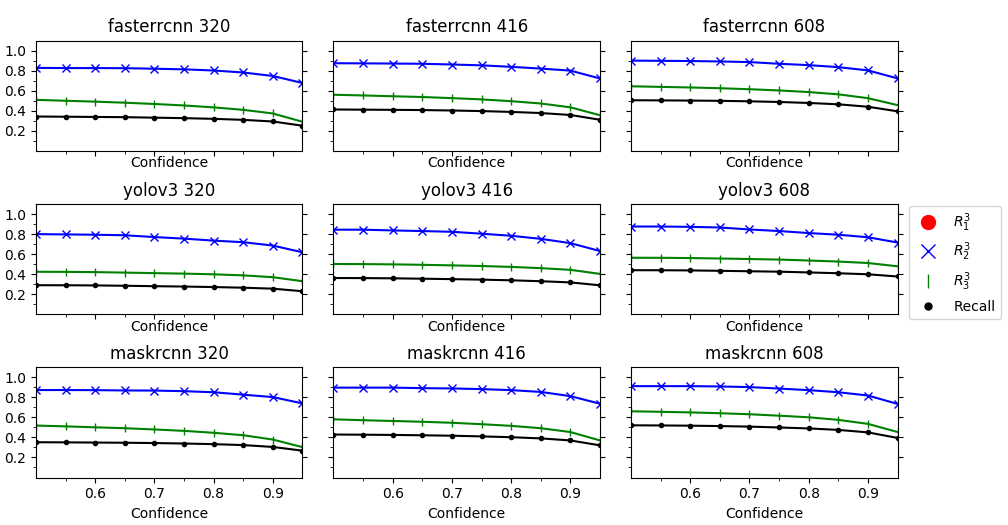
Discussion: Collision risk and detection difficulty correlate with distance between the ego vehicle and the object. Farther objects pose lower risk of collision (IV). Similar correlation was observed in importance annotations by human drivers [6]. Farther objects are smaller and hence more difficult to detect in images, as also assumed in KITTI 2D object detection difficulty categories. Hence in Figure 5 we see that metrics and recall show different offsets but the same trend through varying confidence limits. Despite this apparent limitation, metrics emphasise safety critical False Negatives.
From Fig. 5 we also note that for varying resolutions of input images, Recall values see a larger difference than . Smaller input sizes also come with lower computational load and latency e.g. YOLOv3-320 has only 28% flops and 44% latency of YOLOv3-608 as demonstrated by Redmon and Farhadi [14]. This motivates the addition of low input resolution DNN to AV safety critical perception pipeline similar to mixed frequency networks proposed by Tesla Inc. [19].
VI conclusion and future work
In this work metrics for object detection in autonomous vehicles are presented. The usage examples for show the difference in information provided by the new metrics. Further work is required to establish the efficacy of the metric in influencing design decisions for perception systems for AV including sensor fusion and tracking. Another direction requiring further exploration is utilizing the metrics for redesigning the loss functions for training object detection DNN. This is non trivial as the loss function must also consider precision and recall. Finally, synthetic datasets that incorporate unsafe situations need to be incorporated. While this paper presents the first step i.e. the metric formulation, with the above addressed the metrics can truly serve object detection researchers by providing valuable information about the performance of their solutions in safety critical applications.
Acknowledgment
The material presented in this paper is based upon work supported by the Office of Naval Research (ONR) under grant number N00014-17-1-2783 and by the National Science Foundation (NSF) under grant numbers CNS 1646383, CNS 1932529 and CNS 1815891. Marco Caccamo was also supported by an Alexander von Humboldt Professorship endowed by the German Federal Ministry of Education and Research. Any opinions, findings, and conclusions or recommendations expressed in this publication are those of the authors and do not necessarily reflect the views of the sponsors.
References
- [1] F. Yu, W. Xian, Y. Chen, F. Liu, M. Liao, V. Madhavan, and T. Darrell, “Bdd100k: A diverse driving video database with scalable annotation tooling,” arXiv preprint arXiv:1805.04687, 2018.
- [2] A. Geiger, P. Lenz, and R. Urtasun, “Are we ready for autonomous driving? the kitti vision benchmark suite,” in 2012 IEEE Conference on Computer Vision and Pattern Recognition. IEEE, 2012, pp. 3354–3361.
- [3] P. Sun, H. Kretzschmar, X. Dotiwalla, A. Chouard, V. Patnaik, P. Tsui, J. Guo, Y. Zhou, Y. Chai, B. Caine, V. Vasudevan, W. Han, J. Ngiam, H. Zhao, A. Timofeev, S. Ettinger, M. Krivokon, A. Gao, A. Joshi, Y. Zhang, J. Shlens, Z. Chen, and D. Anguelov, “Scalability in perception for autonomous driving: Waymo open dataset,” 2019.
- [4] M. Buckland and F. Gey, “The relationship between recall and precision,” Journal of the American society for information science, vol. 45, no. 1, pp. 12–19, 1994.
- [5] E. Arnold, O. Y. Al-Jarrah, M. Dianati, S. Fallah, D. Oxtoby, and A. Mouzakitis, “A survey on 3d object detection methods for autonomous driving applications,” IEEE Transactions on Intelligent Transportation Systems, vol. 20, no. 10, pp. 3782–3795, Oct 2019.
- [6] E. Ohn-Bar and M. M. Trivedi, “Are all objects equal? deep spatio-temporal importance prediction in driving videos,” Pattern Recognition, vol. 64, pp. 425–436, 2017.
- [7] Y. Wang and J. Kato, “Collision risk rating of traffic scene from dashboard cameras,” in 2017 International Conference on Digital Image Computing: Techniques and Applications (DICTA). IEEE, 2017, pp. 1–6.
- [8] P. Feth, M. N. Akram, R. Schuster, and O. Wasenmüller, “Dynamic risk assessment for vehicles of higher automation levels by deep learning,” in International Conference on Computer Safety, Reliability, and Security. Springer, 2018, pp. 535–547.
- [9] K. S. Refaat, K. Ding, N. Ponomareva, and S. Ross, “Agent prioritization for autonomous navigation,” arXiv preprint arXiv:1909.08792, 2019.
- [10] B. Meder, N. Fleischhut, N.-C. Krumnau, and M. R. Waldmann, “How should autonomous cars drive? a preference for defaults in moral judgments under risk and uncertainty,” Risk analysis, vol. 39, no. 2, pp. 295–314, 2019.
- [11] Z. Wu, Y. Liu, and G. Pan, “A smart car control model for brake comfort based on car following,” IEEE transactions on intelligent transportation systems, vol. 10, no. 1, pp. 42–46, 2008.
- [12] H. Saptoadi, “Suitable deceleration rates for environmental friendly city driving,” International Journal of Research in Chemical, Metallurgical and Civil Engineering, vol. 4, no. 1, pp. 2–5, 2017.
- [13] C. Schmidt, F. Oechsle, and W. Branz, “Research on trajectory planning in emergency situations with multiple objects,” in 2006 IEEE Intelligent Transportation Systems Conference, 2006, pp. 988–992.
- [14] J. Redmon and A. Farhadi, “Yolov3: An incremental improvement,” arXiv, 2018.
- [15] cfotache, “PyTorch Object Detect Track,” https://github.com/cfotache/pytorch_objectdetecttrack, 2019.
- [16] PyTorch, “Torchvision,” https://pytorch.org/docs/stable/torchvision/models.html, 2019.
- [17] H. Kim, K. Lee, G. Hwang, and C. Suh, “Crash to not crash: Learn to identify dangerous vehicles using a simulator,” in Proceedings of the AAAI Conference on Artificial Intelligence, vol. 33, 2019, pp. 978–985.
- [18] K. K. Patel, “A simulation environment with reduced reality gap for testing autonomous vehicles,” Ph.D. dissertation, University of Windsor (Canada), 2020.
- [19] A. Shen, “Machine learning models operating at different frequencies for autonomous vehicles,” June 2020. [Online]. Available: https://www.freepatentsonline.com/y2020/0175401.html