RewardsOfSum: Exploring Reinforcement Learning Rewards
for Summarisation
Abstract
To date, most abstractive summarisation models have relied on variants of the negative log-likelihood (NLL) as their training objective. In some cases, reinforcement learning has been added to train the models with an objective that is closer to their evaluation measures (e.g. ROUGE). However, the reward function to be used within the reinforcement learning approach can play a key role for performance and is still partially unexplored. For this reason, in this paper, we propose two reward functions for the task of abstractive summarisation: the first function, referred to as RwB-Hinge, dynamically selects the samples for the gradient update. The second function, nicknamed RISK, leverages a small pool of strong candidates to inform the reward. In the experiments, we probe the proposed approach by fine-tuning an NLL pre-trained model over nine summarisation datasets of diverse size and nature. The experimental results show a consistent improvement over the negative log-likelihood baselines.
1 Introduction
The current state-of-the-art neural text summarisation models have been refined to excel at either the extractive or abstractive styles, or even both (Zhang et al., 2020a; Lewis et al., 2020; Raffel et al., 2020). Along with contemporary summarisation datasets (Narayan et al., 2018a; Grusky et al., 2018; Fabbri et al., 2019), the advent of large pre-trained language models, and their subsequent derivations (Liu and Lapata, 2019; Park, 2020), has allowed summarisation to become a more practical and reasonable task to implement, without compromising, and often improving, the accuracy. However, these models usually employ the standard negative log-likelihood (NLL) as their training objective, which aims to maximise the likelihood of each token in a given ground-truth reference. Despite its efficacy, the NLL fails to account for synonymous tokens and other potentially valid variations, and strongly biases the model towards the ground-truth reference (Ranzato et al., 2016). Furthermore, the NLL operates as a token-level objective during training, which promotes an inconsistent comparison with sequence-level evaluation metrics, such as ROUGE (Lin, 2004).
In order to address the inconsistency between token-level training and sequence-level evaluation, reinforcement learning (RL) has been adopted in summarisation and other language generation tasks to afford the optimization of sequence-level metrics during training (Paulus et al., 2018; Pasunuru and Bansal, 2018). Reinforcement learning has proved successful at improving the accuracy of language generation tasks, such as summarisation (Paulus et al., 2018; Arumae and Liu, 2018; Pasunuru and Bansal, 2018) and machine translation (Ranzato et al., 2016; Edunov et al., 2018). However, balancing exploration and exploitation remains imperative to the successful choice of an effective reward. When standard RL techniques, such as REINFORCE (Williams, 1992), are implemented in natural language generation tasks, the required expectation becomes intractable due to large vocabulary sizes. Therefore, the application of REINFORCE is typically reduced to calculating the approximate expectation with respect to only a single predicted sequence. To teach the model to understand the importance of sample variation among synonymous tokens, we instead choose to implement an objective function which includes multiple predicted sequences, allowing for a scenario in which several valid candidate summaries can be considered. Another consideration is that the success of techniques such as REINFORCE strongly depends on the use of an effective and appropriate reward. Designing such a reward, one which enables the model to manipulate multiple sequences and yet provides a positive and informative outcome in the process, is therefore necessary for producing better results. This allows us to modify the reinforcement learning framework in such a way that enforces only a higher weighting to those predicted sequences which obtain a higher reward. As such, we apply two techniques to summarisation; RwB-Hinge, which applies a hinge-loss modification to the classical REINFORCE with baseline (Rennie et al., 2017) to selectively apply the model gradients, and Expected Risk Minimization (RISK) (Edunov et al., 2018), which leverages a small pool of strong sampled candidates to smartly inform the reward function. We aptly refer to our framework as RewardsOfSum, to hint at the exploration of suitable reward functions for summarisation. Empirically, we show that the two proposed variants perform better than standard negative log-likelihood baselines over a range of datasets of diverse size and nature.
2 Related Work
In recent years, there has been some work in summarisation to separate from the traditional negative log-likelihood (NLL) objective function, and mollify its dependency on ground-truth references. Several implementations of reinforcement learning in summarisation involved optimizing discrete metrics, such as the standard ROUGE (Paulus et al., 2018; Narayan et al., 2018b). Others have introduced novel rewards into the reinforcement learning framework, such as question-focused rewards (Arumae and Liu, 2018), saliency and entailment rewards (Pasunuru and Bansal, 2018), and even distributional semantic rewards (Li et al., 2019). Gao et al. (2020) also present a novel unsupervised metric for summarisation which correlates highly with discrete evaluation metrics if adopted in a reinforcement learning approach.
On the other hand, there has been much work in leveraging large, pre-trained language models (LM) (Devlin et al., 2019; Lewis et al., 2020; Raffel et al., 2020) to improve the quality and performance of summarisation models. Utilizing pre-trained language models requires significantly less engineering effort to continually improve over state-of-the-art baselines. Typically, these approaches include using novel pre-training objectives (Zhang et al., 2020a; Raffel et al., 2020; Zhu et al., 2020) or implementing successful reinforcement learning techniques (Bae et al., 2019). Li et al. (2019) found that optimizing semantic rewards in reinforcement learning, using BERTScore (Zhang et al., 2020b), does not necessarily correlate with the ROUGE score at test time. As such, the choice of reward in a reinforcement learning approach should attempt to carefully align with the evaluation metric.
How best to inform the reward via the reward function, is critical to the performance of models in an RL framework. In our work, we aim to stray from the typical sole NLL objective, and by leveraging a pre-trained language model in a reinforcement learning framework, explore different RL-based reward functions for summarisation.
3 Proposed Reinforcement Learning Training
In order to improve over the negative log-likelihood baseline models, we aim to implement a reinforcement learning framework that adopts the standard evaluation metric, ROUGE, as a reward during training. We aim to keep consistent with previous implementations of reinforcement learning in summarisation, and assume ROUGE-L F1 to be the reward metric in the following work.
In Sections 3.1 and 3.2, we consider the following standard notations: is defined as an input source document, , , and are referred to as the ground-truth reference, argmax prediction, and sampled sequence, respectively, and refers to the reward of sequence , computed with respect to the ground-truth reference, . By exploiting a combination of sampling and predictions, we aim to enhance training diversity in the vein of the work of Li and Jurafsky (2016); Li et al. (2016); Holtzman et al. (2020).
3.1 RwB-Hinge
We adopt the standard self-critical policy gradient objective (Rennie et al., 2017), notably applied to summarisation by Paulus et al. (2018):
| (1) |
| (2) |
In (1), and denote a sampled sequence and the argmax prediction of the current model, respectively. The reward of the argmax, , is used as a “baseline” for the reward of the sample, . It is easy to see that if , the sign of this loss is negative, treating as a “good” prediction and leading to an increase of its probability. Conversely, if the sign is positive, is deemed as a “bad” prediction and its probability is decreased.
However, in abstractive summarisation it is not trivial to discriminate between a good and a bad summary when the reward score is in an intermediate range. To avoid inappropriately penalising acceptable predictions, we propose incorporating a hinge loss in (1):
| (3) |
The hinge loss allows the model to limit the gradient updates to only the predictions that are considered as good. In this way, we avoid the risk of unstable training updates and hope to afford a clearer trajectory towards a well-trained model.
3.2 Expected RISK Minimization
We also utilise a classical structured loss function that has been shown to perform well in sequence-to-sequence learning tasks (Edunov et al., 2018):
| (4) |
In (4), represents one of multiple candidate summaries, sampled or predicted with the methods defined in Section 4.2 (e.g. argmax, Gumbel-Softmax (Jang et al., 2017)), that form the total candidate summary set . The conditional probability of the predicted summary is noted as .
This conditional probability is defined in (5), where is the number of tokens in the summary. The sum of logarithms in (6) is divided by the total number of tokens in the sequence, and is scaled back using an exponential function, allowing each candidate summary to be compared fairly in the objective function and avoiding underflow.
| (5) |
| (6) |
| (7) |
By using this objective function, the model is taught to assign higher probability to the candidate summaries that obtain higher rewards. This objective does not require a baseline or hinge loss to select the predictions, since using multiple candidates already exposes the model to different, potentially valid predictions. Edunov et al. (2018) demonstrates the effectiveness of this approach at sentence level for both neural machine translation and summarisation. For the summarisation task, Edunov et al. (2018) compute the reward at sentence-level since their dataset has single-sentence references. However, as the reward function is agnostic to single or multi-sentence predictions, we can easily translate the RISK objective function to be used at summary level.
3.3 Overall Training Objective
Similar to previous reinforcement learning implementations (Paulus et al., 2018; Li et al., 2019), we, too, utilise a mixed learning objective function, as shown in (8). This mixed approach helps the model to not deviate too much from the reference summaries, given a balancing coefficient chosen with a strict validation criterion (Appendix A). The term refers to either the RwB-Hinge or RISK training objective function.
| (8) |
4 Experimental Setup
4.1 Datasets
Inspired by the recent work from Zhang et al. (2020a), we utilise nine of the summarisation datasets reported in their paper. The nine datasets have been chosen based on the different lengths of their reference summaries, to provide enough of a variation to demonstrate the applicability of the presented methods. We split the datasets into three classes: “short”, “medium”, and “long”. Short datasets have reference summaries 64 tokens, medium datasets 64 and 128 tokens, and long datasets 128 tokens.
| Dataset | Train | Test | Dev |
|---|---|---|---|
| AESLC | 14.4K | 1.9K | 1.9K |
| Gigaword | 3.8M | 1.9K | 189K |
| XSum | 203K | 11.3K | 11.3K |
| CNN/DM | 287K | 11.4K | 13.3K |
| Reddit-TIFU | 33.7K | 4.2K | 4.2K |
| Newsroom | 995K | 108K | 108K |
| Pubmed | 119K | 6.6K | 6.6K |
| ArXiv | 203K | 6.4K | 6.4K |
| Billsum | 18.9K | 3.2K | 1.2K |
4.2 Sampling Methods
In order to promote exploration across the vocabulary distribution, we employ three simple methodologies to provide candidate sequences for our training objectives.
Argmax: As is the standard with the majority of sequence generation tasks, a predicted sentence can be easily provided by allowing the model to make hard decisions (e.g. argmax) over the probability distribution generated by the decoder. This allows us to use it as a baseline for the following experiments. In its simplest form the argmax is defined as:
| (9) |
where we use “teacher forcing” for the predictions.
2nd-Best: Similar to the argmax, we employ a -best approach to sample the second best-argmax from the same probability distribution generated by the decoder. This allows us to choose different, yet similarly weighted words from the decoder to introduce variability between produced summaries:
| (10) |
Gumbel-Softmax: We also utilise a recent re-parameterization technique known as the Gumbel-Softmax (Jang et al., 2017) that allows sampling soft latent categorical variables by transforming samples from a Gumbel distribution. Compared to the standard “hard” predictions, this approach is differentiable and allows controlling the sparsity of the samples by a temperature parameter, :
| (11) |
In (11), is a sample from the zero-mean, unit-scale Gumbel distribution, is the probability distribution for a given token at slot , and the temperature parameter, , controls the sparsity of the output soft variable, . In our experiments, we have set to 0.1 to enforce sparsity.
4.3 Baseline Model and Training Runs
The abstractive text summarisation model we use for our experiments is PEGASUS, a large pre-trained Transformer encoder-decoder architecture that has recently reported state-of-the-art results over a number of datasets. Please refer to Zhang et al. (2020a) for details. All hyperparameters used in our experiments can be found in Appendix B.
We employ two training approaches to test the solidity of the proposed methods. The first is a few-shot learning approach that adopts limited, fixed numbers of training samples (1000) and training iterations (2000) for fine-tuning the model. The second is a full-data learning approach, that utilises all available training data, and exhausts the objective function until convergence over the validation set. In all experiments, we first fine-tune a pre-trained PEGASUS model with the NLL, and then we further fine-tune the NLL model with one of the proposed approaches. We train the model in this way to avoid the slow and inefficient training often associated with policy gradient objectives, and as a result, adhere to the standard warm-start NLL training adopted in previous reinforcement learning-based approaches (Paulus et al., 2018; Li et al., 2019).
In the following experiments, we refer to PEGASUS as PEG, and its NLL-tuned models with the suffixes -few_shot and -full_data. The proposed approaches are in turn noted as RwB-Hinge and RISK.
| Experiment | Arg-max | 2nd-Best | G-S |
|---|---|---|---|
| RwB-Hinge | ✓ | ✓ | |
| RISK-2 | ✓ | ✓ | |
| RISK-3 | ✓ | ✓ | ✓ |
| Model | AESLC | Gigaword | XSum | ||||||
|---|---|---|---|---|---|---|---|---|---|
| R-1 | R-2 | R-L | R-1 | R-2 | R-L | R-1 | R-2 | R-L | |
| PEG | 29.96 | 14.54 | 29.17 | 31.81 | 13.19 | 29.12 | 41.81 | 18.32 | 33.50 |
| \hdashline+ RwB-Hinge | 28.69 | 13.83 | 27.82 | 31.83 | 13.15 | 29.08 | 42.47† | 18.82† | 33.94 |
| + RISK-2 | 29.35 | 14.14 | 28.39 | 31.96 | 13.22 | 29.27 | 42.57† | 18.71† | 33.96† |
| + RISK-3 | 29.28 | 14.05 | 28.31 | 32.10† | 13.35† | 29.43† | 42.66† | 19.01† | 34.15† |
| PEG | 32.63 | 15.84 | 32.19 | 33.81 | 14.26 | 30.89 | 41.52 | 18.21 | 33.31 |
| \hdashline+ RwB-Hinge | 34.39† | 17.58† | 33.71† | 34.10† | 14.52 | 31.31† | 42.87† | 19.36 | 34.56† |
| + RISK-2 | 33.55† | 17.01† | 32.91† | 33.97 | 14.45 | 31.18† | 42.93† | 19.25† | 34.67† |
| + RISK-3 | 33.75† | 17.03† | 33.04† | 33.97 | 14.52 | 31.14† | 42.74† | 19.23† | 34.60† |
| Model | CNN/DM | Reddit-TIFU | Newsroom | ||||||
|---|---|---|---|---|---|---|---|---|---|
| R-1 | R-2 | R-L | R-1 | R-2 | R-L | R-1 | R-2 | R-L | |
| PEG | 40.65 | 17.60 | 37.81 | 24.84 | 7.21 | 20.12 | 33.33 | 20.01 | 29.17 |
| \hdashline+ RwB-Hinge | 40.44 | 17.44 | 37.54 | 25.55† | 7.23 | 20.09 | 34.03† | 20.74† | 29.86† |
| + RISK-2 | 40.52 | 17.48 | 37.62 | 25.69† | 7.25 | 20.26 | 34.26† | 21.10† | 30.14† |
| + RISK-3 | 40.76 | 17.63 | 37.87 | 25.73† | 7.30 | 20.35 | 34.40† | 21.27† | 30.21† |
| PEG | 40.58 | 18.15 | 37.94 | 23.66 | 6.72 | 19.24 | 36.39 | 23.90 | 32.50 |
| \hdashline+ RwB-Hinge | 40.84† | 17.74 | 38.19† | 23.95† | 6.93 | 19.69† | 36.85† | 24.01 | 33.00† |
| + RISK-2 | 40.88† | 17.91 | 38.19† | 24.25† | 7.19† | 20.00† | 36.74 | 24.01 | 32.73 |
| + RISK-3 | 40.88† | 17.91 | 38.28† | 24.70† | 7.46† | 20.25† | 36.04 | 23.22 | 32.18 |
| Model | Pubmed | ArXiv | Billsum | ||||||
|---|---|---|---|---|---|---|---|---|---|
| R-1 | R-2 | R-L | R-1 | R-2 | R-L | R-1 | R-2 | R-L | |
| PEG | 38.28 | 13.70 | 23.32 | 38.08 | 11.61 | 22.87 | 48.27 | 27.79 | 35.70 |
| \hdashline+ RwB-Hinge | 40.11† | 14.45† | 23.88† | 38.85† | 11.90† | 22.88 | 48.61† | 29.35† | 36.91† |
| + RISK-2 | 40.19† | 14.61† | 23.98† | 38.98† | 12.02† | 22.90 | 48.21 | 28.34† | 35.97 |
| + RISK-3 | 40.19† | 14.55† | 23.95† | 38.68† | 11.88† | 22.81 | 48.65 | 28.71† | 36.37† |
| PEG | 40.57 | 16.05 | 25.46 | 38.48 | 13.33 | 24.12 | 52.98 | 34.44 | 41.36 |
| \hdashline+ RwB-Hinge | 40.80 | 16.27 | 25.41 | 38.95† | 13.69† | 24.19 | 54.30† | 36.01† | 42.76† |
| + RISK-2 | 40.32 | 15.85 | 25.31 | 38.76 | 13.55 | 24.11 | 53.76† | 35.54† | 42.37† |
| + RISK-3 | 40.36 | 15.89 | 25.26 | 38.42 | 13.37 | 24.12 | 54.27† | 35.80† | 42.51† |

5 Results
Tables 3, 4, and 5 show the results of each method in comparison to the NLL-tuned baseline for the nine reported datasets. Each table reports the few-shot (top halves) and full-data results (bottom halves), where the scores have been averaged over three independently-initialised training runs. Each fine-tuning method is employed in a mixed loss framework, as mentioned in (8) in Section 3.3; the value for the hyperparameter has been determined over the validation set as described in Appendix A. The results show that all the fine-tuning methods have surpassed the NLL baselines for almost all datasets. Several of these improvements have also passed a bootstrap test for statistical significance, which is regarded as a more appropriate statistical test for summarisation compared to a -test (Dror et al., 2018).
Figure 1 compares the effect that each fine-tuning method has had over the production of novel n-grams during test time (a property nicknamed as n-gram novelty). For medium sized datasets in particular, the reinforcement learning approaches appear to, on average, facilitate the production of more distinct uni-, bi-, and tri-grams at test time, compared to the NLL baseline. Whilst n-gram novelty is typically used in summarisation to showcase test-time summary abstractiveness, the results in Figure 1 highlight that training with objectives that promote sample variation leads to models capable of producing more novel n-grams (up to 13.8 pp in tri-gram novelty over CNN/DM). This is supported by the qualitative example in Table 6 which shows that the proposed fine-tuning methods can achieve greater diversity of summary predictions, whilst still improving over the baseline NLL ROUGE scores. It seems that the proposed fine-tuning methods have allowed the model to effectively weigh the predicted summaries during training, and when combined with the “stable” NLL in a mixed-loss approach, this has been able to produce well-rounded predictions, diverse enough to stray from the original baseline and the reference summaries.
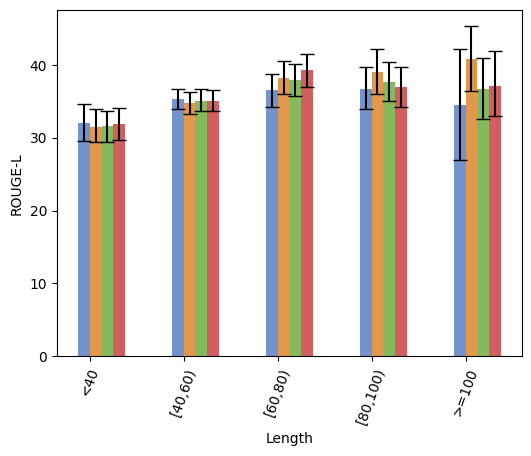
In addition, Figure 2 shows a performance comparison with respect to the length of the reference summaries for the full-data approach over a medium size dataset (CNN/DM). We see that our fine-tuning methods have led, on average, to higher ROUGE-L scores for the longer summaries (up to 2.3 ROUGE-L points for summaries between 80-100 tokens, and up to 6.2 points for summaries over 100 tokens). Likely, the proposed methods have been able to amend the reported tendency of the NLL models to curtail the prediction of long summaries.
| Source Document |
|---|
| Dougie Freedman is on the verge of agreeing a new two-year deal to remain at Nottingham Forest. Freedman has stabilised Forest since he replaced cult hero Stuart Pearce and the club’s owners are pleased with the job he has done at the City Ground. Dougie Freedman is set to sign a new deal at Nottingham Forest. Freedman has impressed at the City Ground since replacing Stuart Pearce in February. They made an audacious attempt on the play-off places when Freedman replaced Pearce but have tailed off in recent weeks. That has not prevented Forest’s ownership making moves to secure Freedman on a contract for the next two seasons. |
| Reference |
| Nottingham Forest are close to extending Dougie Freedman’s contract. The Forest boss took over from former manager Stuart Pearce in February. Freedman has since lead the club to ninth in the Championship. |
| NLL (40.00/30.43/32.85) |
| Dougie Freedman set to sign new deal at Nottingham Forest. Freedman has stabilised Forest since he replaced Stuart Pearce. Forest’s owners are pleased with Freedman’s job. |
| RwB-Hinge (49.00/36.24/34.43) |
| Dougie Freedman is set to sign a new two-year deal at Nottingham Forest. The City Ground boss has stabilised the club since he replaced Stuart Pearce. Forest’s owners are pleased with Freedman’s job at the club. |
| RISK-2 (50.66/44.59/44.00) |
| Dougie Freedman set to sign a new two-year deal at Nottingham Forest. Freedman has stabilised Forest since he replaced Stuart Pearce in February. Forest made an audacious attempt at the play-off places when Freedman replaced Pearce. |
| RISK-3 (49.33/40.54/40.00) |
| Dougie Freedman set to sign new deal at Nottingham Forest. Freedman has stabilised the club since he replaced Stuart Pearce in February. The club’s owners are pleased with the job Freedman has done at the City Ground. |
| Dataset | Approach | RwB-Hinge | RISK-2 | RISK-3 |
| XSum (short) | Few-Shot | 43.90/20.18/35.59 | 44.03/20.28/35.75 | 43.80/20.30/35.76 |
| Full-Data | 42.97/19.45/34.73 | 42.92/19.53/34.73 | 43.23/19.25/35.06 | |
| Newsroom (medium) | Few-Shot | 35.47/22.31/31.11 | 36.20/23.11/31.81 | 35.96/22.87/31.62 |
| Full-Data | 38.17/25.37/34.12 | 37.02/24.36/33.21 | 37.08/25.11/33.22 | |
| Billsum (long) | Few-Shot | 49.08/29.96/37.63 | 48.19/28.84/36.68 | 49.23/29.62/37.06 |
| Full-Data | 54.48/36.49/43.43 | 53.51/35.24/42.49 | 54.10/35.39/42.50 |
| Dataset | RwB: No Hinge-Loss | RwB: with Hinge-Loss |
|---|---|---|
| XSum (short) | 42.82/19.32/34.43 | 42.97/19.45/34.73 |
| Newsroom (medium) | 38.97/26.38/35.00 | 38.17/25.37/34.12 |
| Billsum (long) | 53.04/34.87/42.14 | 54.48/36.49/43.43 |
Comparing multiple fine-tuning methods is useful for showcasing the improvements that reinforcement learning can play on a generation task like summarisation. However, no single method has outperformed all others over all the datasets and in both the few-shot and full-data approaches. Whilst all methods have achieved interesting improvements over the baseline figures, we have run a comparison over the validation set to see if their relative rankings could be a reliable indicator of the relative rankings of the test set scores reported in Tables 3, 4, and 5. Table 7 shows the results for one dataset per class size, showing that for the short and medium size datasets ( 128 tokens), either of the RISK methods could be chosen to fine-tune the model. This contrasts to the longer datasets where the hinge-loss modification has achieved the best results. In both cases, the results are in good agreement with those on the test sets.
Lastly, in Table 8, we further validate our use of the hinge-loss adaptation to the classical REINFORCE with baseline method – a staple in the reinforcement learning literature of language generation tasks (Paulus et al., 2018). Over the same three datasets of Table 7, we see that in the majority of instances the hinge-loss modification has been distinctively better than the standard approach. This confirms our intuition that the adoption of a hinge loss to restrict the gradient updates to “good” predictions only is beneficial to the improvement of ROUGE scores.
6 Conclusion
In this paper, we have proposed two variants to the reinforcement learning approaches typically used in sequence-to-sequence learning tasks. The two proposed approaches – nicknamed RwB-Hinge and RISK – have been designed to improve the reinforcement learning rewards by selecting and diversifying the predictions used during the fine-tuning of the model. In a set of automated summarisation experiments over nine, diverse datasets, the approaches have consistently led to improved performance, and also diversified the generated summaries. We note that, despite its commonplace use for summarisation evaluation, utilizing ROUGE as reinforcement learning reward does not easily translate into improved performance. For this reason, in the near future we plan to explore other contemporary score functions, such as BERTScore (Zhang et al., 2020b), in an attempt to build more effective rewards.
References
- Arumae and Liu (2018) Kristjan Arumae and Fei Liu. 2018. Reinforced extractive summarization with question-focused rewards. In Proceedings of ACL 2018, Student Research Workshop, pages 105–111, Melbourne, Australia. Association for Computational Linguistics.
- Bae et al. (2019) Sanghwan Bae, Taeuk Kim, Jihoon Kim, and Sang-goo Lee. 2019. Summary level training of sentence rewriting for abstractive summarization. In Proceedings of the 2nd Workshop on New Frontiers in Summarization, pages 10–20, Hong Kong, China. Association for Computational Linguistics.
- Devlin et al. (2019) Jacob Devlin, Ming-Wei Chang, Kenton Lee, and Kristina Toutanova. 2019. BERT: Pre-training of deep bidirectional transformers for language understanding. In Proceedings of the 2019 Conference of the North American Chapter of the Association for Computational Linguistics: Human Language Technologies, Volume 1 (Long and Short Papers), pages 4171–4186, Minneapolis, Minnesota. Association for Computational Linguistics.
- Dror et al. (2018) Rotem Dror, Gili Baumer, Segev Shlomov, and Roi Reichart. 2018. The hitchhiker’s guide to testing statistical significance in natural language processing. In Proceedings of the 56th Annual Meeting of the Association for Computational Linguistics (Volume 1: Long Papers), pages 1383–1392. Association for Computational Linguistics.
- Edunov et al. (2018) Sergey Edunov, Myle Ott, Michael Auli, David Grangier, and Marc’Aurelio Ranzato. 2018. Classical structured prediction losses for sequence to sequence learning. In Proceedings of the 2018 Conference of the North American Chapter of the Association for Computational Linguistics: Human Language Technologies, Volume 1 (Long Papers), pages 355–364, New Orleans, Louisiana. Association for Computational Linguistics.
- Fabbri et al. (2019) Alexander Fabbri, Irene Li, Tianwei She, Suyi Li, and Dragomir Radev. 2019. Multi-news: A large-scale multi-document summarization dataset and abstractive hierarchical model. In Proceedings of the 57th Annual Meeting of the Association for Computational Linguistics, pages 1074–1084, Florence, Italy. Association for Computational Linguistics.
- Gao et al. (2020) Yang Gao, Wei Zhao, and Steffen Eger. 2020. SUPERT: Towards new frontiers in unsupervised evaluation metrics for multi-document summarization. In Proceedings of the 58th Annual Meeting of the Association for Computational Linguistics, pages 1347–1354, Online. Association for Computational Linguistics.
- Grusky et al. (2018) Max Grusky, Mor Naaman, and Yoav Artzi. 2018. Newsroom: A dataset of 1.3 million summaries with diverse extractive strategies. In Proceedings of the 2018 Conference of the North American Chapter of the Association for Computational Linguistics: Human Language Technologies, Volume 1 (Long Papers), pages 708–719, New Orleans, Louisiana. Association for Computational Linguistics.
- Holtzman et al. (2020) Ari Holtzman, Jan Buys, Li Du, Maxwell Forbes, and Yejin Choi. 2020. The curious case of neural text degeneration. In International Conference on Learning Representations.
- Jang et al. (2017) Eric Jang, Shixiang Gu, and Ben Poole. 2017. Categorical reparameterization with gumbel-softmax. In International Conference on Learning Representations.
- Lewis et al. (2020) Mike Lewis, Yinhan Liu, Naman Goyal, Marjan Ghazvininejad, Abdelrahman Mohamed, Omer Levy, Veselin Stoyanov, and Luke Zettlemoyer. 2020. BART: Denoising sequence-to-sequence pre-training for natural language generation, translation, and comprehension. In Proceedings of the 58th Annual Meeting of the Association for Computational Linguistics, pages 7871–7880, Online. Association for Computational Linguistics.
- Li and Jurafsky (2016) Jiwei Li and Dan Jurafsky. 2016. Mutual information and diverse decoding improve neural machine translation. CoRR, abs/1601.00372.
- Li et al. (2016) Jiwei Li, Will Monroe, and Dan Jurafsky. 2016. A simple, fast diverse decoding algorithm for neural generation. CoRR, abs/1611.08562.
- Li et al. (2019) Siyao Li, Deren Lei, Pengda Qin, and William Yang Wang. 2019. Deep reinforcement learning with distributional semantic rewards for abstractive summarization. In Proceedings of the 2019 Conference on Empirical Methods in Natural Language Processing and the 9th International Joint Conference on Natural Language Processing (EMNLP-IJCNLP), pages 6038–6044, Hong Kong, China. Association for Computational Linguistics.
- Lin (2004) Chin-Yew Lin. 2004. ROUGE: A package for automatic evaluation of summaries. In Text Summarization Branches Out, pages 74–81, Barcelona, Spain. Association for Computational Linguistics.
- Liu and Lapata (2019) Yang Liu and Mirella Lapata. 2019. Text summarization with pretrained encoders. In Proceedings of the 2019 Conference on Empirical Methods in Natural Language Processing and the 9th International Joint Conference on Natural Language Processing (EMNLP-IJCNLP), pages 3730–3740, Hong Kong, China. Association for Computational Linguistics.
- Narayan et al. (2018a) Shashi Narayan, Shay B. Cohen, and Mirella Lapata. 2018a. Don’t give me the details, just the summary! topic-aware convolutional neural networks for extreme summarization. In Proceedings of the 2018 Conference on Empirical Methods in Natural Language Processing, pages 1797–1807, Brussels, Belgium. Association for Computational Linguistics.
- Narayan et al. (2018b) Shashi Narayan, Shay B. Cohen, and Mirella Lapata. 2018b. Ranking sentences for extractive summarization with reinforcement learning. In Proceedings of the 2018 Conference of the North American Chapter of the Association for Computational Linguistics: Human Language Technologies, Volume 1 (Long Papers), pages 1747–1759, New Orleans, Louisiana. Association for Computational Linguistics.
- Park (2020) Jong Won Park. 2020. Continual bert: Continual learning for adaptive extractive summarization of covid-19 literature. In Proceedings of the 2020 NLP-COVID Workshop at the Conference on Empirical Methods in Natural Language Processing (EMNLP).
- Pasunuru and Bansal (2018) Ramakanth Pasunuru and Mohit Bansal. 2018. Multi-reward reinforced summarization with saliency and entailment. In Proceedings of the 2018 Conference of the North American Chapter of the Association for Computational Linguistics: Human Language Technologies, Volume 2 (Short Papers), pages 646–653, New Orleans, Louisiana. Association for Computational Linguistics.
- Paulus et al. (2018) Romain Paulus, Caiming Xiong, and Richard Socher. 2018. A deep reinforced model for abstractive summarization. In International Conference on Learning Representations.
- Raffel et al. (2020) Colin Raffel, Noam Shazeer, Adam Roberts, Katherine Lee, Sharan Narang, Michael Matena, Yanqi Zhou, Wei Li, and Peter J. Liu. 2020. Exploring the limits of transfer learning with a unified text-to-text transformer. Journal of Machine Learning Research, 21(140):1–67.
- Ranzato et al. (2016) Marc’Aurelio Ranzato, Sumit Chopra, Michael Auli, and Wojciech Zaremba. 2016. Sequence level training with recurrent neural networks. In 4th International Conference on Learning Representations, ICLR 2016, San Juan, Puerto Rico, May 2-4, 2016, Conference Track Proceedings.
- Rennie et al. (2017) S. J. Rennie, E. Marcheret, Y. Mroueh, J. Ross, and V. Goel. 2017. Self-critical sequence training for image captioning. In 2017 IEEE Conference on Computer Vision and Pattern Recognition (CVPR), pages 1179–1195.
- Williams (1992) Ronald J. Williams. 1992. Simple statistical gradient-following algorithms for connectionist reinforcement learning. Mach. Learn., 8(3–4):229–256.
- Zhang et al. (2020a) Jingqing Zhang, Yao Zhao, Mohammad Saleh, and Peter Liu. 2020a. PEGASUS: Pre-training with extracted gap-sentences for abstractive summarization. In Proceedings of the 37th International Conference on Machine Learning, volume 119 of Proceedings of Machine Learning Research, pages 11328–11339. PMLR.
- Zhang et al. (2020b) Tianyi Zhang, Varsha Kishore, Felix Wu, Kilian Q. Weinberger, and Yoav Artzi. 2020b. Bertscore: Evaluating text generation with bert. In International Conference on Learning Representations.
- Zhu et al. (2020) Chenguang Zhu, Ziyi Yang, Robert Gmyr, Michael Zeng, and Xuedong Huang. 2020. Make lead bias in your favor: Zero-shot abstractive news summarization. In International Conference on Learning Representations.
Appendix A Validation Scores
To determine an appropriate term for our mixed loss implementation, we have run tests with different values over the validation set for each dataset. To determine the best value, we have utilised the standard REINFORCE (Williams, 1992) approach combined linearly with the negative log-likelihood. We have chosen to optimise REINFORCE here since, being a close relative, but not the same as the algorithms we have used during training, it may help to eschew overfitting. In the interest of time, we have utilised the validation scores of a single seed to determine the values.
For the few-shot implementation in Table A.1, we have fixed the number of examples to fine-tune on (1,000) and the number of training iterations (2,000) exactly as in the standard baseline approach defined in Section 4. For the full-data approach in Table A.3, we have utilised all the training data, but, again in the interest of time, we have capped the number of training iterations to either: a) the same training time as the exhausted NLL tests reported in Table B.2, or b) 10,000 training iterations if the NLL training time exceeded 15,000 training iterations.
Tables A.2 and A.4 show the best values from the validation runs for all datasets. For datasets where there was no clear winner in Tables A.1 and A.3, we have compromised over the best values (highlighted in blue).
| Dataset | 0.1 | 0.3 | 0.5 | 0.7 | 0.9 |
|---|---|---|---|---|---|
| AESLC | 28.96/13.12/28.49 | 30.26/14.55/29.49 | 31.21/15.22/30.26 | 30.46/14.65/29.70 | 31.25/15.64/30.42 |
| ArXiv | 28.06/7.99/20.70 | 33.01/10.58/21.24 | 29.49/9.32/21.12 | 33.46/10.46/22.55 | 33.43/10.55/22.26 |
| Billsum | 41.61/28.08/34.65 | 40.37/28.07/34.17 | 40.16/28.19/34.27 | 39.56/28.11/34.16 | 42.64/29.36/35.73 |
| CNN/DM | 40.30/18.37/28.33 | 39.47/17.41/27.79 | 39.79/18.03/27.91 | 40.44/17.81/28.12 | 40.98/18.06/28.09 |
| Gigaword | 39.24/16.81/35.65 | 38.97/17.42/35.94 | 39.92/17.56/36.45 | 40.27/17.96/36.91 | 40.91/18.48/37.42 |
| Newsroom | 36.61/25.35/33.15 | 36.93/25.39/33.25 | 36.36/24.57/32.68 | 38.07/26.15/34.23 | 35.98/23.53/32.12 |
| Pubmed | 31.74/10.69/19.50 | 33.44/11.37/21.35 | 34.96/12.07/21.62 | 37.35/13.02/22.14 | 36.57/12.99/22.47 |
| Reddit-TIFU | 19.43/4.45/15.74 | 24.87/6.56/20.08 | 25.00/6.19/19.99 | 25.73/6.85/20.55 | 26.50/6.90/20.86 |
| XSum | 41.19/17.59/32.90 | 41.28/17.48/32.27 | 41.79/17.97/32.65 | 42.30/18.80/34.11 | 43.43/19.58/34.76 |
| AESLC | ArXiv | Billsum | CNN/DM | Gigaword | Newsroom | Pubmed | Reddit-TIFU | XSum |
| 0.9 | 0.7 | 0.9 | 0.9 | 0.9 | 0.7 | 0.7 | 0.9 | 0.9 |
| Dataset | 0.1 | 0.3 | 0.5 | 0.7 | 0.9 |
|---|---|---|---|---|---|
| AESLC | 28.66/11.52/28.35 | 32.81/15.45/32.48 | 33.39/15.77/32.98 | 33.23/16.36/32.75 | 34.94/17.17/34.11 |
| ArXiv | 5.71/0.00/5.56 | 1.76/0.23/1.70 | 1.61/0.04/1.59 | 10.08/1.40/9.09 | 13.19/2.46/11.59 |
| Billsum | 6.50/1.50/6.45 | 9.85/4.51/9.42 | 15.50/6.31/13.04 | 32.78/17.36/25.92 | 38.98/22.84/30.62 |
| CNN/DM | 3.50/0.004/0.35 | 15.37/5.75/14.91 | 24.36/8.12/22.58 | 29.17/11.46/27.44 | 35.56/14.87/33.29 |
| Gigaword | 28.48/11.90/27.23 | 39.89/18.35/37.28 | 41.61/18.89/38.49 | 43.67/20.51/40.30 | 42.68/19.34/39.26 |
| Newsroom | 31.48/21.03/28.32 | 27.73/15.08/24.05 | 26.78/13.79/22.84 | 33.92/20.89/30.19 | 35.56/22.58/31.77 |
| Pubmed | 1.04/0.12/1.03 | 0.29/0.00/0.29 | 0.77/0.08/0.76 | 6.34/1.78/5.12 | 10.98/2.29/8.96 |
| Reddit-TIFU | 1.08/0.06/1.08 | 11.59/1.43/10.45 | 9.15/1.24/8.63 | 14.71/2.58/12.59 | 23.25/5.79/18.94 |
| XSum | 23.04/6.44/17.45 | 34.02/12.04/25.35 | 35.56/12.61/26.10 | 38.84/15.98/30.94 | 41.60/18.16/33.43 |
| AESLC | ArXiv | Billsum | CNN/DM | Gigaword | Newsroom | Pubmed | Reddit-TIFU | XSum |
| 0.9 | 0.9 | 0.9 | 0.9 | 0.7 | 0.9 | 0.9 | 0.9 | 0.9 |
Appendix B Model Hyperparameters
In our experiments, we have utilised the same hyperparameters used in the original PEGASUS paper (Zhang et al., 2020a). The exception to this is our use of a smaller batch size, constrained by computational resources. As batch size we have used 1, which has resulted in a drop in performance compared to that of the original paper. However, our fine-tuning approach is ensured to converge through the use of a convergence criterion. This is defined by a validation run that evaluates the model every 1000 training iterations, and monitors the progression of the validation loss over the entire training run. A model is deemed ‘converged’ if its validation loss does not decrease over 3000 training iterations.
| Dataset | Learning Rate | Label Smoothing | Fine-Tuning Steps | Batch Size | Beam Size | Max Input Tokens | Max Target Tokens |
|---|---|---|---|---|---|---|---|
| AESLC | 5e-4 | 0.1 | 2000 | 1 | 1 | 512 | 32 |
| ArXiv | 5e-4 | 0.1 | 2000 | 1 | 1 | 1024 | 256 |
| Billsum | 5e-4 | 0.1 | 2000 | 1 | 1 | 1024 | 256 |
| CNN/DM | 5e-4 | 0.1 | 2000 | 1 | 1 | 1024 | 128 |
| Gigaword | 5e-4 | 0.1 | 2000 | 1 | 1 | 128 | 32 |
| Newsroom | 5e-4 | 0.1 | 2000 | 1 | 1 | 512 | 128 |
| Pubmed | 5e-4 | 0.1 | 2000 | 1 | 1 | 1024 | 256 |
| Reddit-TIFU | 5e-4 | 0.1 | 2000 | 1 | 1 | 1024 | 128 |
| XSum | 5e-4 | 0.1 | 2000 | 1 | 1 | 512 | 64 |
| Dataset | NLL | Validation | RwB-Hinge | RISK-2 | RISK-3 |
|---|---|---|---|---|---|
| AESLC | 7k | 7k | 5k | 5.3k | 5.3k |
| ArXiv | 43k | 10k | 7k | 7k | 7k |
| Billsum | 44k | 10k | 5k | 5k | 4.6k |
| CNN/DM | 12k | 12k | 6.6k | 6.6k | 7.6k |
| Gigaword | 10k | 10k | 5.6k | 6k | 6k |
| Newsroom | 10k | 10k | 6.3k | 6.6k | 6.3k |
| Pubmed | 55k | 10k | 5.6k | 6k | 6k |
| Reddit-TIFU | 10k | 10k | 7k | 7k | 6.5k |
| XSum | 8k | 8k | 6k | 5.3k | 6k |