The episodic dust-making Wolf-Rayet star HD 38030 in the Large Magellanic Cloud.
Abstract
Mid-infrared photometry of the Wolf-Rayet star HD 38030 in the Large Magellanic Cloud from the NEOWISE-R mission show it to have undergone a dust-formation episode in 2018 and the dust to have cooled in 2019–20. New spectroscopy with the MagE spectrograph on the Magellan I Baade Telescope in 2019 and 2020 show absorption lines attributable to a companion of type near O9.7III-IV. We found a significant shift in the radial velocity of the C iv 5801–12 blend compared with the RVs measured in 1984 and 1993. The results combine to suggest that HD 38030 is a colliding-wind binary having short-lived dust formation episodes, like the Galactic systems WR 140 and WR 19, but at intervals in excess of 20 yr.
keywords:
binaries: spectroscopic – circumstellar matter – stars: individual: HD 38030 – stars: Wolf-Rayet – stars: winds1 Introduction
It has long been known from infrared (IR) observations (Allen, Swings & Harvey, 1972) that some Galactic WC-type Wolf-Rayet (WR) stars make carbon dust in their winds. Most of these WR dust makers do so persistently and are of spectral sub-types WC8–9 (Williams, van der Hucht & Thé, 1987) but a few WR dust makers are of earlier subtypes and make their dust in brief, but regular, episodes at intervals of the order of a decade. The latter stars have been shown to be members of massive binary systems having highly elliptical orbits wherein the episodes of dust formation coincide with periastron passage, e.g. WR 140 (Williams et al., 1990) and WR 19 (Williams et al., 2009a). The dust formation is believed to result (Usov, 1991) from the collision of the carbon-rich WR stellar wind with that of its O-type companion, a process favoured when the stars are closer to each other in their orbit, with the result that the collision occurs in the denser regions of the stellar winds.
In a search for more episodic or variable dust-making Wolf-Rayet systems, a sample of WC stars in the Galaxy and Large Magellanic Cloud (LMC) was monitored in the mid-IR using observations made in the first five years of the Near-Earth Object WISE Reactivation (NEOWISE-R) mission (Mainzer et al., 2014), a reactivation of the WISE (Wright et al., 2010) mission. Amongst the WC stars found to show variable dust emission (Williams, 2019) was HD 38030111Also WS 39 (Westerlund & Smith, 1964), Br 68 (Breysacher, 1981) and BAT99 84 (Breysacher, Azzopardi & Testor, 1999). in the LMC: in 2018, after some years of apparent constancy in the IR, its (3.4-µm) and (4.6-µm) fluxes brightened by 1–2 magnitudes and its colour became more characteristic of emission by heated dust.
This made HD 38030 the second WR system in the LMC to show dust formation, after the variable (persistent) dust-maker HD 36402 (Williams et al., 2013). Recently, Lau et al. (2021) identified six candidate WC-type dust-makers from their mid-IR flux variations in low metallicity extragalactic environments – NGC 604 on the outskirts of M 33, NGC 2403, M 101, NGC 6946 and IC 1613 – showing this phenomenon to be widespread.
The fast rise in the IR flux from HD 38030 resembled those of WR 140 and WR 19, suggesting that HD 38030 might also be a collidng-wind binary (CWB) having a high orbital eccentricity. This prompted us to obtain spectra to search for evidence of binarity. The spectrum of HD 38030 had been classified as WC5+OB by Smith (1968), but the star has not been confirmed to be a binary. From the lack of variability in its radial velocities (RVs) observed in 1984 and 1993, Bartzakos, Moffat & Niemela (2001) deduced that it was ‘almost certainly’ a single star. Although the IR photometric history implies a long period and hence a small RV amplitude if the system is a CWB, the variation in RV might have been greater near IR maximum if that had occurred close to periastron passage, as in WR 140 and WR 19. This prompted our first spectroscopic observation in 2019 May, soon after the 2018 NEOWISE-R data showing the dust formation became available, and further observations in 2020. Also, as the NEOWISE-R mission continued, we sought to monitor the dust emission with further mid-IR observations after its rise with a view to determining the character and duration of the episode and estimating the time-scale and possible periodicity of the outbursts.
2 Observations
2.1 Spectroscopy
Spectra of HD 38030 were observed with the MagE (Magellan Echellette) Spectrograph (Marshall et al., 2008) on the Magellan I Baade telescope at Las Campanas Observatory on 2019 May 19 and 2020 January 15 and November 26. We used the 1-arcsec slit providing a resolving power of R 4100. A short exposure of a ThAr lamp obtained immediately after the target observation was used for wavelength calibration. Exposure times were 300 s for the 2019 spectrum and 200 s for the other two, producing S/N ratios of 200-300 and 100-150, respectively.
Flux calibration was performed from spectrophotmetric standard spectra taken during the same observing nights. The data were processed with a combination of the iraf echelle tasks and the mtools package originally designed by Jack Baldwin for the reduction of MIKE data (available from the LCO web-site). The relative flux calibration of MagE is good to a few percent, as both spectrophotometric standards and program objects are observed at the parallactic angle. The absolute fluxes are uncertain at the 30 per cent level or greater, as they depend upon similar slit losses for the program object and spectrophotometric standards.
2.2 Photometry
The IR photometric history of HD 38030 was assembled from a number of sources, the most useful being the WISE, NEOWISE Post-Cryo (Mainzer et al., 2011) and NEOWISE-R surveys from which the initial brightening in 2018 was discovered. The wavelengths of the WISE and bands, 3.4 and 4.6m, are well placed for observing emission by 1000-K dust in the wind of a hot star. Individual photometric class ‘AA’ and magnitudes were retrieved from the WISE All-Sky, WISE Post-Cryo and NEOWISE-R Single Exposure (L1b) Source Tables provided by the NASA/IPAC Infrared Science Archive222https://irsa.ipac.caltech.edu. Observations were selected to be within 1 arc sec of the optical position; in practice, the median distance of the 1336 individual observations was found to be 0.24 arc sec. The WISE data were collected in ‘visits’, akin to observing runs, each including a number of observations taken at intervals of one or more 94-min orbital passages and spread over several days, with the visits separated by about six months as the Sun-synchronous orbit of the satellite followed the Earth in its orbit. The length of visit and number of observations in each depend on the overlap of the survey strips, which increase with increasing ecliptic latitude as the overlap of the survey strips on the sky increases. This privileges HD 38030 on account of its high ecliptic latitude (-86°): it was observed an average of 87 times in each visit, thereby increasing the accuracy of the mean magnitudes from each visit, which are the data we use to monitor long-term variability (Table 3). Fortuitously for the study of the dust formation episode, the first of the visits in 2018 and 2019 were protracted and split by date, so that they could be treated as two separate runs, with the result that we have three well separated observations in each of 2018 and 2019. The data from the WISE surveys from the 2021 data release are collected in Table 3.
Earlier mid-IR observations of HD 38030 were taken during 2005 in the SAGE (Bonanos et al., 2009) survey. These data are given in Table 1. In between the second SAGE and first of the WISE observations, HD 38030 was also observed at 3.2, 7.0 and 11.0 in the AKARI Infrared Camera Survey of the Large Magellanic Cloud (Kato et al., 2012) on 2006 October 27–30. These data are given in Table 2.
In the near-IR, HD 38030 was observed in 1996 and 1997 in the Deep Near Infrared Survey of the Southern Sky (DENIS, Epchtein et al., 1999) Survey, 3rd Data Release (DENIS Consortium, 2005); in 2000 in the Two-micron All-Sky Survey (2MASS, Skrutskie et al., 2006); in 2000 and 2001 in the deeper 2MASS 6X w/LMC/SMC Point Source Working Database (Cutri et al., 2012); in 2003 in the InfraRed Survey Facility (IRSF) Magellanic Cloud Survey (Kato et al., 2007) and very frequently (46 times) during 2009–10 in the Vista Magellanic Clouds Survey (VMC, Cioni et al., 2011). The magnitudes from the DENIS, 2MASS and IRSF surveys are collected in Table 4. For brevity, we do not list all the VMC data but give only the average from the first and last nights of the 2009–10 intensive sequence of observations, followed by that from the final night later in 2010, all retrieved from the VMCDR4 detection table in the VISTA Science Archive333http://horus.roe.ac.uk/vsa (Cross et al., 2012).
| Date | [3.6] | [4.5] | [5.8] | [8.0] |
|---|---|---|---|---|
| 2005 55 | 12.800.04 | 12.530.05 | 12.440.04 | 12.190.08 |
| 2005.83 | 12.810.06 | 12.600.07 | 12.420.06 | 12.170.07 |
| Date | |||
|---|---|---|---|
| 2006.83 | 12.710.03 | 12.270.04 | 11.930.08 |
| Date | Survey | ||
|---|---|---|---|
| 2010.31 | 12.680.02 | 12.480.02 | All-Sky |
| 2010.80 | 12.720.02 | 12.480.02 | Post-Cryo |
| 2014.32 | 12.690.01 | 12.530.01 | NEOWISE-R |
| 2014.82 | 12.700.01 | 12.510.01 | NEOWISE-R |
| 2015.31 | 12.710.01 | 12.520.01 | NEOWISE-R |
| 2015.80 | 12.700.01 | 12.520.01 | NEOWISE-R |
| 2016.31 | 12.710.01 | 12.540.01 | NEOWISE-R |
| 2016.80 | 12.700.01 | 12.540.01 | NEOWISE-R |
| 2017.31 | 12.700.01 | 12.530.01 | NEOWISE-R |
| 2017.77 | 12.710.01 | 12.540.01 | NEOWISE-R |
| 2018.31 | 12.000.01 | 11.260.01 | NEOWISE-R |
| 2018.43 | 11.870.02 | 11.050.02 | NEOWISE-R |
| 2018.76 | 11.520.01 | 10.620.01 | NEOWISE-R |
| 2019.31 | 11.770.01 | 10.850.01 | NEOWISE-R |
| 2019.40 | 11.890.02 | 10.970.03 | NEOWISE-R |
| 2019.77 | 12.170.01 | 11.330.01 | NEOWISE-R |
| 2020.31 | 12.450.01 | 11.810.01 | NEOWISE-R |
| 2020.76 | 12.600.01 | 12.080.01 | NEOWISE-R |
| Date | Survey | |
|---|---|---|
| 1996.97 | 12.560.13 | DENIS DR3 |
| 1997.15 | 12.700.16 | DENIS DR3 |
| 2000.10 | 12.960.04 | 2MASS |
| 2000.94 | 12.860.03 | 2MASS6X |
| 2001.10 | 12.880.03 | 2MASS6X |
| 2003.86 | 12.900.02 | IRSF |
| 2009.84 | 12.900.01 | VMC DR4 |
| 2010.19 | 12.900.01 | VMC DR4 |
| 2010.86 | 12.890.01 | VMC DR4 |
3 Results
3.1 The spectrum
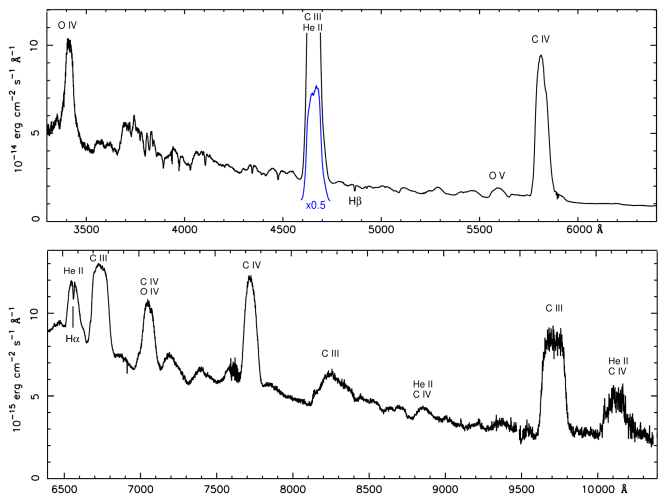

The 3300–10400-Å spectrum of HD 38030 observed on 2019 May 19 is shown in Fig. 1. The emission-line spectrum resembles that of the LMC WC4 star HD 37026 (Crowther et al., 2002) with strong He ii, C iii-iv and O iv-v emission lines but with the significant difference that HD 38030 shows absorption lines. Superimposed on the 6560 He ii emission we see H in absorption. Also visible in Fig. 1 is H absorption. The higher Balmer, He i-ii and Si iv absorption lines are more easily seen in the higher scale spectrum in Fig. 2. The absorption lines point to the presence of an OB type companion.
| Identification | 2019 May | 2020 Jan. | 2020 Nov. | ||||
| Ion | lab.wl. | wl. | EW | wl. | EW | wl. | EW |
| (Å) | (Å) | (Å) | (Å) | (Å) | (Å) | (Å) | |
| H11 | 3770.63 | 3774.1 | 0.4 | 3774.4 | 0.6 | 3774.2 | 0.5 |
| H | 3835.40 | 3838.4 | 0.5 | 3838.4 | 0.4 | 3838.5 | 0.4 |
| H | 3889.06 | 3892.9 | 0.8 | 3892.8 | 0.9 | 3892.7 | 0.9 |
| + He i | |||||||
| H | 3970.08 | 3974.2: | … | 3974.3: | … | 3974.2 | … |
| bl IS | |||||||
| H | 4101.74 | 4105.1 | 1.4 | 4105.6 | 1.4 | 4104.9 | 1.4 |
| + N iii | |||||||
| H | 4340.46 | 4344.5 | 0.8 | 4343.9 | 1.0 | 4344.6 | 0.8 |
| H | 4861.32 | 4865.5 | 1.0 | 4865.6 | 1.0 | 4865.4 | 1.1 |
| H | 6562.80 | 6568.1 | 0.7 | 6568.4 | 0.7 | 6568.2 | 0.6 |
| He i | 4471.47 | 4475.9 | 1.0 | 4476.2 | 0.9 | 4476.0 | 0.9 |
| He i | 4026.19 | 4029.6 | 0.5 | 4029.7 | 0.5 | 4029.7 | 0.5 |
| + He ii | |||||||
| He i | 4387.93 | 4392.0 | 0.2: | 4391.7: | … | … | … |
| He i | 4921.93 | 4926.1 | 0.4 | 4926.8 | 0.3 | 4926.7 | 0.4 |
| He ii | 4199.83 | 4203.6 | 0.1 | … | … | … | … |
| He ii | 4541.59 | 4546.1 | 0.1: | … | … | 4545.9 | 0.1: |
| He ii | 5411.52 | 5416.3 | 0.2 | … | … | 5416.3 | 0.1: |
| Si iv | 4088.86 | 4092.5 | 0.2 | … | … | 4092.7 | 0.1: |
The wavelengths and equivalent widths (EWs) of the absorption lines are given in Table 5. The EWs were measured by direct integration over the profile using bespoke software, with a local continuum determined from fitting the flux at six points (spanning 1.2Å) on either side of the line. The same code gave absorption-weighted wavelengths, , for these lines where is the difference between the continuum and residual flux at that wavelength. Independent measurement of the EWs using iraf routines gave values consistent within a fraction of 0.1Å. Where it was not possible to measure an EW because of blending or formation on the slope of an emission line, the wavelength was estimated by bisection of the profile. Some of the weaker lines could not be confidently measured in the 2020 spectra on account of their slightly lower S/N ratios.
The presence, but weakness, of the 4542 He ii line relative to 4471 He i indicates a spectral type near B0 for the absorption-line spectrum, no earlier than O9.5 or later than B0.2 (cf. Walborn & Fitzpatrick, 1990). Detailed criteria for classification amongst the O8.5–B0 stars is provided by Sota et al. (2011). While comparison with their He ii / He i ratios indicate O9.7 or B0, the weakness of 4552 Si iii relative to 4542 He ii in HD 38030 rules out B0 and favours O9.7 or O9.5, leaving us to adopt O9.7 for the spectral type of the companion. As to luminosity, the usual classification lines for O type stars are masked by the very strong 4650 WC4 emission feature and we have to consider the 4089 Si iv / 4026 He i ratio. Comparison of its value in HD 38030 ( 0.4) with those in O9.7 stars (Martins, 2018, fig. 6), appears to rule out a supergiant classification and is most consistent with luminosity classes III or IV.
To estimate the dilution of the companion spectrum by the continuum of the WC4 star, we compared the EWs of four Balmer lines (H, H, H and H) with those in late sub-type O stars. For the latter, we formed average EWs from the spectra of eight O9–O9.5 stars in Lucke-Hodge 41 observed with the same instrumentation. The average of the ratios of the EWs (HD 38030/template) was 0.370.07, indicating that the companion was 1.10.2 mag fainter than the system (and 0.60.3 mag fainter than the WC4 star). For the system, we adopted (Neugent, Massey & Morrell, 2018) and allowed for = 0.19 of interstellar extinction. The latter was determined by following Crowther et al. (2002) in adopting a Galactic component of = 0.07 from Schlegel et al. (1998) and adding a local component of = 0.12 estimated from the relative strengths of the Galactic and LMC interstellar Ca ii K lines in our spectra of HD 38030. For the absolute magnitude, we use the distance to the LMC (49.6 kpc, Pietrzyński et al., 2019), giving for the system and for the companion. Comparison with luminosities of late sub-type O stars in the LMC (e.g. Walborn et al., 2014, fig. 24) suggests that the class of the companion is in the region III-IV, possibly main-sequence but not supergiant.

A model analysis of the emission-line spectrum is beyond the scope of this paper but we examined the C/He diagnostic used by Crowther et al. (2002), the ratio of the 5471 C iv and 5412 He ii intensities. This is shown in Fig. 3. Comparison with the spectra of a sample of LMC WC4 stars in this region (Crowther et al., 2002, figs 2, 9), bearing in mind the dilution of the HD 38030 emission-line spectrum by the companion, shows that the C/He abundance ratio in HD 38030 is at the high end of those in the sample of stars analysed by Crowther et al., having C/He 0.35, which we suggest applies to HD 38030 as well.
3.2 Search for radial velocity shifts.
| Date | RV ( km s-1) | Source |
|---|---|---|
| 1984 December | 5498.3 | 10 obs, Bartzakos et al. |
| 1993 November | 5579.4 | 9 obs, Bartzakos et al. |
| 2019 May | 4778 | this work |
| 2020 January | 4868 | this work |
| 2020 November | 4838 | this work |
To test whether there had been any RV shift between the 1984–93 observations by Bartzakos et al. (2001) and our own, we aimed to replicate their RV measurements by measuring the intensity-weighted wavelength (Bartzakos, 1998, p. 26) of the strong 5801–12 C iv blend and deriving RVs adopting a laboratory wavelength of 5808.0 Å. The errors on our RVs were found from repeated measurement of the line and are close to 0.1 of a MagE resolution element. The heliocentric velocities are compared in Table 6. It is evident that there is a real velocity shift, 7712 km s-1, between the two datasets. Assuming that this shift is not caused by variations in the shape of the C iv emission-line profile, this supports the notion that the absorption-line spectrum forms in a physical companion to the WC4 star and the HD 38030 is also a colliding wind binary (CWB).
The difference between our 2019 and 2020 observations is comparable to the offset between the 2019 and 2020 interstellar line velocities (Table 7) and is not considered significant. To look for a RV shift between our 2019 and 2020 spectra, we considered the absorption lines (Table 5). The average shift (2019 to 2020 November) from the stronger lines: H to H, He i 4471 and 4025 is -29 km s-1, so we did not detect any RV change in this interval – which might have occurred if the stars were close to periastron in a highly elliptical orbit.
| Identification | 2019 May | 2020 Jan | 2020 Nov. | ||||
|---|---|---|---|---|---|---|---|
| (Å) | (Å) | ( km s-1) | (Å) | ( km s-1) | (Å) | ( km s-1) | |
| Ca ii | 3933.68 | 3934.0 | 22 | 3934.1 | 32 | 3934.1 | 30 |
| 3937.0 | 255 | 3937.1 | 261 | 3937.2 | 266 | ||
| Ca ii | 3968.49 | 3969.0: | 3969.0: | 3969.1: | |||
| 3972.0: | 3972.1: | 3972.1: | |||||
| Na i | 5889.95 | 5890.3 | 21 | 5890.3 | 19 | 5890.4 | 21 |
| Na i | 5895.92 | 5901.4 | 281 | 5901.5 | 284 | 5901.6 | 287 |
3.3 The dust-formation episode
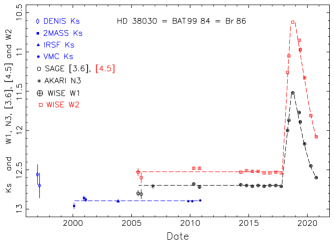
During 2010–2017, the WISE photometry of HD 38030 (Table 3, Fig. 4) showed no variation but, in 2018, the flux in and was observed to be rising sharply, at rates exceeding 1 mag y-1. We have no information about the onset of this event but, if the rate of brightening before our first 2018 observation was similar to that during the rise, formation must have begun soon after our last 2017 observation. Nor do we know at what date after our last 2018 observations the emission reached its maximum but, from the fact that the individual values of and during the 18 days of that ‘visit’ showed no significant brightening, the maximum must have occurred during or very soon after that observation. Examination of the positions of the 326 individual NEOWISE-R observations during the outburst shows no difference from the pre-outburst observations and a median distance of only 0.15 arc sec from the optical position, strongly identifying the outburst with the Wolf-Rayet system. An alternative eruptive source separated by 0.2 arc sec would also have fallen in the 1 arc sec slit used for the MagE spectrum but, as noted above, the latter (apart from the absorption lines) is very similar to the WC4 star HD 37026. There is no suggestion of extraneous features such as emission in the Balmer lines. If our sight line was in the Galactic plane, one might posit an IR eruption from a source in or behind a dense molecular cloud which extinguished the optical spectrum – but the Catalogue of Molecular Clouds in the LMC (Fukui et al., 2008) has no molecular cloud within 2 arc min of HD 38030. We therefore reject this possibility and, recalling the positional coincidence, are confident in associating the IR outburst with the WC4 system.
In Fig. 5, the fluxes calculated from the 2018.76 values of and are plotted above the IR spectral energy distribution (SED) determined from the pre-outburst WISE, NEOWISE and NEOWISE-R data, together with the earlier AKARI, SAGE, 2MASS and VMC data, which can be seen to be consistent. All data were de-reddened by = 0.19 as above. The pre-outburst SED, taken to represent the stellar wind of HD 38030, can be represented by a power law, . Although not required for the present investigation, we note that extrapolation of this IR power law to optical wavelengths lies between the continuum from our MagE spectrum and fluxes from narrow-band and (Smith, 1968), DENIS and VMC photometry also plotted in Fig. 5. The continuum estimated from the MagE spectrum, drawn avoiding emission lines, lies lower than the fluxes derived from the photometry owing to the inclusion of WR emission lines in the latter.
With fluxes at only two wavelengths during the episode of dust formation, we can not expect to see the Planckian IR SED characteristic of dust emission such as those shown by classsic WR dust makers (e.g., Cohen et al., 1975; Williams et al., 1987), but the – slope is much ‘redder’ than that of the wind emission or of optically thin free-free emission444Such emission would have – = 0.67, still ‘bluer’ than the colours in 2018–19, and could affect the optical spectrum., so we consider the excess emission to be provided by heated dust.

An increase of dust emission in the IR can be caused either by an increase in the stellar UV-visual flux heating the dust and being reprocessed in the IR or by the formation of new dust. The fact that the SED from the MagE spectrum lies no higher than that from the earlier photometry points to the latter alternative. To get a measure of the amount of dust formed in the event, we use a simple model for isothermal, optically thin dust emission in which the flux, observed at a distance from the source is given by the convolution of the grain emissivity, , and the Planck function for the grain temperature:
| (1) |
Given , the temperature of the grains, , can be found by fitting the dust emission in and . The mass of dust is then found using this temperature, the overall fit and distance, , for which we adopted that to the LMC (49.6 kpc, Pietrzyński et al., 2019). We calculated from the optical properties of the ‘ACAR’ amorphous carbon grains prepared in an inert atmosphere in the laboratory by Colangeli et al. (1995) and tabulated by Zubko et al. (1996). From the 2018.76 and , we derive K, and . With only two wavelengths, we do not have errors for the fit and those quoted come only from the errors on the 2018.76 and pre-outburst and photometry and repeated model fits. They could be dwarfed by systematic uncertainties if the optical properties of the dust grains near HD 38030 differ from those of the laboratory sample from which they were calculated. The model SED is also plotted in Fig. 5. We see that the contribution of the dust emission to the SED in the near-IR is small, where the model predicts = 12.70, only 0.17 mag brighter than the underlying wind, and much less at and shorter wavelengths. This is a consequence of the relatively low grain temperature derived. Heating of the dust grains by the intense UV-optical radiation field of the WC4 and O9.7 stars prevents their survival close to the stars. It is only when the stellar wind material from which the grains condense has moved far enough away for the radiation field to be sufficiently diluted geometrically that the grains can survive in radiative eqilibrium, re-radiating in the IR. With knowledge of the stellar radiation and grain properties in the UV, this can be modelled: with the aid of direct imaging of newly formed dust around WR 140 (Monnier, Tuthill & Danchi, 2002), the minimum distance of the dust was estimated to be 125 au from the stars (Williams et al., 2009b). The corresponding distance for the HD 38030 dust cloud also heated by WC and O stars is likely to be comparable. In any event, we emphasise that the dust lies a long way from the region of the WC4 star where the 5801-12 C iv blend is expected to form. For example, in the WC5 star WR 111, the C iv blend was shown to form within the inner 10 R* of the wind (Hillier, 1989, fig. 5). We therefore do not expect dust formation to affect the RVs measured for this feature in Section 3.2 above.
Given the inference above from the light curve that dust was forming for not much less than a year before the 2018.76 observation, the dust mass derived from that observation suggests a dust-formation rate of . If HD 38030 has a mass-loss rate typical of those derived for LMC WC4 stars by Crowther et al. (2002), , and a carbon abundance comparable to that of HD 32257, as indicated by the 5471/5412 ratio, the mass of carbon flowing in the wind of HD 38030 would be . The fraction of this that would be available for dust formation in a wind collision depends on the size of the wind-collision region (WCR), which can be characterised by its opening angle, which is determined by the momenta of the WC and companion stellar winds (Stevens, Blondin & Pollock, 1992). If the opening angle of the WCR in HD 38030 was the same as that in WR 140 (34°, Williams et al., 2021) the fraction would be 0.085, providing of carbon for dust formation. Even if the WCR in HD 38030 was an order of magnitude smaller, there would still be enough carbon going into the WCR to make the amount of dust determined.

The behaviour during the outburst is summarised by the locus in the mid-IR colour-magnitude diagram (CMD) in Fig. 6. As dust formation began, the star became brighter and redder in the mid-IR because the dust emission was redder than the stellar wind and came to dominate the emission, causing rapid movement of the locus to brighter and redder –. This continued while new dust formed, but when formation ceased and the dust continued moving away from the star it cooled as the stellar radiation heating it was progressively diluted. This is confirmed by fitting the same model with the same grain emissivities, , as above to the 2019.77 and data, a year after maximum, which gives K, K cooler than earlier. Again, the quoted error comes from the photometry and the true temperature may be different if the grain emissivities differ from those adopted, but the use of the same emissivity law for the two epochs leaves the cooling intact. As the dust emission faded, it was redder in – than at the corresponding value of when it was rising. This contributes to the total emssion, resulting in the loop in the CMD. As the dust emission continues to fade, the locus returns slowly to the stellar wind values of and –.
3.4 The IR photometric history
This appears to be the first recorded such event from HD 38030. Before the first WISE observations, the 3.2-µm magnitude observed in the AKARI LMC Survey was consistent with the pre-outburst magnitudes (Table 2). On the other hand, the SAGE [3.6] magnitudes observed in 2005 are 0.1 mag. fainter than the WISE . To see whether this indicates real variation or reflects a systematic difference between the datasets, we compared the SAGE [3.6] and WISE magnitudes for the nine LMC WC stars showing no variation in their WISE or NEOWISE-R data (Williams, 2019) and common to the SAGE survey. We found a mean difference of [3.6]– = 0.130.06. As this is consistent with the difference observed for HD 38030, we do not consider the fainter [3.6] as evidence of mid-IR variability. The SAGE [4.5] and WISE are more consistent with each another.
There are two gaps of 3.5 y in the mid-IR photometric history, between the AKARI observation in 2006.83 and the WISE All-Sky observation in 2010.31, and between the WISE Post-Cryo observation in 2010.80 and the first NEOWISE-R observation in 2014.32. The question arises: could a dust formation episode like that observed have been completed in either of these gaps? Extrapolation of the fading suggests that would not have recovered its stellar wind level before the end of 2020 while will not do so until about a year later, implying a duration of about 4 y. The light curve therefore argues against a ‘missing’ outburst in either of these gaps so that we conclude that the mid-IR data photometric history from about 2002 shows no earlier dust-formation episode.
Taking the DENIS photometry at face value, there may have been an earlier outburst in 1996–97, indicating a period of 22 y, but the quoted errors are larger than those in the other data-sets. Also, there is the possibility of an offset between the DENIS and 2MASS data: Delmotte et al. (2001) found a systematic shift of = –0.14 (DENIS minus 2MASS) between the scales, with significant variation from DENIS strip to strip, which may account for the brighter DENIS magnitudes. Otherwise, on the basis of there being no evidence for dust emission in the first 2MASS observation, the interval between episodes, and period if they are periodic, must be greater than 20 yr.
4 Discussion
The brief dust-formation epsiode, presence of absorption lines and difference in RV of the 5808-Å emission line from the historical work make HD 38030 an excellent candidate for membership of the family of long-period WC+O CWBs which make dust for small fractions of their orbits. Of these, WR 140 and WR 19 have periods of 7.94 and 10.1 y. respectively but another galactic WC7+O system, WR 125, has lately been found to be beginning its second observed dust-formation episode, indicating a period near 28.3 y (Williams, 2019), so that the long period suggested for HD 38030 is not unreasonable. Further mid-IR observations on a long time-scale are needed to look for another episode.
The short duration of dust formation (c. 1 y) compared with the period ( 20 y) indicates that the conditions allowing this occur for a tiny fraction of the orbit, like WR 140 and WR 19, and suggests that HD 38030 also has a very elliptical orbit. Further RVs from a study such as that described by Shenar et al. (2019) are needed to test this and, on a shorter time-scale, search for anti-phase variations in the RVs of emission and absorption lines.
The temperature derived for the dust from the 2018.76 photometry, K, is lower than expected from our knowledge of systems like the achetypical WR 140. Initially in a dust formation episode, the emission would be dominated by that of the hottest, newly formed grains: in the case of WR 140, = 1100 K (Williams et al., 2009b). Similarly, WR systems which make dust all the time, like the ten apparently constant persistent dust makers discovered in the NEOWISE-R WC stars survey (Williams, 2019), have grain temperatures averaging 1112 K ( 198 K). As the dust is carried away by the stellar wind, it cools because the stellar UV-visual radiation heating it is progressively geometrically diluted – the temperature of ACAR grains in thermal equilibrium in a central radiation field falls off with distance from the source as – and also because the grains grow, so that had fallen to 800 K in WR 140 a year after dust formation began (Williams et al., 2009b). From low-resolution IUE spectra, Niedzielski & Skórzyński (2002) determined a terminal wind velocity of 3148 km s-1 for HD 38030, slightly faster than that (2860 km s-1, Williams & Eenens, 1989) of WR 140, so we expect the dispersal of the dust and consequent cooling in the two systems to be similar. The fact that the dust in HD 38030 approximately a year after condensation began is significantly cooler than that of WR 140 at the same age is therefore probably not the result of much faster dispersal. This is supported by a model fit to the earlier 2018.31 observation, which also yielded a relatively low temperature: = 64810 K.
The dust temperatures found for HD 38030 are closer to that (710 K for 0.01-µm ACAR grains) found from Spitzer IRAC [3.6] and [4.5] photometry of SPIRITS 19q, a WC4 star in NGC 2403 which also showed a dust-formation episode peaking in 2018 (Lau et al., 2021). Like HD 38030, this system is in a metal-poor environment, and these differences may reflect a difference in properties of the dust or the circumstances of its condensation, although it is not easy to see how this can occur in grains formed from an element produced by the star itself. It would be very desirable to have IR photometry of such systems at more than two wavelengths to constain the dust temperature to investigate this further.
The collision of fast winds in a CWB may result in X-ray emission, which may be observable if conditions are favourable. In their Chandra ACS survey of WR stars in the Magellanic Clouds, Guerrero & Chu (2008) obtained only an upper limit to the X-ray flux for HD 38030 but, in view of the significant variation of X-ray emission from the apparently similar CWBs WR 140 (Corcoran, 2012) and WR 19 (Nazé, Gosset & Marechal, 2021), further X-ray observations of HD 38030 would be worthwhile.
5 Conclusions
The mid-IR flux from HD 38030 rose by 1–2 mag in a year or less before 2018.76, and then faded more slowly in 2019–20, while the – colour became redder, indicative of a brief episode of circumstellar dust formation followed by cooling similar to those shown by the Galactic CWB systems WR 140 and WR 19. The photometric history indicates that, if the episodes by HD 38030 are indeed periodic, the period is greater than 20 yr.
Our new spectroscopy shows a well developed absorption-line spectrum pointing to the presence of a companion to the WC4 star, which we classified as O9.7 with a tentative luminosity class of III or IV. This is supported by the luminosity () estimated from the dilution of the absorption lines by the WC4 continuum and photometry. Comparison of the 5471 C iv/5412 He ii C/He diagnostic used by Crowther et al. (2002) with those of his sample of LMC WC4 stars shows that the C/He abundance ratio in HD 38030 is at the high end of those in the sample, suggesting by comparison with the results of his modelling, C/He 0.35 in HD 38030. Comparison of the radial velocity of the 5801–12 C iv blend in our 2019 and 2020 spectra measured in the same way as that of the same feature by Bartzakos et al. (2001) in 1984 and 1993 show a significant (7712 km s-1) shift. Assuming that this shift is not caused by variations in the shape of the C iv emission line profile, it strengthens the view that the WC4 and O9.7 stars are members of a binary system, a colliding wind binary.
Modelling the dust emission yielded a mass, , indicating a formation rate consistent with the amount of carbon expected to be flowing into the WCR and available for condensation. The grain temperatures at maximum and when the IR flux was rising were, however, lower than those observed from the archetypical system WR 140 at similar stages in the evolution of its dust cloud. The temperature was closer to that (710 K) found by Lau et al. (2021) from Spitzer IRAC [3.6] and [4.5] photometry for SPIRITS 19q, a WC4 star which showed a dust-formation episode peaking in 2018 and, like HD 38030, also lies in a metal-deficient environment (NGC 2403).
Acknowledgments
This paper includes data gathered at the 6.5-meter Magellan telescopes at Las Campanas Observatory, Chile. The paper makes use of data products from the Near-Earth Object Wide-field Infrared Survey Explorer (NEOWISE-R), which is a project of the Jet Propulsion Laboratory/California Institute of Technology. NEOWISE-R is funded by the National Aeronautics and Space Administration. Data were retrieved from the NASA/ IPAC Infrared Science Archive, which is operated by the Jet Propulsion Laboratory, California Institute of Technology, the VISTA Science Archive, which is operated by the Wide Field Astronomy Unit of the Institute for Astronomy, University of Edinburgh, and the VizieR catalogue access tool, operated by the CDS, Strasbourg. PMW is grateful to the Institure for Astronomy for continued hospitality and access to the facilities of the Royal Observatory Edinburgh. We would like to thank the referee for a careful report.
Availability of data
The infrared photometry is publicly available from the references cited. The spectra will be shared on reasonable request to the corresponding author.
References
- Allen et al. (1972) Allen D. A., Swings J. P., Harvey P. M., 1972, A&A, 20, 333
- Bartzakos (1998) Bartzakos P., 1998, PhD thesis, UNIVERSITÉ DE MONTRÉAL (CANADA)
- Bartzakos et al. (2001) Bartzakos P., Moffat A. F. J., Niemela V. S., 2001, MNRAS, 324, 18
- Bonanos et al. (2009) Bonanos A. Z., et al., 2009, AJ, 138, 1003
- Breysacher (1981) Breysacher J., 1981, A&AS, 43, 203
- Breysacher et al. (1999) Breysacher J., Azzopardi M., Testor G., 1999, A&AS, 137, 117
- Cioni et al. (2011) Cioni M. R. L., et al., 2011, A&A, 527, A116
- Cohen et al. (1975) Cohen M., Barlow M. J., Kuhi L. V., 1975, A&A, 40, 291
- Colangeli et al. (1995) Colangeli L., Mennella V., Palumbo P., Rotundi A., Bussoletti E., 1995, A&AS, 113, 561
- Corcoran (2012) Corcoran M. F., 2012, in Drissen L., Robert C., St-Louis N., Moffat A. F. J., eds, Astronomical Society of the Pacific Conference Series Vol. 465, Proceedings of a Scientific Meeting in Honor of Anthony F. J. Moffat. p. 330
- Cross et al. (2012) Cross N. J. G., et al., 2012, A&A, 548, A119
- Crowther et al. (2002) Crowther P. A., Dessart L., Hillier D. J., Abbott J. B., Fullerton A. W., 2002, A&A, 392, 653
- Cutri et al. (2012) Cutri R. M., et al., 2012, VizieR Online Data Catalog, p. II/281
- DENIS Consortium (2005) DENIS Consortium 2005, VizieR Online Data Catalog, p. II/263
- Delmotte et al. (2001) Delmotte N., Egret D., Loup C., Cioni M.-R., 2001, in Starck J.-L., Murtagh F. D., eds, Society of Photo-Optical Instrumentation Engineers (SPIE) Conference Series Vol. 4477, Astronomical Data Analysis. pp 301–312 (arXiv:astro-ph/0109293), doi:10.1117/12.447187
- Epchtein et al. (1999) Epchtein N., et al., 1999, A&A, 349, 236
- Fukui et al. (2008) Fukui Y., et al., 2008, ApJS, 178, 56
- Guerrero & Chu (2008) Guerrero M. A., Chu Y.-H., 2008, ApJS, 177, 216
- Hillier (1989) Hillier D. J., 1989, ApJ, 347, 392
- Kato et al. (2007) Kato D., et al., 2007, PASJ, 59, 615
- Kato et al. (2012) Kato D., et al., 2012, AJ, 144, 179
- Lau et al. (2021) Lau R. M., et al., 2021, ApJ, 909, 113
- Mainzer et al. (2011) Mainzer A., et al., 2011, ApJ, 731, 53
- Mainzer et al. (2014) Mainzer A., et al., 2014, ApJ, 792, 30
- Marshall et al. (2008) Marshall J. L., et al., 2008, in McLean I. S., Casali M. M., eds, Society of Photo-Optical Instrumentation Engineers (SPIE) Conference Series Vol. 7014, Ground-based and Airborne Instrumentation for Astronomy II. p. 701454 (arXiv:0807.3774), doi:10.1117/12.789972
- Martins (2018) Martins F., 2018, A&A, 616, A135
- Monnier et al. (2002) Monnier J. D., Tuthill P. G., Danchi W. C., 2002, ApJ, 567, L137
- Nazé et al. (2021) Nazé Y., Gosset E., Marechal Q., 2021, MNRAS, 501, 4214
- Neugent et al. (2018) Neugent K. F., Massey P., Morrell N., 2018, ApJ, 863, 181
- Niedzielski & Skórzyński (2002) Niedzielski A., Skórzyński W., 2002, Acta Astron., 52, 81
- Pietrzyński et al. (2019) Pietrzyński G., et al., 2019, Nature, 567, 200
- Schlegel et al. (1998) Schlegel D. J., Finkbeiner D. P., Davis M., 1998, ApJ, 500, 525
- Shenar et al. (2019) Shenar T., et al., 2019, IAU Symposium, 346, 307
- Skrutskie et al. (2006) Skrutskie M. F., et al., 2006, AJ, 131, 1163
- Smith (1968) Smith L. F., 1968, MNRAS, 140, 409
- Sota et al. (2011) Sota A., Maíz Apellániz J., Walborn N. R., Alfaro E. J., Barbá R. H., Morrell N. I., Gamen R. C., Arias J. I., 2011, ApJS, 193, 24
- Stevens et al. (1992) Stevens I. R., Blondin J. M., Pollock A. M. T., 1992, ApJ, 386, 265
- Usov (1991) Usov V. V., 1991, MNRAS, 252, 49
- Walborn & Fitzpatrick (1990) Walborn N. R., Fitzpatrick E. L., 1990, PASP, 102, 379
- Walborn et al. (2014) Walborn N. R., et al., 2014, A&A, 564, A40
- Westerlund & Smith (1964) Westerlund B. E., Smith L. F., 1964, MNRAS, 128, 311
- Williams (2019) Williams P. M., 2019, MNRAS, 488, 1282
- Williams & Eenens (1989) Williams P. M., Eenens P. R. J., 1989, MNRAS, 240, 445
- Williams et al. (1987) Williams P. M., van der Hucht K. A., Thé P. S., 1987, A&A, 182, 91
- Williams et al. (1990) Williams P. M., van der Hucht K. A., Pollock A. M. T., Florkowski D. R., van der Woerd H., Wamsteker W. M., 1990, MNRAS, 243, 662
- Williams et al. (2009a) Williams P. M., Rauw G., van der Hucht K. A., 2009a, MNRAS, 395, 2221
- Williams et al. (2009b) Williams P. M., et al., 2009b, MNRAS, 395, 1749
- Williams et al. (2013) Williams P. M., Chu Y.-H., Gruendl R. A., Guerrero M. A., 2013, MNRAS, 431, 1160
- Williams et al. (2021) Williams P. M., et al., 2021, MNRAS, 503, 643
- Wright et al. (2010) Wright E. L., et al., 2010, AJ, 140, 1868
- Zubko et al. (1996) Zubko V. G., Mennella V., Colangeli L., Bussoletti E., 1996, MNRAS, 282, 1321