Direct evidence of jets emanating from droplets at the Rayleigh charge-induced instability point
Abstract
Highly charged liquid droplets are unstable above the critical charge squared-to-volume ratio given by the Rayleigh limit. The instability leads to ion ejection from jets formed on the droplet’s surface. Despite the many experiments that have been performed to capture the jet formation the precise fission mechanism has not yet been observed because of its brief transient nature. Here, we present the first atomistic simulations that reveal the mechanism of Rayleigh fission. We demonstrate that ion ejection takes place through a drop’s deformation from a spherical into a distinct shape that contains a conical protrusion. We assert that the latter state is a free energy minimum along an order parameter that measures the degree of droplet asphericity. The charged droplet’s long-time evolution proceeds by alternating between the two minima above and below the critical value that are reached through solvent evaporation and ion ejection, respectively. For the first time, this mechanism allows one to explain the nature of the progeny droplets and the percentage of charge lost during fission. We determine that the cone half-angle is close to the value predicted from the solution of the electrostatic equation for the dielectric liquid. It is found that the conical deformation is independent of the effect of electrohydrodynamic forces reported in experiments. Contrary to the experimental observations of two diametrically opposite jets for droplets suspended in the electric field, we found that a single jet is formed at the Rayleigh limit. This indicates that super-charged droplet states may have been detected in the experiments.
Charged liquid droplets are unstable above a critical charge squared-to-volume ratio given by the Rayleigh limitRayleigh (1882). This instability arises from competing electrostatic and surface tension forces. The instability leads to formation of jets ejecting ions from the droplet surface. The Rayleigh instability appears in numerous applications that include sprays used in native mass spectrometry, manufacturing, and inkjet printingJung et al. (2021). It also plays a role in phenomena of quantum mechanical natureLukyanchuk et al. (2015); Salomaa and Williams (1981); Leiderer et al. (2015). The fission of charged droplets has been studied for approximately one and a half centuries starting from the seminal article of Lord RayleighRayleigh (1882). Lord Rayleigh determined the conditions for the onset of instability in a charged conducting dropletRayleigh (1882). It is notable that in the same article Lord Rayleigh intuited that the instability would subsequently develop into a jet that emits ions.
Rayleigh’s approach is based on a linear stability analysis of a spherical droplet with respect to small shape perturbations expressed in terms of spherical harmonics. The energy of the droplet is written as the sum of surface energy and electrostatic energy. This energy is then expressed as a quadratic form in terms of the amplitudes of the spherical harmonics used to describe the perturbations. For small values of the charge the quadratic form is positive definite and, hence, the droplet is stable. The condition of stability is concisely described via the fissility parameter defined as
| (1) |
where , , and denote the total charge of the droplet, the droplet radius, and the surface tension, respectively, and is the permittivity of vacuum. corresponds to the Rayleigh limit while for the system is below the Rayleigh limit and is stable w.r.t. small perturbations. The derivation of the Rayleigh limit following different approaches can be found in Refs.Peters (1980); Hendricks and Schneider (1963); Consta and Malevanets (2015). The Rayleigh theory can not provide an answer on the pathway of the droplet fission. The mode that corresponds to the order of the spherical harmonics is the first to become unstable. It has been assumed that oblate-prolate fluctuations, appearing as an hour-glass shape deformations, play a major role in the droplet fission Nix (1967).
Following Lord Rayleigh’s development, the ion ejection from charged droplets has been extensively tested experimentally Hayati et al. (1986); Doyle et al. (1964); Abbas and Latham (1967); Schweizer and Hanson (1971); Richardson et al. (1989); De La Mora (1996); Smith et al. (2002); Grimm and Beauchamp (2009); Taflin et al. (1989); Duft et al. (2002, 2003); Achtzehn et al. (2005); Gomez and Tang (1994). Many of the experiments have found the amount of charge released from a droplet and some succeeded in capturing micro-graphs of the released train of droplets from a jetDuft et al. (2002, 2003); Gomez and Tang (1994); Smith et al. (2002); Grimm and Beauchamp (2009). However, the precise fission mechanism, which includes the birth and the retraction of the jet, has not been yet experimentally observed because of its brief transient nature. Additionally, in experimental setups the jet formation is influenced by aerodynamic effects, impurities, and external electric fieldsGomez and Tang (1994); Duft et al. (2002, 2003), which prevent a clear observation of the jets conjectured by Lord Rayleigh. Quantitative explanations of the experimentally observed jet angles and of the jet stability are still missing from the literature. The jets formed in conducting droplets and the multi-conical protrusions in the “star”-shaped super-charged dielectric dropletsOh et al. (2017) have not been related thus far.
In this Letter we present the first direct evidence via atomistic modeling of the jet formation at the Rayleigh limit. Contrary to the experimental observationsDuft et al. (2002, 2003); Gomez and Tang (1994) of two diametrically opposite jets for droplets suspended in the electric field, we find that a single jet is formed at the Rayleigh limit.
Extensive molecular dynamics (MD) simulations of atomistically modeled systems of various sizes were performed. It was estimated and empirically tested that a system of \ceH2O molecules and 48 \ceNa+ ions is sufficiently large in order to produce realistic jets relevant to experimental observations. The water molecules were represented by the TIP3P (transferable intermolecular potential with three points)Jorgensen and Jenson (1998) water molecules. The ions were modeled with the CHARMM36mNoskov and Roux (2008); Beglov and Roux (1994) force field. The droplet was placed in a spherical cavity with radius 20nm where the spherical boundary conditions were imposed. The cavity size was chosen to accommodate the extensive shape fluctuation of the droplet. The simulations were performed using the software NAMD version 2.12Phillips et al. (2005). Newton’s equation of motion for each atomic site was integrated using the velocity-Verlet algorithm with a time step of 1fs. The temperature of the system was set at 300K and was maintained with Langevin thermostat with the damping coefficient set to 1/ps. The electrostatic interactions were treated with the multilevel summation methodHardy et al. (2015). The Rayleigh limit of the droplet ( in Eq. 1) was calculated with the surface tension valueVega and de Miguel (2007) . During the course of 1ns equilibration run no ions were ejected from the system. As the water molecules evaporate from the surface of the drop the system crosses the instability boundary. We observed the development of jets when the system size reached 28522 water molecules. We confirmed, by preparing systems comprising 28000 and 27500 water molecules, that the drops below this size also become unstable and emit ions through jet formation.
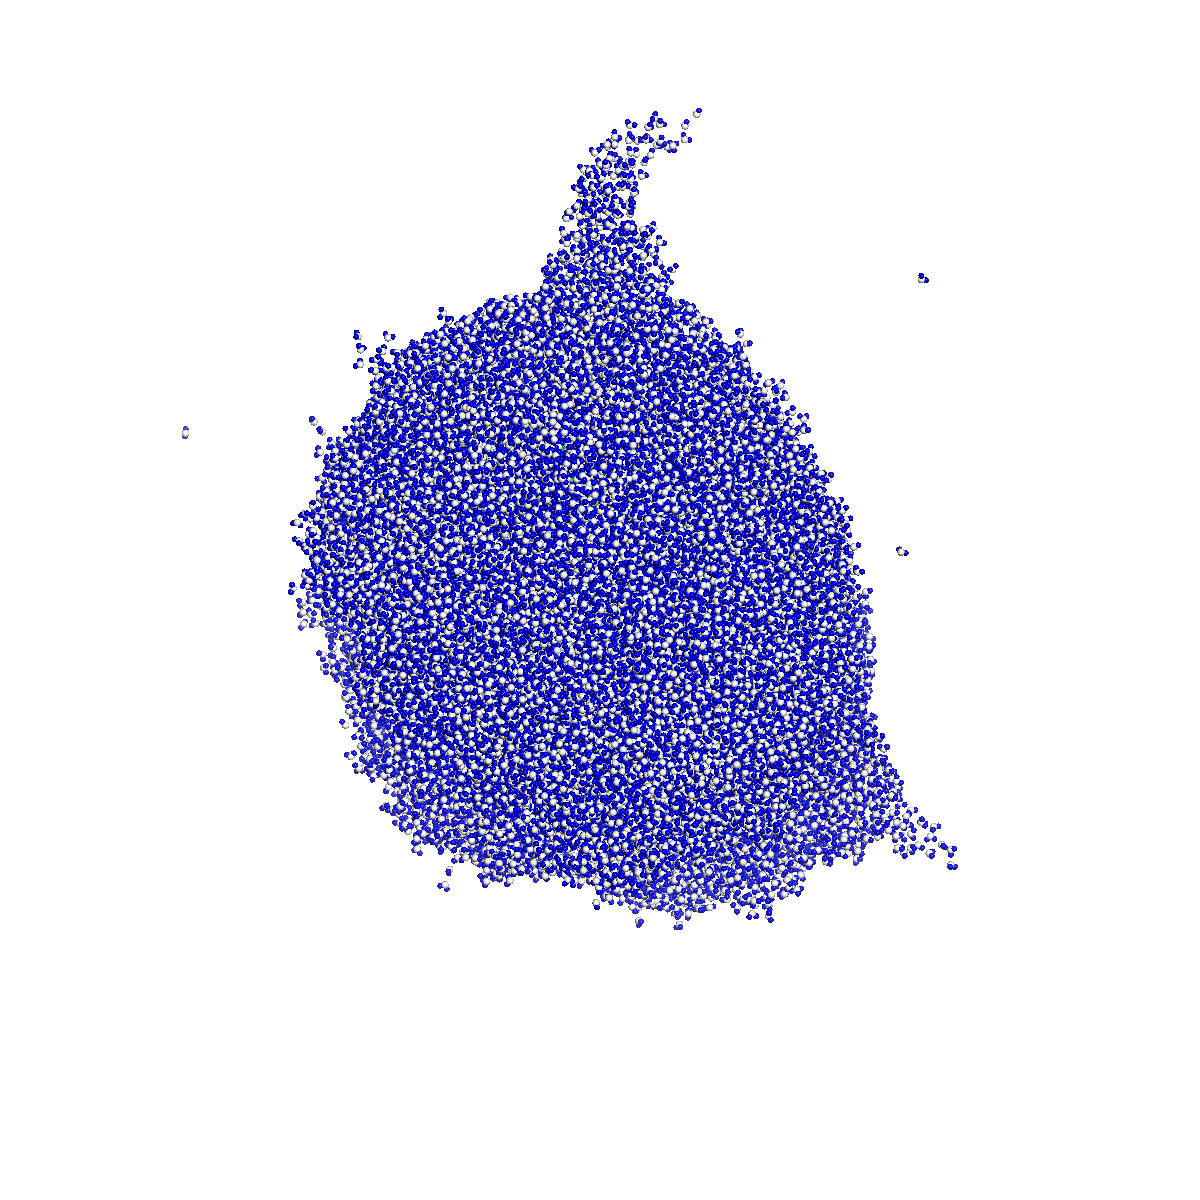
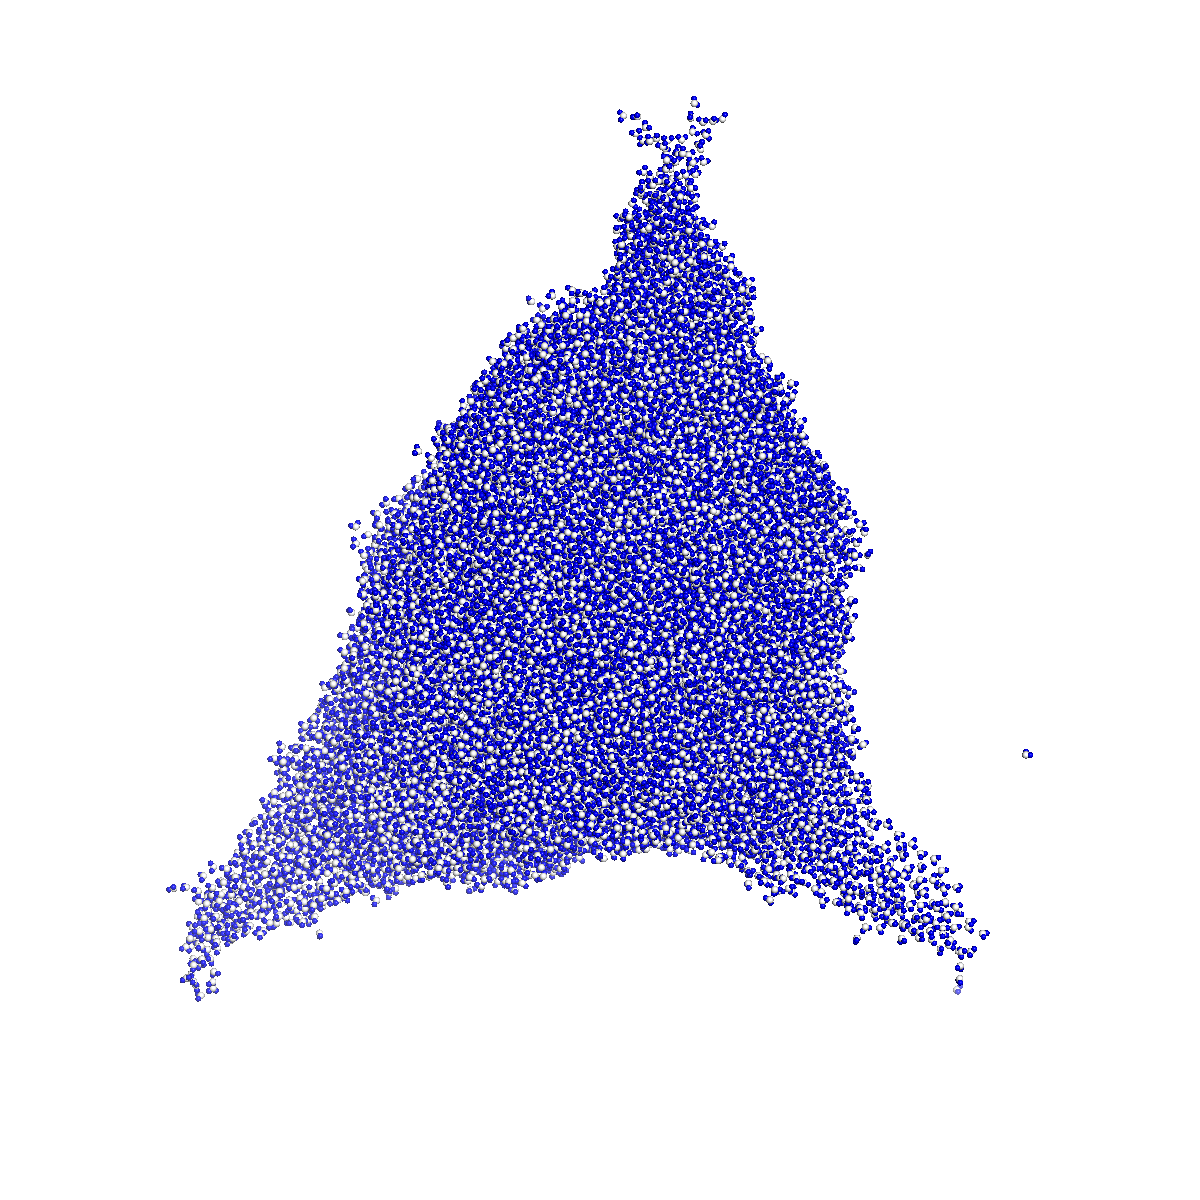
As the droplet approaches the critical size (from below the Rayleigh threshold) intermittent spines developed. The spines dimensions are comparable to the diameter of the droplet, therefore, they cannot be considered small perturbations of the spherical shape. At the critical size, that corresponds to 28522 \ceH2O molecules and 48 \ceNa+ ions, a stable cone develops. The conical deformation is independent of the effect of electrohydrodynamic forces reported in experimentsMelcher and Taylor (1969); Hayati et al. (1986). The observed geometry of the developed jets differ critically from the expected Taylor cone geometryTaylor (1964).
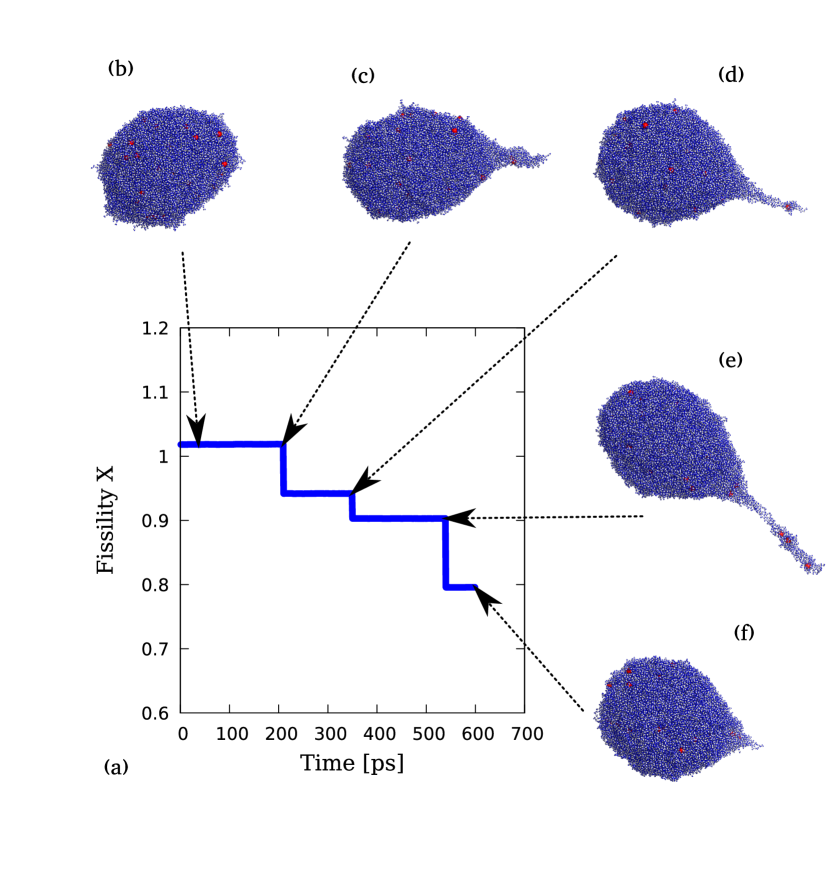
Figure 1(a) shows the time evolution of the fissility parameter in the course of the observed drop fragmentation. Figure 1(b)-(f) are typical snapshots of droplet states. The Supplementary Video shows the molecular dynamics trajectory of the formation of the jet and the ejection of the solvated ions. It is emphasized that the spines are the result of the global fluctuation of the charge density and can not be attributed to the local aggregation of several charges within their bases.
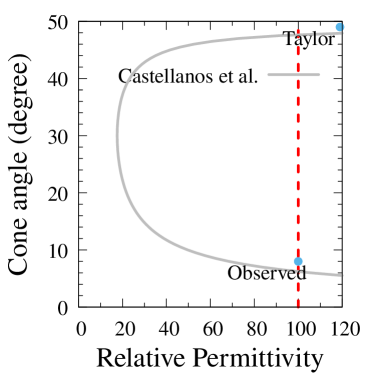
CastellanosRamos and Castellanos (1994) et al. provided an expression for the dielectric constant that corresponds to the stable conical shape with half-angle :
| (2) |
where is the Legendre function of degree . Eq. (2) is an extension of the Taylor solution for the conical drop deformationTaylor (1964); Fernandez de la Mora (2006). Figure 2 shows the values of the half angle as a function of the relative permittivity. The upper and lower branches in Figure 2 show little sensitivity to the solvent’s dielectric constant for values greater than . Droplet configurations were fitted using the approximation (3) of the molecular surface that has the features of a tear-drop shape
| (3) | ||||
where is the spherical angle between the direction of the radius vector and the direction of the cone . After some algebra one arrives at the corresponding expression for the cone angle
| (4) |
The numerical fitting shows that the observed cone half-angle corresponds to the lower branch of solutions with values for the half-angle of about rather than suggested by Taylor. Drops with similar acute conical deformations have been observed in experiments where they have been attributed to the spatial charge from the emitted spray surrounding the dropletDe La Mora (1992).
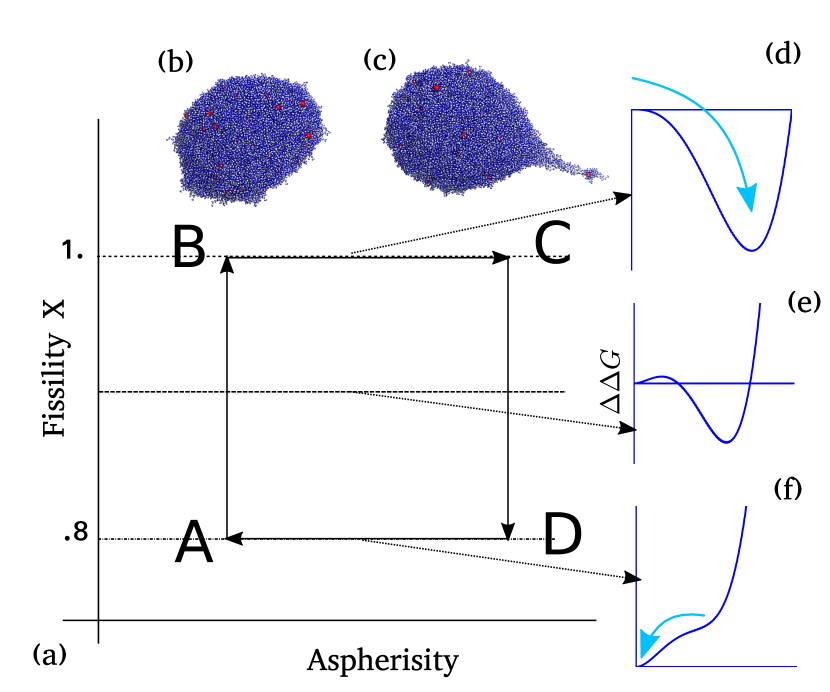
Figure 3(a) shows the hypothetical cyclic evolution of a charged conducting droplet characterized by the fissility () as a function of an order parameter that measures the degree of deviation of the shape from the sphere. We name this order parameter “asphericity”. The droplet fission takes place by alternating between two minima in the free energy profile above and below the critical value that are reached through solvent evaporation and ion ejection, respectively. State A is found at and corresponds to the lowest value of asphericity (Figure 3 (b)). As the drop evaporates and increases, as it is inversely proportional to the size, the stable spherical drop becomes a metastable conformation. In terms of the free energy as a function of the asphericity, the meta-stability is demonstrated by a deep second minimum. When the drop reaches state B where the drop becomes unstable and evolves into a new state C that contains a conical protrusion (Figure 3 (c)). The ions enter the jet domain in a diffusive motion and are ejected from the tip (the details of the process can be viewed in the suppl. video). The electric field at the tip diverges so that there is no activation energy barrier in this Born ion ejection process. The system is locked in the new metastable state while the charge ejection takes place. As more and more ions are emitted decreases below a certain critical value at about while the cone is still present (State D). At this time state D spontaneously reverts to a new stable spherical state A. In smaller droplets low activation barrier may allow for tunneling between states A and D for relatively high values of the fissility parameter . After this cycle the size of the droplet in the state A is smaller than that of in the original state A.
We point out the presence of a hysteresis effect along the CD segment in Figure 3 (a). When the drop loses a number of charges and the decreases below the critical value the fission process still continues. Here, we examined the largest droplet that can be modeled atomistically and can demonstrate the formation of jets. Small droplets also show the formation of the tips, but the ion ejection is limited to single ejection event comprising a single ion. In this case the ejection event is indistinguishable from the Born model of ion evaporationIribarne and Thomson (1976); Roux et al. (1990).
The ejection mechanism has a number of important consequences. We conclude that the ions are ejected from the narrow conical tip. Therefore, the size of the progeny droplets should not be overly sensitive to the size of the parent droplets but may depend on the size of the ejected ion. The amount of the charge lost should be a universal number for macroscopic drops. In microscopic drops there is a probability of tunneling between states D and A making the amount of charge loss smaller. In native mass spectrometry one of the hotly debated questions is how the macroions are ejected from droplets of at least 100 nm in size. The macroions trapped at the base of the cone will be ejected in the same way as elementary ions carrying with them only the immediate environment. The drop will preferentially eject the (macro)ions residing near the surface of the drop.
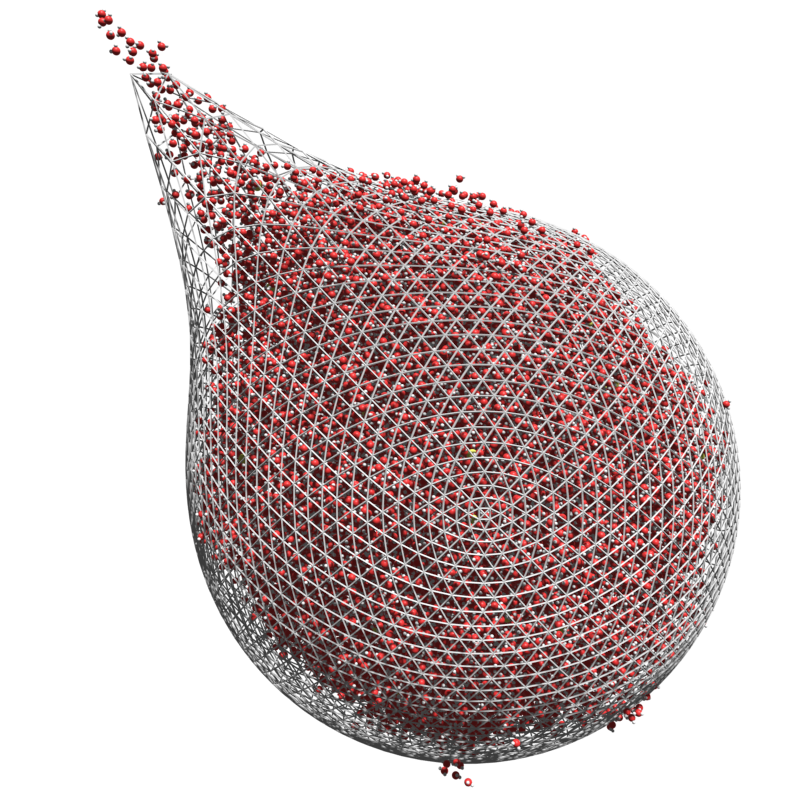
An elegant explanation of the ejection mechanism that matches the available computational evidence relies on the presence of an asymmetric term in the free energy potential as illustrated in Ref. (Wales, 2004, pp. 334). The variation of the tentative free energy of the system along the asphericity is shown in panels Figure 3(d)-(f). The effect is similar to magnetization below the Curie point. Here, the deviation of the fissility parameter from the mean value plays the role of the applied magnetic field. When the fissility parameter changes between the high and low values the system stays trapped in one of the states as shown in Figure 3. Motivation for the presence of the odd terms in the free energy potential comes from the statistical analysis of the fluctuations of a droplet containing a non-fissile microion and was described in detail in our prior workMalevanets et al. (2018). It is noted that charged dielectric droplets form “star”-shapes above the Rayleigh limitOh et al. (2017) (Fig. 4). To this end, we have constructed a free energy functional for a weakly perturbed droplet based on the general principlesLandau et al. (1980). We postulated that the expansion of the free energy functional in powers of the shape perturbation coefficients should be invariant with respect to the three dimensional rotations of the droplet and, hence, should depend only on the Steinhardt invariantsSteinhardt et al. (1983) and . and parameters are proportional to the second order and third order amplitudes of the expansion coefficients in terms of spherical harmonics of order . The presence of the third order invariant is rationalized on the basis of the observation of the equilibrium star-shaped droplets. We notice that terms are invariant to the sign inversion transformation . However, an inspection of the shapes in Figure 4 shows that the stars have sharp cones pointing outwards and smooth surface in the interior. This asymmetry indicates that the third order invariant provides an important contribution to the free energy. We believe that the third order correction to the free energy functional arises from a mean curvature correction to the macroscopic free energy. The presence of droplet protuberances on a smooth core indicates that cones with positive mean curvature are favoured and dimples in the droplet with negative mean curvature are penalized explaining the observed droplet conformations.
The drop conformations comprising a single jet correspond to quasi-static simulations when the evaporation is slower than the drop dynamics. If the solvent evaporation is fast one may arrive at super-charged drop with a value of the fissility parameter above unity. In this case the drop fluctuations become significantly more intensive and the multiple jet protrusions may develop. In Fig. 4 snapshots of drop conformations with values of the fissility parameter are presented. In this case the charges are restrained to remain on a single non-fissile macroion to prevent immediate drop disintegration. The simulations of the conducting and charged dielectric droplets indicate that the experimentally observed drops with multiple jets correspond to a case of fissility parameter greater than one.
In summary, we have provided direct evidence of the Rayleigh ejection mechanism using atomistic modeling of charged drops. The modeling allowed us to approach the Rayleigh limit very closely, which cannot be readily achieved in experiments. The presented mechanism of jet formation does not depend on the details of the molecular models used. The formation of a conical protrusion from which ions are released appears in the entire spectrum of droplet sizes ranging from the nano- to the micro-size. In light of the proposed droplet morphology at the Rayleigh limit previous experimental data need to be re-interpreted. The atomistic insight into jet characteristics may lead to a unified theory that connects the instability in ferrofluids due to a magnetic field with the instability manifested in “star”-shaped droplets and jets emanating from conducting droplets due to an electic field.
Acknowledgements.
S.C. thanks Prof. D. Frenkel, Department of Chemistry, University of Cambridge, UK and Dr. Anatoly Malevanets for discussions on the stability of charged droplets. S.C. acknowledges the NSERC-Discovery grant for funding this research and a Marie Curie International Incoming Fellowship Grant Number 628552, held in the Department of Chemistry, University of Cambridge, UK. ComputeCanada is acknowledged for providing the computing facilities.References
- Rayleigh (1882) L. Rayleigh, Philosophical Magazine Series 5, Philos. Mag. 14, 184 (1882).
- Jung et al. (2021) W. Jung, Y.-h. Jung, P. V. Pikhitsa, J. Shin, K. Bang, J. Feng, and M. Choi, Nature 592, 54 (2021).
- Lukyanchuk et al. (2015) I. Lukyanchuk, V. Vinokur, A. Rydh, R. Xie, M. Milošević, U. Welp, M. Zach, Z. Xiao, G. Crabtree, S. Bending, et al., Nat. Phys. 11, 21 (2015).
- Salomaa and Williams (1981) M. M. Salomaa and G. A. Williams, Phys. Rev. Lett. 47, 1730 (1981).
- Leiderer et al. (2015) P. Leiderer, E. Scheer, K. Kono, J.-J. Lin, and D. Rees, J. Low Temp. Phys. , 1 (2015).
- Peters (1980) J. Peters, Eur. J. Phys. 1, 143 (1980).
- Hendricks and Schneider (1963) C. Hendricks and J. Schneider, Am. J. Phys 31, 450 (1963).
- Consta and Malevanets (2015) S. Consta and A. Malevanets, Mol. Simul. 41, 73 (2015).
- Nix (1967) J. R. Nix, Ann. Phys. 41, 52 (1967).
- Hayati et al. (1986) I. Hayati, A. Bailey, and T. F. Tadros, Nature 319, 41 (1986).
- Doyle et al. (1964) A. Doyle, D. R. Moffett, and B. Vonnegut, J. Colloid Sci. 19, 136 (1964).
- Abbas and Latham (1967) M. Abbas and J. Latham, jfm 30, 663 (1967).
- Schweizer and Hanson (1971) J. W. Schweizer and D. Hanson, J. Colloid Interface Sci. 35, 417 (1971).
- Richardson et al. (1989) C. Richardson, A. Pigg, and R. Hightower, in Proc. R. Soc. London, Ser. A, Vol. 422 (The Royal Society, 1989) pp. 319–328.
- De La Mora (1996) J. F. De La Mora, J. Colloid Interface Sci. 178, 209 (1996).
- Smith et al. (2002) J. N. Smith, R. C. Flagan, and J. Beauchamp, J. Phys. Chem. A 106, 9957 (2002).
- Grimm and Beauchamp (2009) R. L. Grimm and J. Beauchamp, J. Phys. Chem. A 114, 1411 (2009).
- Taflin et al. (1989) D. C. Taflin, T. L. Ward, and E. J. Davis, Langmuir 5, 376 (1989).
- Duft et al. (2002) D. Duft, H. Lebius, B. A. Huber, C. Guet, and T. Leisner, Phys. Rev. Lett. 89, 084503 (2002).
- Duft et al. (2003) D. Duft, T. Achtzehn, R. Muller, B. A. Huber, and T. Leisner, Nature 421, 128 (2003).
- Achtzehn et al. (2005) T. Achtzehn, R. Müller, D. Duft, and T. Leisner, Eur. Phys. J. D-Atomic, Molecular, Optical and Plasma Physics 34, 311 (2005).
- Gomez and Tang (1994) A. Gomez and K. Tang, Phys. Fluids 6, 404 (1994).
- Oh et al. (2017) M. I. Oh, A. Malevanets, M. Paliy, D. Frenkel, and S. Consta, Soft Matter 13, 8781 (2017).
- Jorgensen and Jenson (1998) W. L. Jorgensen and C. Jenson, J. Comput. Chem. 19, 1179 (1998).
- Noskov and Roux (2008) S. Y. Noskov and B. Roux, J. Mol. Biol. 377, 804 (2008).
- Beglov and Roux (1994) D. Beglov and B. Roux, J. Chem. Phys. 100, 9050 (1994).
- Phillips et al. (2005) J. C. Phillips, R. Braun, W. Wang, J. Gumbart, E. Tajkhorshid, E. Villa, C. Chipot, R. D. Skeel, L. Kalé, and K. Schulten, J. Comput. Chem. 26, 1781 (2005).
- Hardy et al. (2015) D. J. Hardy, Z. Wu, J. C. Phillips, J. E. Stone, R. D. Skeel, and K. Schulten, J. Chem. Theory Comput. 11, 766 (2015).
- Vega and de Miguel (2007) C. Vega and E. de Miguel, J. Chem. Phys. 126, 154707 (2007).
- Melcher and Taylor (1969) J. Melcher and G. Taylor, Annu. Rev. Fluid Mech. 1, 111 (1969).
- Taylor (1964) G. Taylor, Proc. R. Soc. London, Ser. A 280, 383 (1964).
- Ramos and Castellanos (1994) A. Ramos and A. Castellanos, Phys. Lett. A 184, 268 (1994).
- Zarzycki and Gilbert (2020) P. Zarzycki and B. Gilbert, Phys. Chem. Chem. Phys. 22, 1011 (2020).
- Fernandez de la Mora (2006) J. Fernandez de la Mora, Annual Review of Fluid Mechanics, Annu. Rev. Fluid Mech. 39, 217 (2006).
- De La Mora (1992) J. F. De La Mora, J. Fluid Mech. 243, 561 (1992).
- Iribarne and Thomson (1976) J. V. Iribarne and B. A. Thomson, J. Chem. Phys. 64, 2287 (1976).
- Roux et al. (1990) B. Roux, H. A. Yu, and M. Karplus, J. Phys. Chem. 94, 4683 (1990).
- Wales (2004) D. Wales, Energy Landscapes (Cambridge University Press, 2004).
- Malevanets et al. (2018) A. Malevanets, M. I. Oh, M. Sharawy, and S. Consta, Mol. Phys. 116, 2892 (2018).
- Landau et al. (1980) L. D. Landau, E. M. Lifshitz, and L. Pitaevskii, Statistical physics, part I (pergamon, Oxford, 1980).
- Steinhardt et al. (1983) P. J. Steinhardt, D. R. Nelson, and M. Ronchetti, Phys. Rev. B 28, 784 (1983).