The role of crosslinking density in surface stress and surface energy of soft solids
Abstract
Surface stress and surface energy are two fundamental parameters that determine the surface properties of any materials. While it is commonly believed that the surface stress and surface energy of liquids are identical, the relationship between the two parameters in soft polymeric gels remains debatable. In this work, we measured the surface stress and surface energy of soft silicone gels with varying weight ratios of crosslinkers in soft wetting experiments. Above a critical density, , the surface stress was found to increase significantly with crosslinking density while the surface energy remained unchanged. In this regime, we can estimate a non-zero surface elastic modulus that also increases with the ratio of crosslinkers. By comparing the surface mechanics of the soft gels with their bulk rheology, the surface properties near the critical density were found to be closely related to the underlying percolation transition of the polymer networks.
I Introduction
Surface stress and surface energy are the essential parameters in many mechanical problems involving material interfaces, including adhesion and wetting between materials Andreotti and Snoeijer (2020); Style et al. (2017); Chung and Chaudhury (2005), the fracture formations dynamics Long et al. (2021); Creton and Ciccotti (2016); Liu et al. (2020), and the evolution of phase separations in composite systems Style et al. (2018); Wei et al. (2020). While surface stress, , indicates the force per unit length required to expand a region at a material interface, surface energy, , characterizes the associated energy cost per unit area. At a liquid interface, molecules can easily redistribute themselves under deformation to keep a constant density such that the surface stress and surface energy are always identical, . Conventionally, the surface stress of a liquid is often referred to as liquid surface tension. By contrast, the surface densities of molecules or atoms in crystalline solids will vary through deformations. As a result, the surface stress and surface energy of crystalline solids can differ greatly, Orowan (1970); Cammarata and Sieradzki (1994); Streitz et al. (1994).
However, despite the growing interest in the mechanics of soft polymeric gels, there is little consensus on whether their surface stress () and surface energy () are equal Liang et al. (2018); Xu et al. (2018); Snoeijer et al. (2018); Chen et al. (2019); Liang et al. (2018). In experiments with liquid droplets wetting on soft gels, for example, the macroscopic contact angle was found to remain constant as the substrate stretches up to Schulman et al. (2018). This finding implies a similarity between the surfaces of liquids and gels, such that the surface energy is strain-independent and hence consistently equal to the surface stress. On the other hand, the direct imaging of local wetting profiles on the scales of tens of micrometers showed that the surface stress of soft gels can differ substantially from the surface energy Style et al. (2013); Xu et al. (2017). Under highly asymmetric strain fields, the surface stress of soft gels can even be anisotropic, like crystalline solids Xu et al. (2018); Smith-Mannschott et al. (2021). However, despite the apparent discrepancies in the surface properties of soft solids among different studies, quantitative studies on the relationship between the surface stress and surface energy of soft polymeric gels are still lacking.
To address this issue, we systematically studied how the wetting of liquid droplets on soft gels is affected by the crosslinking density of the substrates. By measuring the droplet shapes and the substrate profiles separately on different length scales, we observed a gradual crossover from a solid-like regime where surface stress is greater than surface energy () to a liquid-like state where the two parameters become approximately equal () near a critical density of crosslinkers. We show that this transition in surface properties is physically related to an underlying change in the material rheology.
II Experimental Results
The gel substrates used in this work were prepared by mixing the divinyl-terminated polydimethylsiloxane (Gelest, DMS-V31) with a trimethylsiloxane terminated-dimethylsiloxane copolymer as the cross-linkers (Gelest, HMS-301) and a platinum-divinyltetramethyldisiloxane complex in xylene as the catalyst (Gelest, SIP6831.2) Jensen et al. (2015). The pre-cured solution was spin-coated on standard thickness cover-slips at a speed of 800 rpm for one minute, and then cured at room temperature for about 40 hours before measurements. This preparation protocol yielded a gel layer approximately 56 thick with a surface roughness around nm Xu et al. (2020). The weight ratio of the crosslinkers, , determines the stiffness of the substrates. In this work, we kept in the range of so that the resulting shear modulus could be adjusted between the orders of Pa.
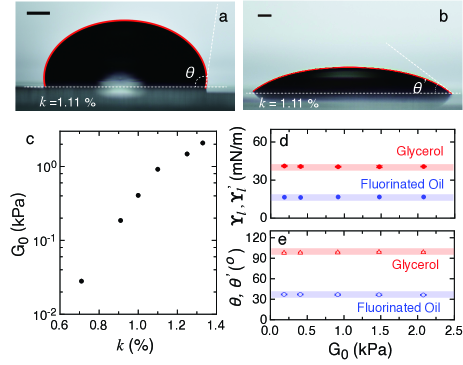
We first quantified how the macroscopic wetting profiles of liquid droplets were affected by the crosslinking densities of the gel substrates. We deposited millimeter-sized liquid droplets on the substrates using a pipette and then waited for 40 mins to ensure the wetting was in equilibrium. For all of the droplets measured in the experiments, we did not observe any wetting hysteresis on the soft gels Xu et al. (2017, 2018). Figures 1a shows a representative image of a glycerol droplet wetting soft gels with the weight ratio of crosslinkers . The deposited glycerol droplets had typical sizes of mm, larger than the liquid capillary length ( mm). Therefore, the overall shapes of the droplets resulted from the balance between the gravitational stress and the Laplace pressure induced at liquid-air interfaces. For a liquid droplet with a given surface stress and a mass density , the stress balance can be expressed as:
| (1) |
where is the mean curvature of the liquid-air interface and specifically represents the mean curvature at the apex. By solving the stress equation numerically and fitting the outcomes to the droplet boundaries, we can determine the surface stress of deposited droplets on each gel substrate Hansen and Rødsrud (1991).
We measured the surface stresses of glycerol droplets as the crosslinking densities of the soft substrates () varied systematically. The shear modulus of the substrates increased sharply from 28 Pa to 2.1 kPa with increasing from to (Fig. 1c). For , the pre-mixed solution will have not cured properly but will have remained mainly as a fluid. As shown in Fig. 1d, the surface stress of the deposited glycerol droplet remained constantly around mN/m while varied from 180 Pa to 2.1 kPa. It is noticeable that this constant value was considerably lower than the surface stress of pure liquid glycerol in air ( mN/m), a phenomenon that has been observed in previous experiments Xu et al. (2017); Style et al. (2013). This reduction in the surface stress was caused by uncrosslinked polymer chains that were extracted from the gel substrates. The extracted polymers covered the droplet surfaces and lowered the resulting surface stress Xu et al. (2020); Hourlier-Fargette et al. (2018); Zhao et al. (2018); Hourlier-Fargette et al. (2017); Wong et al. (2020). The modulus-independent surface stress indicates that the extracted free chains were fully saturated at the liquid-air interfaces.
We next focus on the contact angles of the glycerol droplets on the same gels. For droplets much larger than the elastocapillary length of the substrates ( m), the equilibrium follows the classical Young Dupre’s law Style et al. (2013),
| (2) |
where and are the surface energies of the soft gels interfacing with air and liquid, respectively. For liquid glycerol droplets, the surface energy is expected to be equal to the surface stress, mN/m. By resolving the droplet boundaries using imaging analysis, contact angles can be measured precisely. The red triangles in Fig. 1g show that the contact angle of glycerol droplets was consistently around as the substrate modulus varied from kPa to kPa. According to Eq. 2, this result suggests that is independent of for glycerol droplets wetting on soft silicone gels.
To test the generality of these findings, we further replaced glycerol with fluorinated oil (Sigma Aldrich FC-70) as a different deposited liquid. As shown in Fig. 1b, the fluorinated oil wetted the gel substrates well with a contact angle significantly smaller than 90 degrees. By varying the crosslinking density from to , the surface stress of fluorinated oil droplets, mN/m (Fig. 1d), and their wetting contact angles on the gels, (Fig. 1e), were both found to be independent of the substrate modulus as well. Since it is very unlikely that both and in Eq. 2 varied with in the exact same way for the two different deposited liquids (glycerol and fluorinated oil), we conclude that the crosslinking density had no effect on the surface energy of the soft silicone gels.
While the equilibrium contact angle results from minimization of the overall surface energy, it provides little information on the deformations of the gel surfaces induced by wetting. It has been shown that the local profiles near the contact points are related to the gel surface stress Style et al. (2013). Since surface stress () is not necessarily equal to surface energy () for polymeric gels, we need to quantify the wetting profiles microscopically to evaluate the influence of crosslinking density on the surface stress.
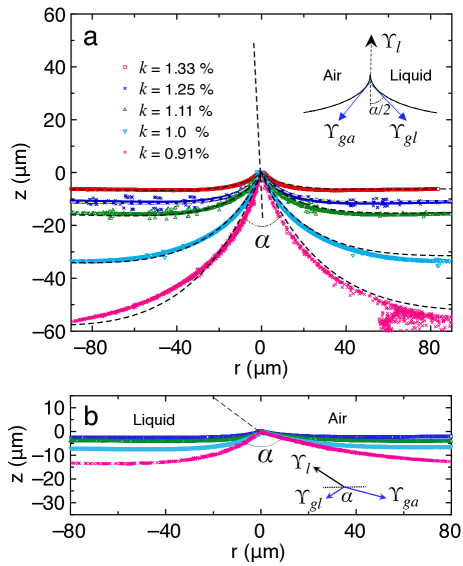
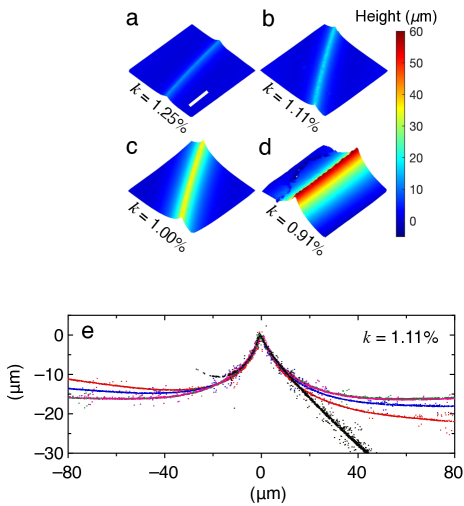
To measure the surface profiles of the substrates induced by wetting precisely, we deposited a layer of fluorescent nano-beads ( nm) at the gel interfaces as the tracer particles. The beads had area densities less than so that, their influence on the surface properties of the gels was negligible Xu et al. (2017). The fluorescent particles were imaged using a Leica-SP8 laser confocal fluorescent microscope with a 63x water immersion objective (N.A. ). For each droplet, we first obtained a stack image by scanning the focal plane vertically to cover the height of the wetting ridges. By locating the 3D positions of the nanoparticles, we can reconstruct the surface deformations with a spatial resolution around 200 nm. Due to the axial symmetry of the wetting profiles with respect to the droplet center, we can further collapse the 3D profile azimuthally to a 2D plane. The resulting profiles induced by the glycerol and fluorinated oil droplets are presented as height () versus radial distance () in Figs. 2a and b for various crosslinking densities. The plots are shifted to align onto the peaks of the wetting ridges.
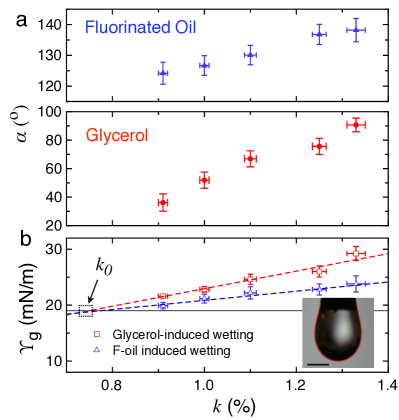
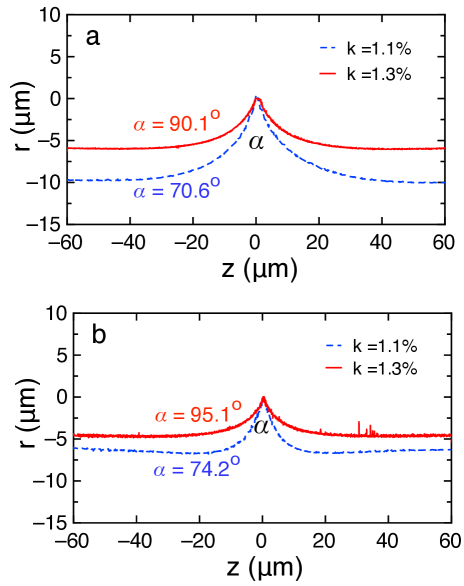
For the glycerol droplets wetting the soft gels, the overall geometry of the induced ridges varied greatly as decreased from to . The height of the wetting ridges increased from m to m (Fig. 2a), whereas the opening angle () at the top of the ridges decreased correspondingly from to degree (Fig. 3a). For a given crosslinking density of the substrate, we repeated the profile measurements with 5 to 10 glycerol droplets. The opening angle was found to be independent of the droplet size. This generic profile near the top of ridges was similar to the Neumann’s triangle in three-liquid contacts. The geometry is determined by the balance of surface stresses between different interfaces Style et al. (2013). Because the profiles were symmetric with respect to the glycerol-air interface (the dashed line in Fig. 2e), the gel surface stresses on both sides were approximately equal, . Hence, we have the stress balance along the droplet surface,
| (3) |
Since the glycerol surface stress mN/m was independent of the crosslinking density , the surface stress of the gels can be determined exclusively by the opening angle in Eq. 3. The hollow red squares in Fig 3b shows how varied with the crosslinker ratio as the deposited liquid was glycerol. From to , increased by almost , from mN/m to mN/m.
The wetting profiles in Fig. 2a were compared to a continuum elastic model Style and Dufresne (2012) by using the surface stresses () and the shear moduli () of the soft gels with different crosslinking densities (see the Supplemental Materials for calculation details). As shown by the dashed lines in Fig. 2a, the theoretical predictions fitted well to the wetting profiles measured in experiments. Since was determined by local geometries of the wetting ridges based on Eq. 3, the nice agreement between the theory and experiments suggests that the surface stresses extracted from Neumann’s triangle are consistent with the overall surface deformations induced by the wetting of glycerol droplets.
.
A similar dependence on the crosslinking density () was also observed in the wetting profiles of fluorinated oil droplets. As shown in the Fig. 2b, the surface deformations were small due to the low surface stresses of fluorinated oil. When increasing from to , the opening angles () increased moderately from 124 to 138 degrees (the solid blue triangles in Fig. 3a). Due to the asymmetric wetting profiles in Fig. 2b, the surface stresses along the different arms of the ridges were not equal, . Therefore, we must consider the stress balances along both the and directions in this case to extract the surface stresses of the soft gels (as indicated by the inset of Fig.2b). The hollow blue triangles in Fig 3b show how the surface stress at the gel-air interfaces, , varied with the cross-linker ratio when the deposited liquid was fluorinated oil. From to , increased gradually from mN/m to mN/m.
The change of gel surface stress with crosslinking density for both deposited liquids is in contrast to the constant surface energy found in contact angle measurements. In a control experiment, we measured the surface stress of uncrosslinked polydimethylsiloxane (PDMS) in air, mN/m, by using the pendant droplet method (Fig. 3b inset) Hansen and Rødsrud (1991). Since the uncrosslinked PDMS is a Newtonian liquid, we assume its surface stress and surface energy to be equal, . Also because the surface energy of gels does not vary with the density of crosslinkers, we further assume that mN/m. This value of is indicated in Fig. 3b by the black solid line. Meanwhile, as shown by both the red squares and blue triangles in the figure, we consistently found that for all of the samples we measured. The difference between and gradually diminished as the density of crosslinkers decreased. By applying linear extrapolations to the surface stress results measured with glycerol and fluorinated oil droplets in Fig. 3b, we estimated that at a critical crosslinking density the surface stress and surface energy of the soft gels became approximately equal, .
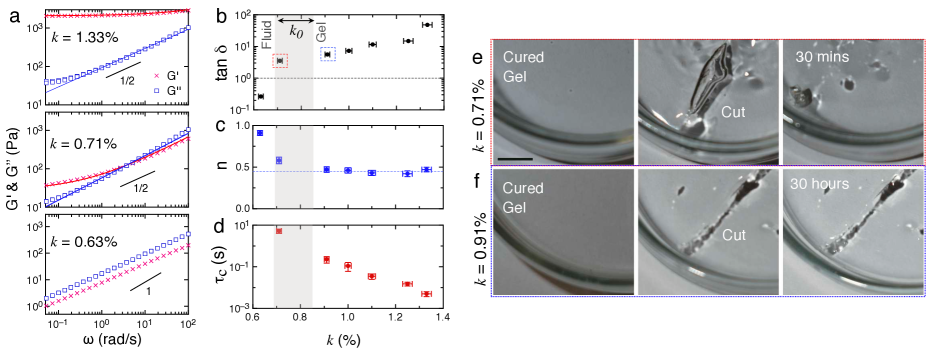
To understand the physical implications of the critical density , we compared the surface properties with the bulk rheology of the soft gels near this transition. To characterize the viscoelasticity of the soft gels, we applied oscillation rheological tests to the materials at a small sweeping amplitude . For each crosslinking density, we measured how the storage modulus and loss modulus varied with the angular frequency . Figure 4a shows typical viscoelastic spectra of the gels with , and , respectively. At , the storage modulus was consistently greater than the loss modulus, . In this regime, solid-like gels formed properly. By contrast, as the ratio of crosslinkers decreased below , the storage modulus became smaller than the loss modulus, , suggesting that the viscous dissipation dominated the stress responses. At , for example, the pre-mixed solution formed a gel by curing with difficulty and remained fluid at room temperature. Near the critical density (), a very low shear modulus Pa can be measured. However, remained consistently greater than only in the low frequency regime, rad/s. For rad/s, the storage modulus and the loss modulus modulus became approximately equal, . As shown in Fig. 4b, this change in rheological behaviors is manifested in the plot of the phase delay () against at a low frequency rad/s. The phase shift is defined by the ratio of storage modulus and loss modulus, . The grey area in the plot indicates the transition regime near , and the black dashed line represents the critical condition of at .
We further quantitatively compared the experimental results of and with a power-law rheological model proposed by Chasset and Thirion Chasset and Thirion (1965); Vega et al. (2001),
| (4) |
where is a scaling index related to the network and is an intrinsic relaxation time scale Long et al. (1996). At , the viscoelastic spectrum of the soft gels can be well described by Eq. 4. As the ratio of crosslinkers decreases from 1.33% to 0.91%, the fitted scaling index remained approximately constant around (Fig. 4c) while the relaxation time scale increased substantially by two orders of magnitude (Fig. 4d), from ms to s. These results imply that the invariant scaling index is a signature of a percolated network formed in the soft gels Winter and Chambon (1986). The associated viscoelastic relaxations, however, will slow significantly as the network softens. By contrast, due to the lack of a properly formed network, and could no longer be fitted to Eq. 4 at a low crosslinking density, . In this regime, although the relaxation time of the materials can not be determined, we observed an approximately linear scaling for the viscoelastic moduli against the angular frequency, .
Near the critical density , the materials showed unique mechanical properties. At , for example, the viscoelastic moduli of the materials, and , can be well fitted to Eq. 4 with a scaling index and a long relaxation time s. Since the Chasset-Thirion model has been widely used to explain the rheology of polymeric networks surrounded by free chains Vega et al. (2001); Batra et al. (2005); Karpitschka et al. (2015); Martin et al. (2008), the results suggest that a percolated network with a small rigidity had already formed in this transition regime. However, the material surfaces remained to show liquid-like features in the response to interfacial fractures. As demonstrated in the images of Fig. 4e, a slight cut by a razor blade on the gel surfaces could be healed spontaneously in 30 minutes which was much longer than the viscoelastic relaxation time s. This slow self-healing character indicates a high diffusivity of polymer chains at the interface Xu et al. (2020) while the bulk contained a weakly crosslinked network. For this reason, a nice coating of the fluorescent nano-particles at the interfaces became impossible when the crosslinking density was close to . In a control experiment, as long as we increased the crosslinker ratio to , a similar cut on gel surfaces in Fig. 4f remained permanently.
III Discussions and Conclusions
Having observed the relationship between the surface properties and crosslinking densities of the soft gels, we now consider possible explanations to the results. Since the overall geometry of the wetting ridges can be well captured by a continuum mechanical model, the role of any possible phase separations Cai et al. (2021) of the excessive free chains near contact points should be insignificant in determining the surface stress. To further confirm this conclusion, we applied toluene treatmentsXu et al. (2020) to partially remove the excessive free chains near the interfaces. For these partially dried samples, the increase of surface stress with the crosslinking density were still observed in the local measurements of the wetting profiles (see the supplemental materials).
Here we interpret the effects of the crosslinking density by considering the surface elasticity of the gels Xu et al. (2017). As an example, the surface modulus for two different crosslinking densities, and respectively, can be estimated from the glycerol-induced wetting profiles. By locating the positions of fluorescent beads before and after depositing the glycerol droplets, we can determine their movements along the wetting ridges Boltyanskiy et al. (2017). By calculating the average surface deformations within the elastocapillary length, we can estimate the local surface strain () near the contact points Xu et al. (2017, 2018). For and , we approximately have and . Considering a linear model for the surface stress , we estimate that the surface modulus decreases from 93.1 mN/m to 37.5 mN/m as the crosslinker ratio changes from to . Recent experiments involving spontaneous flattening on patterned gel surfaces also revealed a decrease of surface elastic modulus with gel stiffness Bain et al. (2021). For , we expect surface elasticity to vanish, . In this regime, the average spacing between crosslinkers is too large to affect inter-polymer interactions. Thus, the material surface preserves the liquid-like feature, . For , surface elasticity appears () when the storage modulus becomes the dominating term for the bulk rheology. As a result, the surface stress is increased by local wetting profiles and hence we measured in experiments.
We further relate our results to the Shuttleworth effect, which was previously reported to explain the contact mechanics of soft silicone gels Xu et al. (2017); Jensen et al. (2017); Marchand et al. (2012); van Gorcum et al. (2018). From the thermodynamics of any material interfaces, the relationship between surface stress and surface energy can be expressed by the Shuttleworth equation,
| (5) |
where and both depend on surface strains Cammarata and Sieradzki (1994). Considering in Eq. 5, we can write the surface energy as where . The change of surface energy with surface strain hence follows a parabolic scaling, , while the change of surface stress scales linearly with the surface strain, . The scaling difference between and can help to explain why we observed no change in the gel surface energy with crosslinking density . Considering that is around due to the wetting ridges, the maximum increase in is on the order of mN/m, smaller than the uncertainty of the droplet surface stress measured in Fig. 1. Therefore, the contact angle measurements can not resolve the insignificant changes in gel surface energy during soft wetting.
Since surface stress () and surface energy () show strikingly different dependencies on crosslinking density, the macroscopic contact angle alone can not decide the surface properties of soft polymeric gels. Our results show the importance of measuring the wetting profiles at different length scales to quantify the surface mechanics of soft gels fully. The distinction between the two regimes, and , suggests a fundamental difference between the surfaces of soft gels and liquids. The crossover between the two regimes signifies a liquid-to-gel phase transition in the bulk.
Conflict of interest
The authors declare no competing financial interests.
Acknowledgments
We acknowledge Dr. Robert Style for useful discussions. We thank V. M. Vaisakh for helping us with the experiments with reduced free chains. We thank the support from the Early Career Scheme from the Hong Kong Research Grant Council (Grant No. HKUST 26309620).
Supplemental Materials
III.1 Measurements of the surface stresses of liquid droplets
We measured the surface stress of Newtonian liquids (including glycerol, fluorinated oil and silicone oil) by numerically analyzing their droplet profiles. The images of both sessile and pendant droplets were taken by a digital Nikon D5600 camera equipped with a 105 mm macro-lens. The droplet edges were resolved by using the Canny boundary detector. The surface curvatures at the droplet interface () result from the balance between the Laplace pressure and the hydrostatic pressure,
| (6) |
where is the curvature at the apex and is the density difference between the droplet and the surrounding medium. Since we only measured droplets in air, the density difference can be replaced by liquid density . The sign, , on the right-handed side of Eq. 6 is determined by whether the image was taken for a sessile droplet () or a pendant droplet ().
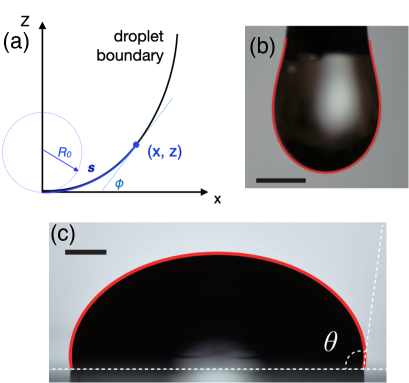
Considering the axial symmetry of the droplet profiles, the boundary can be projected onto a 2D rz-coordinate plane (see Fig.5 a). We use and to denote the arc length and the angle of the slope at the boundary interface, respectively. Therefore, and . Therefore, Eq. 6 can be rewritten in a parametric form,
| (7) |
where the coordinates are normalized to the dimensionless variables and . We can calculate the droplet profile numerically through the iterations of Eq. 7. The droplet surface stress is considered to be successfully determined when the numerical result fits well with the imaged droplet profile. Equations 6 and 7 can be applied to both pendant (Fig. 5b) and sessile droplets (Fig. 5c).
III.2 Confocal microscopy imaging of the local wetting profiles
To place the tracers on the surfaces of soft silicone gels, we deposited a solution droplet containing 200-nm beads on the surfaces of the cured gels for at least 3 h. During the coating process, the entire sample was sealed properly to avoid any evaporation. A fraction of the beads in the solution diffused to the gel and adhered to the interface. As a result, a layer of nicely coated fluorescent beads was left on the gel surfaces when the solution was removed. In the soft wetting experiments, we used a spinning-disk laser confocal microscope (Lecia SP8) to image the region close to the contact point. By locating the fluorescent beads in 3D, we can reconstruct the wetting profiles by using our previously developed MATLAB codes (as shown in Fig. 6 a-d). Due to axial symmetry of the droplet geometry, all of the wetting profiles are collapsed to the 2D plane. For each gel substrate, we varied the droplet radius and collapsed the wetting profiles near the contact point to confirm the validity of the Neumann’s triangle (Fig. 6 e).
III.3 Wetting profiles on the gels with reduced free chains
To investigate the role of free chains in surface stress measurements, we performed control experiments on gel surfaces with reduced amounts of uncrosslinked polymers. The samples were prepared through the following three steps. First, a cured gel substrate coated on a glass slide was submerged in a toluene solution mixed with ethanol for 24 h. The process greatly swelled the gel networks and extracted uncrosslinked polymers by osmotic pressure near the gel interfaces. Second, we removed the surrounding solution containing the free chains and then waited for another 24 h for the toluene and ethanol to dry out. Third, we repeated the first two steps again to further reduce the amount of free chains near the interfaces. This treatment decreased the substrate mass by approximately without increasing the surface roughness. Figures 7 a and b show the wetting profiles before and after the treatment for and , respectively.
III.4 A Continuum elastic model for soft wetting
In this work, we extended the linear elastic theory proposed by Style, et al. (Ref.[29] in the paper) to soft wetting with a given contact angle . The calculation assumes that , which is consistent with the experiments on glycerol droplets. The governing equations of the displacement and stress fields, and , of the substrate are
| (8) | |||
| (9) |
Considering the boundary conditions due to the gel surface stress and liquid surface tension
| (10) | |||
| (11) |
we can solve equations by applying Hankel transformations to both the displacement and stress fields . As a result, the surface profile can be written as
| (12) |
The dashed lines in the Fig. 2a of the main manuscript were calculated by using Eq. 12 with the experimental parameters for various cross-linking densities. The Poisson ratio was chosen as in the calculations, which is consistent with the results obtained from our previous measurements (see Ref. [22] in the main manuscript).
References
- Andreotti and Snoeijer (2020) B. Andreotti and J. H. Snoeijer, Annual Review of Fluid Mechanics, 2020, 52, 285–308.
- Style et al. (2017) R. W. Style, A. Jagota, C.-Y. Hui and E. R. Dufresne, Annual Review of Condensed Matter Physics, 2017, 8, 99–118.
- Chung and Chaudhury (2005) J. Y. Chung and M. K. Chaudhury, The Journal of Adhesion, 2005, 81, 1119–1145.
- Long et al. (2021) R. Long, C.-Y. Hui, J. P. Gong and E. Bouchbinder, Annual Review of Condensed Matter Physics, 2021, 12, 71–94.
- Creton and Ciccotti (2016) C. Creton and M. Ciccotti, Reports on Progress in Physics, 2016, 79, 046601.
- Liu et al. (2020) J. Liu, S. Lin, X. Liu, Z. Qin, Y. Yang, J. Zang and X. Zhao, Nature Communications, 2020, 11, 1071.
- Style et al. (2018) R. W. Style, T. Sai, N. Fanelli, M. Ijavi, K. Smith-Mannschott, Q. Xu, L. A. Wilen and E. R. Dufresne, Phys. Rev. X, 2018, 8, 011028.
- Wei et al. (2020) X. Wei, J. Zhou, Y. Wang and F. Meng, Phys. Rev. Lett., 2020, 125, 268001.
- Orowan (1970) E. Orowan, Proceedings of the Royal Society of London. A. Mathematical and Physical Sciences, 1970, 316, 473–491.
- Cammarata and Sieradzki (1994) R. C. Cammarata and K. Sieradzki, Annual Review of Materials Science, 1994, 24, 215–234.
- Streitz et al. (1994) F. H. Streitz, R. C. Cammarata and K. Sieradzki, Phys. Rev. B, 1994, 49, 10699–10706.
- Liang et al. (2018) H. Liang, Z. Cao, Z. Wang and A. V. Dobrynin, ACS Macro Letters, 2018, 7, 116–121.
- Xu et al. (2018) Q. Xu, R. W. Style and E. R. Dufresne, Soft Matter, 2018, 14, 916–920.
- Snoeijer et al. (2018) J. H. Snoeijer, E. Rolley and B. Andreotti, Phys. Rev. Lett., 2018, 121, 068003.
- Chen et al. (2019) S.-Y. Chen, A. Bardall, M. Shearer and K. E. Daniels, Soft Matter, 2019, 15, 9426–9436.
- Liang et al. (2018) H. Liang, Z. Cao, Z. Wang and A. V. Dobrynin, Langmuir, 2018, 34, 7497–7502.
- Schulman et al. (2018) R. D. Schulman, M. Trejo, T. Salez, E. Raphaël and K. Dalnoki-Veress, Nature Communications, 2018, 9, 982.
- Style et al. (2013) R. W. Style, R. Boltyanskiy, Y. Che, J. S. Wettlaufer, L. A. Wilen and E. R. Dufresne, Phys. Rev. Lett., 2013, 110, 066103.
- Xu et al. (2017) Q. Xu, K. E. Jensen, R. Boltyanskiy, R. Sarfati, R. W. Style and E. R. Dufresne, Nature Communications, 2017, 8, 555.
- Smith-Mannschott et al. (2021) K. Smith-Mannschott, Q. Xu, S. Heyden, N. Bain, J. H. Snoeijer, E. R. Dufresne and R. W. Style, Phys. Rev. Lett., 2021, 126, 158004.
- Jensen et al. (2015) K. E. Jensen, R. Sarfati, R. W. Style, R. Boltyanskiy, A. Chakrabarti, M. K. Chaudhury and E. R. Dufresne, Proceedings of the National Academy of Sciences, 2015, 112, 14490–14494.
- Xu et al. (2020) Q. Xu, L. A. Wilen, K. E. Jensen, R. W. Style and E. R. Dufresne, Phys. Rev. Lett., 2020, 125, 238002.
- Hansen and Rødsrud (1991) F. Hansen and G. Rødsrud, Journal of Colloid and Interface Science, 1991, 141, 1–9.
- Hourlier-Fargette et al. (2018) A. Hourlier-Fargette, J. Dervaux, A. Antkowiak and S. Neukirch, Langmuir, 2018, 34, 12244–12250.
- Zhao et al. (2018) M. Zhao, F. Lequeux, T. Narita, M. Roché, L. Limat and J. Dervaux, Soft Matter, 2018, 14, 61–72.
- Hourlier-Fargette et al. (2017) A. Hourlier-Fargette, A. Antkowiak, A. Chateauminois and S. Neukirch, Soft Matter, 2017, 13, 3484–3491.
- Wong et al. (2020) W. S. Y. Wong, L. Hauer, A. Naga, A. Kaltbeitzel, P. Baumli, R. Berger, M. D‘Acunzi, D. Vollmer and H.-J. Butt, Langmuir, 2020, 36, 7236–7245.
- Style et al. (2013) R. W. Style, Y. Che, S. J. Park, B. M. Weon, J. H. Je, C. Hyland, G. K. German, M. P. Power, L. A. Wilen, J. S. Wettlaufer and E. R. Dufresne, Proceedings of the National Academy of Sciences, 2013, 110, 12541–12544.
- Style and Dufresne (2012) R. W. Style and E. R. Dufresne, Soft Matter, 2012, 8, 7177–7184.
- Chasset and Thirion (1965) R. Chasset and P. Thirion, Proceedings of the Conference on Physics of Non-Crystalline Solids, 1965.
- Vega et al. (2001) D. A. Vega, M. A. Villar, J. L. Alessandrini and E. M. Vallés, Macromolecules, 2001, 34, 4591–4596.
- Long et al. (1996) D. Long, A. Ajdari and L. Leibler, Langmuir, 1996, 12, 5221–5230.
- Winter and Chambon (1986) H. H. Winter and F. Chambon, Journal of Rheology, 1986, 30, 367–382.
- Batra et al. (2005) A. Batra, C. Cohen and L. Archer, Macromolecules, 2005, 38, 7174–7180.
- Karpitschka et al. (2015) S. Karpitschka, S. Das, M. van Gorcum, H. Perrin, B. Andreotti and J. H. Snoeijer, Nature Communications, 2015, 6, 7891.
- Martin et al. (2008) G. Martin, C. Barrès, P. Cassagnau, P. Sonntag and N. Garois, Polymer, 2008, 49, 1892–1901.
- Cai et al. (2021) Z. Cai, A. Skabeev, S. Morozova and J. T. Pham, Communications Materials, 2021, 2, 21.
- Boltyanskiy et al. (2017) R. Boltyanskiy, J. W. Merrill and E. R. Dufresne, Soft Matter, 2017, 13, 2201–2206.
- Bain et al. (2021) N. Bain, A. Jagota, K. Smith-Mannschott, S. Heyden, R. W. Style and E. R. Dufresne, arXiv:2104.10578, 2021.
- Jensen et al. (2017) K. E. Jensen, R. W. Style, Q. Xu and E. R. Dufresne, Phys. Rev. X, 2017, 7, 041031.
- Marchand et al. (2012) A. Marchand, S. Das, J. H. Snoeijer and B. Andreotti, Phys. Rev. Lett., 2012, 108, 094301.
- van Gorcum et al. (2018) M. van Gorcum, B. Andreotti, J. H. Snoeijer and S. Karpitschka, Phys. Rev. Lett., 2018, 121, 208003.